On 12/05/2023 14:47, Oleg Kalnichevski wrote:
On Fri, 2023-05-12 at 14:17 +0100, thc...@gmail.com wrote:
On 12/05/2023 13:27, Oleg Kalnichevski wrote:
On Fri, 2023-05-12 at 11:48 +0200, Joan grupoventus wrote:
Hi Oleg,
After changing this method from:
private TlsStrategy getTLSStrategy() throws Exception {
return (DefaultClientTlsStrategy.getDefault());
}
To:
private TlsStrategy getTLSStrategy() throws Exception {
return
ClientTlsStrategyBuilder.create().setSslBufferMode(SSLBufferMode.
DYNA
MIC).build();
}
And set this strategy to the pool:
this.phccm =
PoolingAsyncClientConnectionManagerBuilder.create().setPoolConcur
renc
yPolicy(PoolConcurrencyPolicy.LAX).setTlsStrategy(this.getTLSStra
tegy
()).build();
The histogram shows the same:
num #instances #bytes class name
----------------------------------------------
1: 233151 3208489352 [B
2: 182882 52757328 <methodKlass>
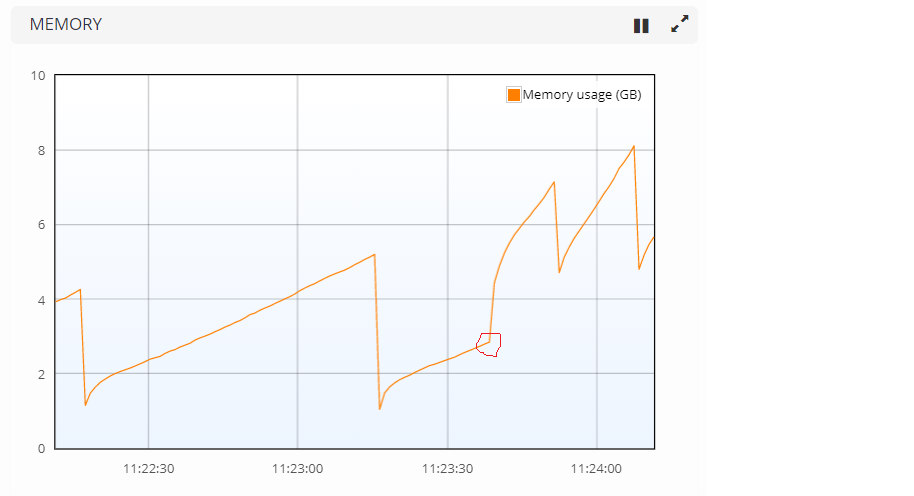
This chart shows the execution under http and the change to https
at
11:23:35:
http://www.grupoventus.com/resources/spike.png
With http, at the end of each GC cycle the amount of heap used is
around 1,5GB.
At the moment we dynamically change to https you can see a spike
from
3GB to 7GB. Next GC cycles frees memory until around 5GB, and
remains
there.
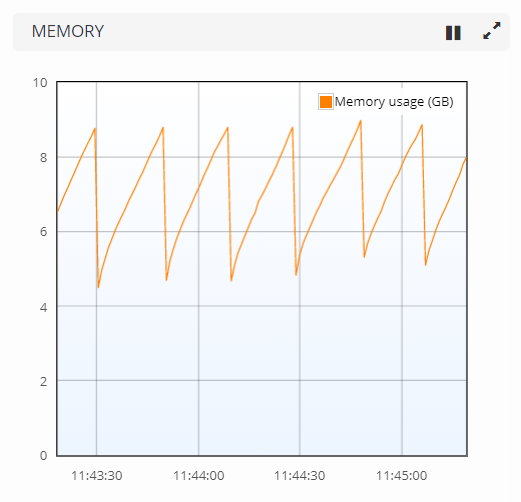
Here the chart with the execution already with https during
several
minutes, never lows from the 5GB:
http://www.grupoventus.com/resources/https.png
The point is that here traffic is very low, in production this
traffic is much higher so the spike is about 20GB and the heap
becomes exhausted.
Joan.
This unfortunately does not help. This is only so much I can do
just by
looking at the charts.

There are two options going forward:

1. You manage to reproduce the issue in an isolated environment
that I
can replicate locally (Docker image or a unit test).

2. You manage to find out the cause of FrameOutputBuffer growing
past
the max frame length in your local environment and propose a fix,
which
I can review and test locally.
fwiw, I don't think it's growing past the max frame length, it's at
the
max (16MB).

I see this as well and my conclusion (which might be wrong) is that
HC
allocates the max immediately and it's kept that way for as long as
the
connection is open (which for HTTP/2 might be a long time).
So the more connections you have open the more memory is allocated
(and
for my case actually unused/needed, in my case it's not sending nor
receiving more than 100s of KBs).

afaik to reproduce you just need a server advertising that it can
handle
the max frame length and HC will reserve the whole chunk. (I also
tried
using a custom H2Config with smaller max frame length but it still
allocates what the other endpoint advertises.)

Hopefully this helps somehow.

Best regards.
Please configure HttpClient to use smaller (much smaller) max frame
length.
I'm using:
.setH2Config(H2Config.custom().setMaxFrameSize(MAX_FRAME_SIZE).build())

with MAX_FRAME_SIZE as 2MB but it still creates 16MB.

(Thought I need to update the client, still at 5.2-beta1.)

Thank you.
Best regards.
Oleg
Oleg
-----Original Message-----
From: Oleg Kalnichevski <ol...@apache.org>
Sent: Friday, May 12, 2023 9:47 AM
To: HttpClient User Discussion <httpclient-users@hc.apache.org>
Subject: Re: Httpclient issue with https
"org.apache.hc.core5.http2.impl.nio.ClientH2StreamMultiplexer"

On Thu, 2023-05-11 at 19:17 +0200, Joan grupoventus wrote:
Hello Oleg,
We are finding an issue in a new installation of our app that
is
using
httpclient5-5.2.1 and httpcore5-5.2.
Our app is a proxy that receives protobuf requests that are
sent to
an
amazon endpoint that is responding with protobuf responses. We
started
this communication by using plain http, processing around
4.000 req/s. Everything OK.
But when we move to live https must be used to communicate with
this
endpoint, just changing the url from http:// to https://
So we changed it and after 30 seconds testing we got an
OutOfMemoryException, the heap was exhausted.
Below an histogram using http (just the first 2 items):
num #instances #bytes class name
----------------------------------------------
1: 181753 52412760 <methodKlass>
2: 218819 46398592 [B
And the histogram using https after 30s:
num #instances #bytes class name
----------------------------------------------
1: 224873 3216328416 [B
2: 182417 52604088 <methodKlass>
So the space occupied by byte arrays moves from 46Mb to 3GB. So
we
decided to perform a heap dump and analyze it to find out where
these
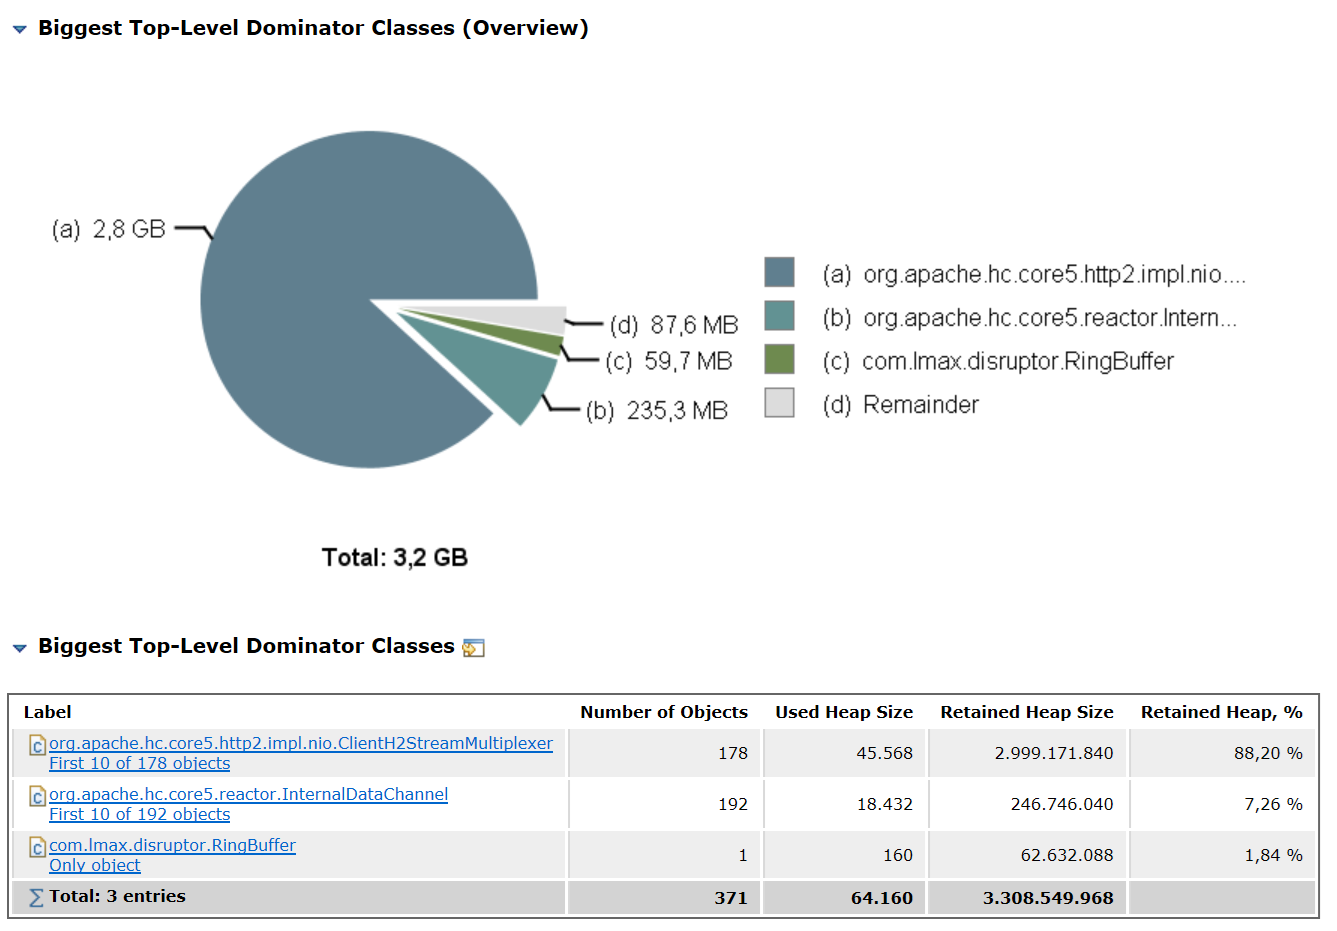
3GB byte arrays are coming from, and we have seen this:
178 instances of
"org.apache.hc.core5.http2.impl.nio.ClientH2StreamMultiplexer",
loaded by "org.apache.catalina.loader.ParallelWebappClassLoader
@
0x400768258e8" occupy 2.999.171.840 (88,20 %) bytes
http://www.grupoventus.com/resources/top_dominator_class.png
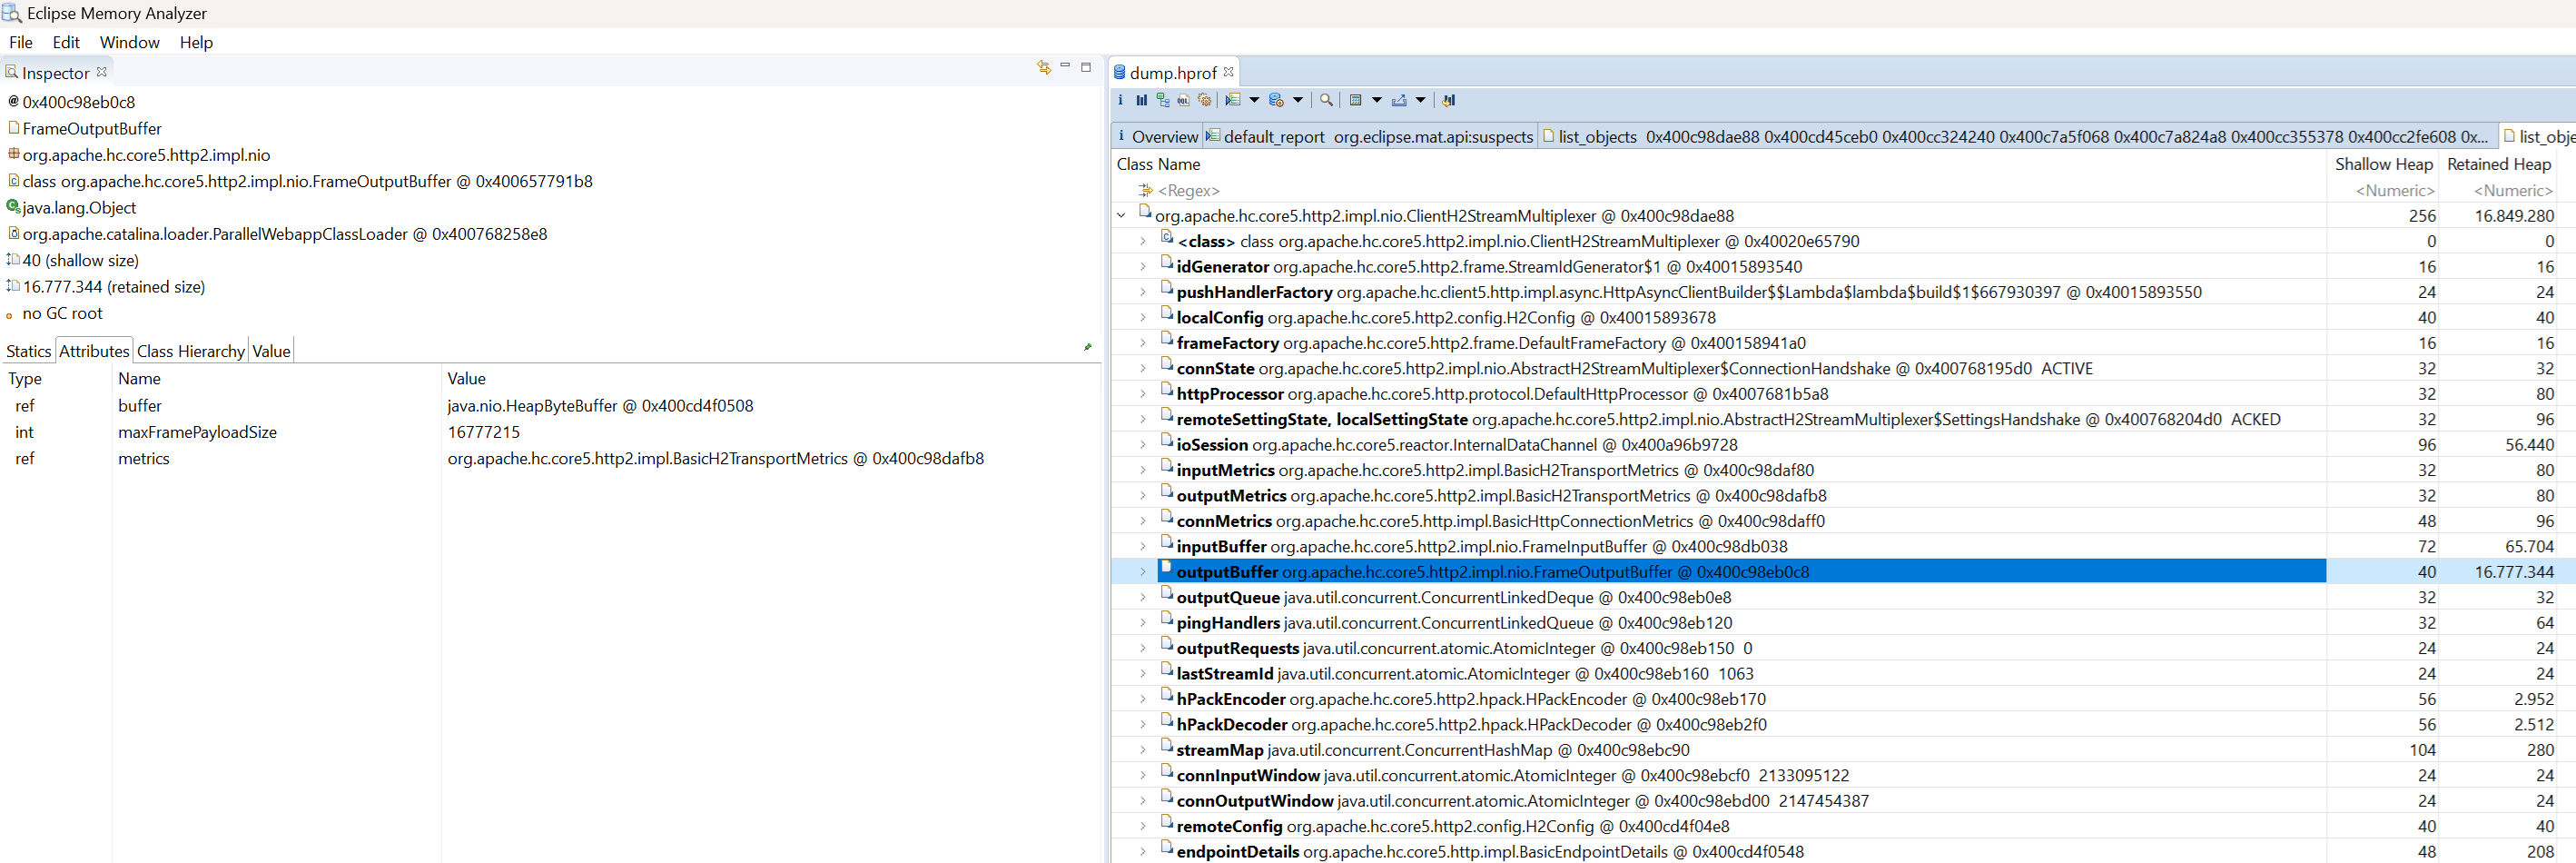
If we analyze each one of these 178 instances of
ClientH2StreamMultiplexer, it seems the OutputBuffer is holding
around
16Mb for each instance, multiplied by 178 gives as a result
these
3GB:
http://www.grupoventus.com/resources/output_buffer.png
I’m not sure if this is a bug, we have been using https with
these
same versions against other endpoints and we never had a
problem.
Anyways it does not seem a memory leak, because if you keep the
traffic stable, the space occupied by these instances seems to
not
be
growing.
Let me know what you think, and if you need more information
(logs
about http traffic, etc).
Thanks,
Joan.
Hi Joan

This sounds odd. I see no reason why FrameOutputBuffer should
ever
grow beyond the size of the maximum frame size and do not see how
this could be possibly be related to TLS. Nevertheless, this may
well
be a bug that gets triggered by the use of the transport
encryption.

Please do one thing, though, first. Please make sure you
configure
the I/O reactors to use a custom TLS strategy with SSLBufferMode
set
to DYNAMIC. This will make the I/O reactor release intermediate
TLS
buffers which should substantially decrease the total memory
footprint of TLS connections at the cost of extra memory
allocation /
de- allocation.

Oleg


-----------------------------------------------------------------
----
To unsubscribe, e-mail:
httpclient-users-unsubscr...@hc.apache.org
For additional commands, e-mail:
httpclient-users-h...@hc.apache.org


-----------------------------------------------------------------
----
To unsubscribe, e-mail:
httpclient-users-unsubscr...@hc.apache.org
For additional commands, e-mail:
httpclient-users-h...@hc.apache.org
-------------------------------------------------------------------
--
To unsubscribe, e-mail: httpclient-users-unsubscr...@hc.apache.org
For additional commands, e-mail:
httpclient-users-h...@hc.apache.org
---------------------------------------------------------------------
To unsubscribe, e-mail: httpclient-users-unsubscr...@hc.apache.org
For additional commands, e-mail: httpclient-users-h...@hc.apache.org
---------------------------------------------------------------------
To unsubscribe, e-mail: httpclient-users-unsubscr...@hc.apache.org
For additional commands, e-mail: httpclient-users-h...@hc.apache.org
---------------------------------------------------------------------
To unsubscribe, e-mail: httpclient-users-unsubscr...@hc.apache.org
For additional commands, e-mail: httpclient-users-h...@hc.apache.org