On 12/05/2023 15:27, Oleg Kalnichevski wrote:
On Fri, 2023-05-12 at 15:25 +0100, thc...@gmail.com wrote:
On 12/05/2023 14:47, Oleg Kalnichevski wrote:
On Fri, 2023-05-12 at 14:17 +0100, thc...@gmail.com wrote:
On 12/05/2023 13:27, Oleg Kalnichevski wrote:
On Fri, 2023-05-12 at 11:48 +0200, Joan grupoventus wrote:
Hi Oleg,
After changing this method from:
private TlsStrategy getTLSStrategy() throws Exception {
return (DefaultClientTlsStrategy.getDefault());
}
To:
private TlsStrategy getTLSStrategy() throws Exception {
return
ClientTlsStrategyBuilder.create().setSslBufferMode(SSLBufferM
ode.
DYNA
MIC).build();
}
And set this strategy to the pool:
this.phccm =
PoolingAsyncClientConnectionManagerBuilder.create().setPoolCo
ncur
renc
yPolicy(PoolConcurrencyPolicy.LAX).setTlsStrategy(this.getTLS
Stra
tegy
()).build();
The histogram shows the same:
num #instances #bytes class name
----------------------------------------------
1: 233151 3208489352 [B
2: 182882 52757328 <methodKlass>
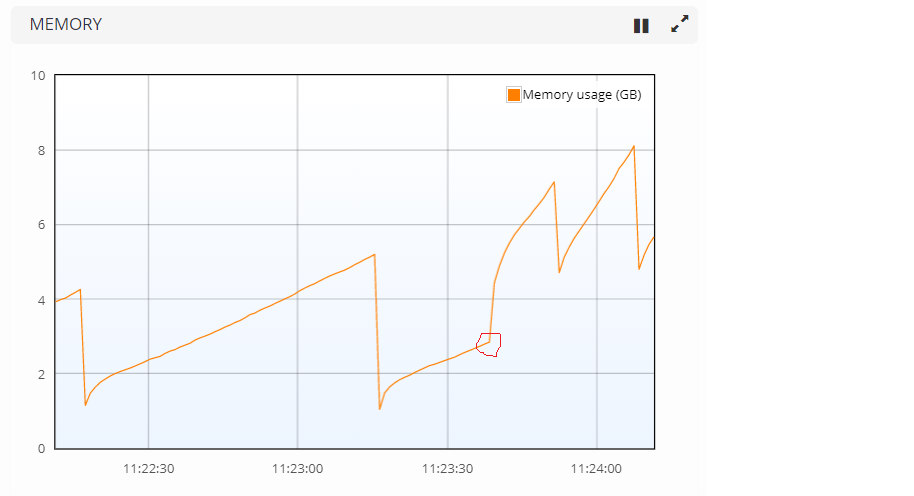
This chart shows the execution under http and the change to
https
at
11:23:35:
http://www.grupoventus.com/resources/spike.png
With http, at the end of each GC cycle the amount of heap
used is
around 1,5GB.
At the moment we dynamically change to https you can see a
spike
from
3GB to 7GB. Next GC cycles frees memory until around 5GB, and
remains
there.
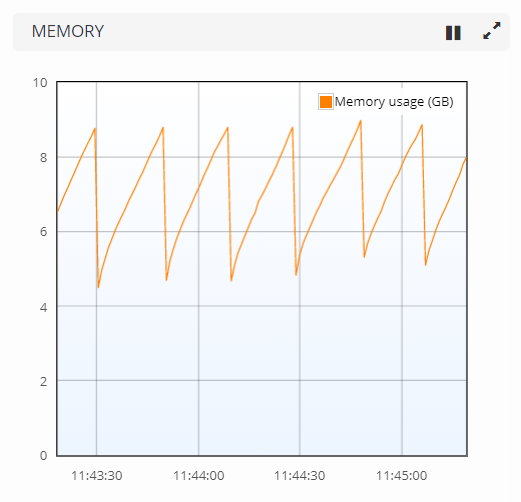
Here the chart with the execution already with https during
several
minutes, never lows from the 5GB:
http://www.grupoventus.com/resources/https.png
The point is that here traffic is very low, in production
this
traffic is much higher so the spike is about 20GB and the
heap
becomes exhausted.
Joan.
This unfortunately does not help. This is only so much I can do
just by
looking at the charts.

There are two options going forward:

1. You manage to reproduce the issue in an isolated environment
that I
can replicate locally (Docker image or a unit test).

2. You manage to find out the cause of FrameOutputBuffer
growing
past
the max frame length in your local environment and propose a
fix,
which
I can review and test locally.
fwiw, I don't think it's growing past the max frame length, it's
at
the
max (16MB).

I see this as well and my conclusion (which might be wrong) is
that
HC
allocates the max immediately and it's kept that way for as long
as
the
connection is open (which for HTTP/2 might be a long time).
So the more connections you have open the more memory is
allocated
(and
for my case actually unused/needed, in my case it's not sending
nor
receiving more than 100s of KBs).

afaik to reproduce you just need a server advertising that it can
handle
the max frame length and HC will reserve the whole chunk. (I also
tried
using a custom H2Config with smaller max frame length but it
still
allocates what the other endpoint advertises.)

Hopefully this helps somehow.

Best regards.
Please configure HttpClient to use smaller (much smaller) max frame
length.
I'm using:
.setH2Config(H2Config.custom().setMaxFrameSize(MAX_FRAME_SIZE).build(
))

with MAX_FRAME_SIZE as 2MB but it still creates 16MB.

(Thought I need to update the client, still at 5.2-beta1.)
Please see the two options I mentioned prior.
I will try create a reproducer.

Thank you.
Best regards.
Oleg


---------------------------------------------------------------------
To unsubscribe, e-mail: httpclient-users-unsubscr...@hc.apache.org
For additional commands, e-mail: httpclient-users-h...@hc.apache.org
---------------------------------------------------------------------
To unsubscribe, e-mail: httpclient-users-unsubscr...@hc.apache.org
For additional commands, e-mail: httpclient-users-h...@hc.apache.org