To comment on the following update, log in, then open the issue:
http://www.openoffice.org/issues/show_bug.cgi?id=98776
                 Issue #|98776
                 Summary|Diagram type "area, percentual stacked" ("Fläche, pro
                        |zentual gestapelt") is broken
               Component|Spreadsheet
                 Version|OOo 3.0.1
                Platform|PC
                     URL|
              OS/Version|Linux
                  Status|UNCONFIRMED
       Status whiteboard|
                Keywords|
              Resolution|
              Issue type|DEFECT
                Priority|P3
            Subcomponent|formatting
             Assigned to|spreadsheet
             Reported by|marvo
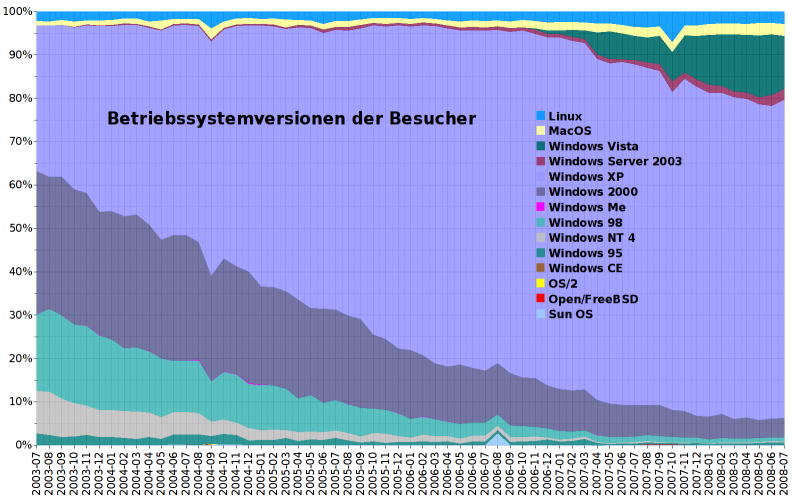
------- Additional comments from ma...@openoffice.org Tue Feb  3 09:04:08 +0000
2009 -------
The diagram type "area, percentual stacked" should display a ribbon with a
constant height (normalised to 100%) in which the components (y-values) should
be displayed in stripes of differing width. OOo 3.0.1 displays this diagram in a
non-normalised form like the simple stacked type.

An example how it should look like can be found at
http://www.martinvogel.de/blog/uploads/Diagramme/Betriebssystemversionenverteilung.png

Der Diagrammtyp "Fläche, prozentual gestapelt" sollte ein Band darstellen, das
für jede Gruppe von einem X- und mehreren Y-Werten die gleiche Höhe hat: 100%.
Innerhalb des Bandes haben die einzelnen Y-Werte unterschiedliche prozentuale
Anteile, nur diese dürfen variieren. Seit OOo 3.0.1 wird unsinnigerweise der
nicht normalisierte Absolutwert der Summen dargestellt - wie im gewöhnlichen
Stapeldiagramm.

---------------------------------------------------------------------
Please do not reply to this automatically generated notification from
Issue Tracker. Please log onto the website and enter your comments.
http://qa.openoffice.org/issue_handling/project_issues.html#notification

---------------------------------------------------------------------
To unsubscribe, e-mail: issues-unsubscr...@sc.openoffice.org
For additional commands, e-mail: issues-h...@sc.openoffice.org


---------------------------------------------------------------------
To unsubscribe, e-mail: allbugs-unsubscr...@openoffice.org
For additional commands, e-mail: allbugs-h...@openoffice.org