Hi Bernhard,

I just calculated k_sol and B_sol for all PDB entries that
     - have reflection data available,
     - I could re-compute the R-factor within 5%, and
     - R-work<30%
using a simple cctbx script. Here is what I get:
Distribution of k_sol:
0.000 - 0.060 : 27
0.060 - 0.120 : 12
0.120 - 0.180 : 51
0.180 - 0.240 : 182
0.240 - 0.300 : 1770
0.300 - 0.360 : 13819
0.360 - 0.420 : 19731
0.420 - 0.480 : 3039
0.480 - 0.540 : 471
0.540 - 0.600 : 256
Distribution of B_sol:
0.000 - 31.300 : 4349
31.300 - 62.600 : 29425
62.600 - 93.900 : 4578
93.900 - 125.200 : 597
125.200 - 156.500 : 225
156.500 - 187.800 : 84
187.800 - 219.100 : 37
219.100 - 250.400 : 23
250.400 - 281.700 : 10
281.700 - 313.000 : 30
It seems like the result of similar exercise done by Fokine and Urzhumtsev
(Acta Cryst. (2002). D58, 1387-1392) still holds (see figure 3 on page 1390
there).
Pavel
On Mon, Jan 30, 2012 at 11:10 AM, Bernhard Rupp (Hofkristallrat a.D.) <
hofkristall...@gmail.com> wrote:
> Dear All,
>
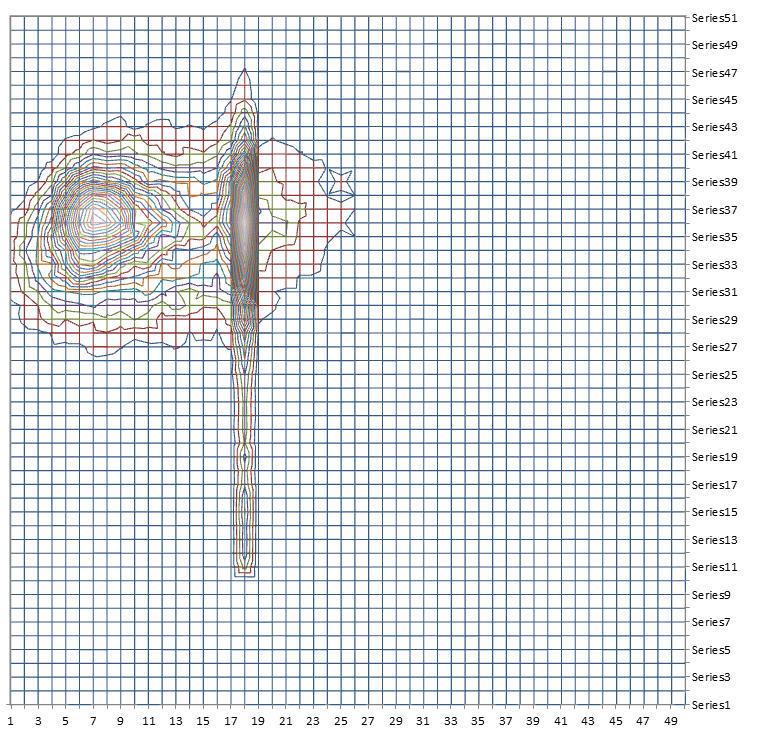
> when I plot bulk solvent B and K extracted from EDS, an improbable and
> bimodal distribution appears.
> In the B_sol vs k_sol PDF a sharp line of values with B-sol of 70 appears
> (B-axis left to right, 0-200).
>
> http://www.ruppweb.org/images/b_sol_contour.jpg
> http://www.ruppweb.org/images/b_sol_surface.jpg
>
> According to a quick peak at EDS instructions,
> it uses the REFMAC flat bulk solvent model throughout for bulk solvent
> correction.
>
> The main peak in fact has the expected distribution, but it seems that the
> sharp peak at B_sol=70
> represents some cut-off that in a certain set of calculations was used.
>
> For data mining it would be useful to know where/when these cutoffs were
> used.
>
> Best regards, BR
> -----------------------------------------------------------------
> Bernhard Rupp
> http://www.ruppweb.org/
> -----------------------------------------------------------------
>