davsclaus opened a new pull request, #29947:
URL: https://github.com/apache/camel/pull/29947
_Claude Code on behalf of davsclaus_ A route diagram showed counts that go up, and nothing more about where the messages go. With the metrics on, it now shows the messages moving, so the busy part of a large route stands out at a glance. 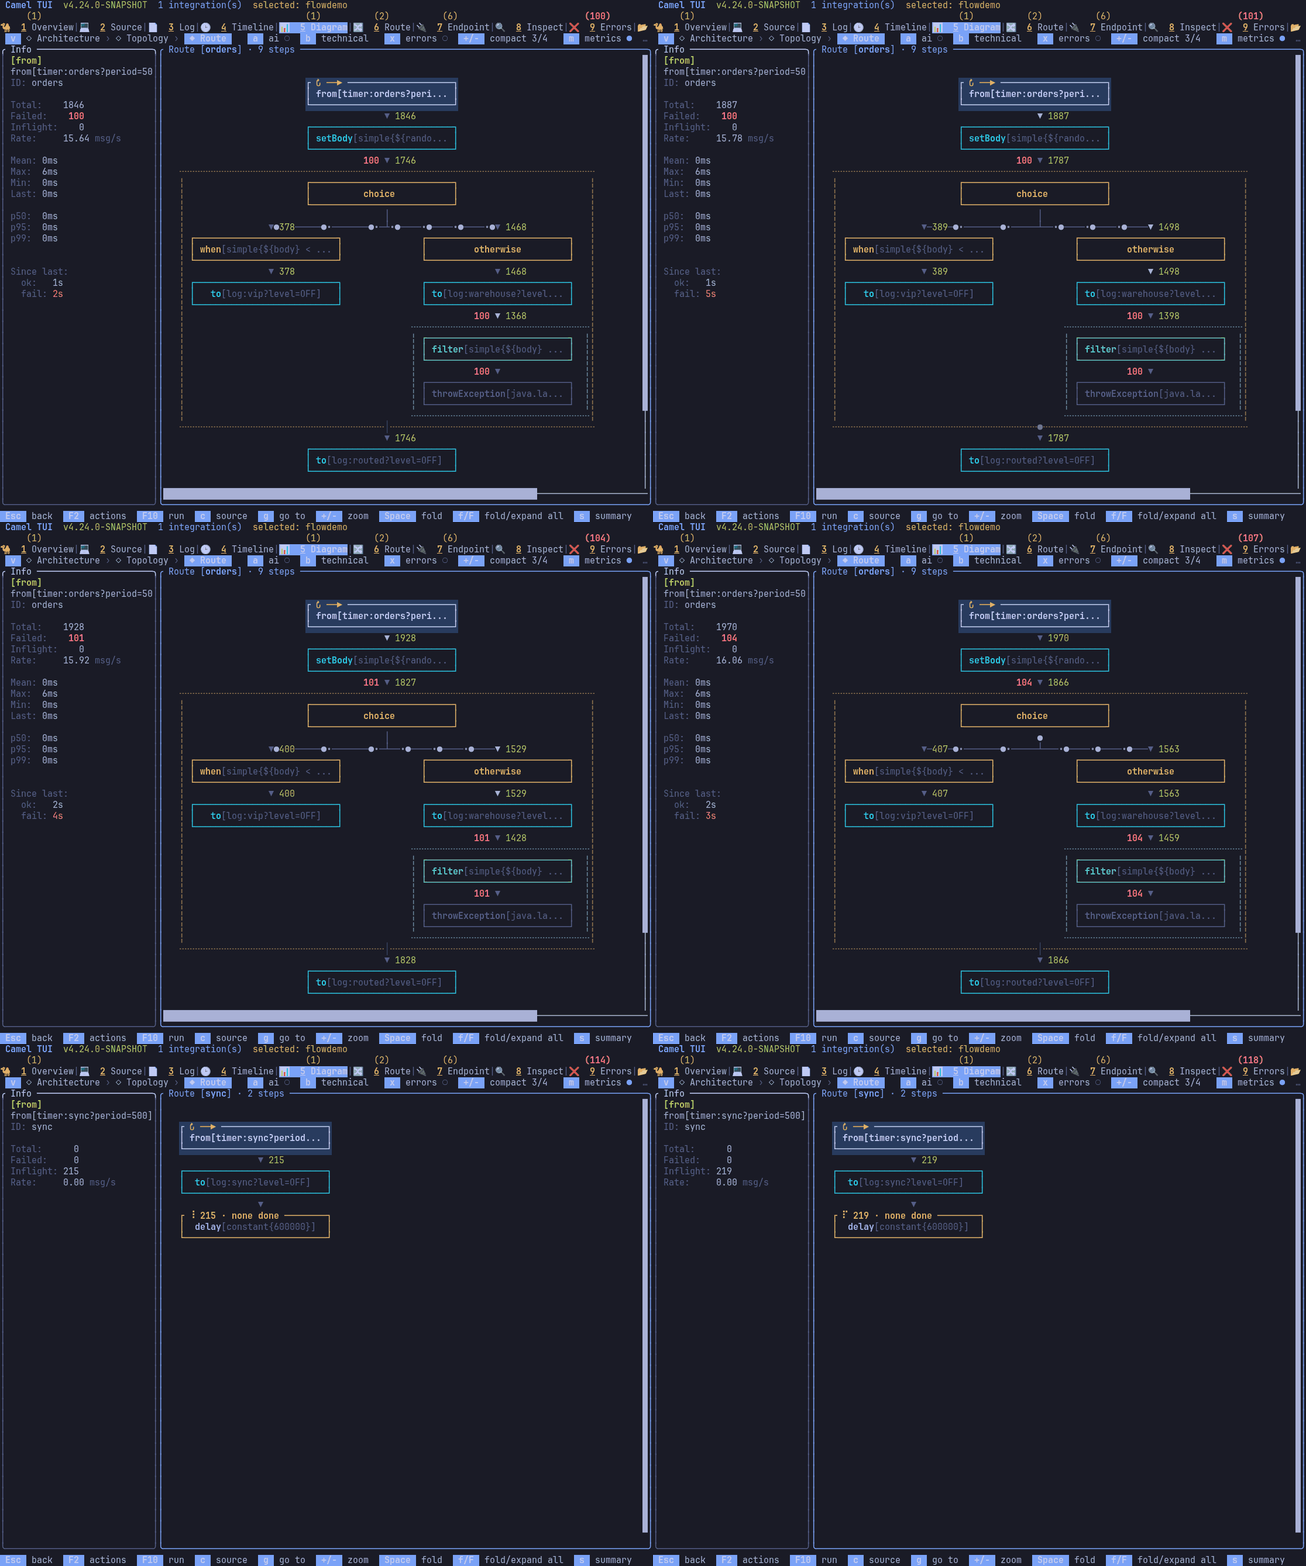 **Dots on the arrows.** Dots move along an arrow while messages reach the step below it. The more messages a second, the faster and closer together they are, so a branch of a `choice` that gets 80% of the messages is easy to tell from the one that gets 20%. They are red when most of the messages fail there. Counted from the top of the diagram, the dots go on below a box at the same pace. **Every zoom level.** - detailed: dots on the arrows. - compact: an arrow is often only its head, so the head lights up as a dot comes in. - bare: the lines light up instead, as a dot would look like the mark of a step there. - overview: there are hardly any lines between the steps, so a light passes over the steps themselves. The steps keep the colours of their kind at every level. **A stuck step.** When exchanges wait at a step and none has finished for a few seconds, its top border shows a spinner, how many wait, and how long ago the step last finished one: `⠹ 3 inflight · 12s`, or `none done` when it never did, such as a call to a system that does not answer. **Cost.** - The rates come from the counts the diagram already loads about once a second, so the integration does no extra work. - Frames are drawn in between, about 12 a second, only while something moves. An idle integration draws no frames. - Measured on a 20 msg/s demo: the TUI uses about 5–9% of a core while animating, against 0–3% with the flow off. `w` turns the flow off and on in a route diagram (Diagram tab and Routes tab), and the choice is kept for the next start. The topology view has no flow yet. An earlier version also warmed the busy steps (a heavy frame and brighter colours). It was dropped: the heat washed out the colours of the steps, most of all in the overview, and the dots already show where the messages go. **Changes** - `FlowAnimation` (new): the rate of each step and of the arrow into it, from the change of the counts between two reloads, smoothed for low rates and set to zero as soon as a reload has no new messages. It also finds the stuck steps and says when a frame is due. - `RouteDiagramWidget`: the dots, the lit lines and heads, the light over the overview steps, and the stuck text in the border. - `CamelMonitor` / `TabRegistry` / `AbstractDiagramTab`: a frame is drawn when the flow says one is due. `w` toggles it, and `RouteDiagramZoom` keeps the choice as `camel.tui.diagramFlow`. - Docs: a Live Flow section in `camel-jbang-tui-diagram.adoc` with the GIF, and the in-app help. - Tests: `FlowAnimationTest` (rates, smoothing, stale counts, stuck, frames only while something moves) and `FlowDotsTest` (dots move, boxes keep their frame and colour, lit lines at bare, light over the overview steps, the stuck text, nothing with the flow or the metrics off). The module's 2591 tests pass. 🤖 Generated with [Claude Code](https://claude.com/claude-code) -- This is an automated message from the Apache Git Service. To respond to the message, please log on to GitHub and use the URL above to go to the specific comment. To unsubscribe, e-mail: [email protected] For queries about this service, please contact Infrastructure at: [email protected]

