gehringf opened a new issue #15807:
URL: https://github.com/apache/echarts/issues/15807
### Version 5.2.1 ### Reproduction link [https://codesandbox.io/s/echarts-custom-series-sygpx?file=/src/chart.ts](https://codesandbox.io/s/echarts-custom-series-sygpx?file=/src/chart.ts) 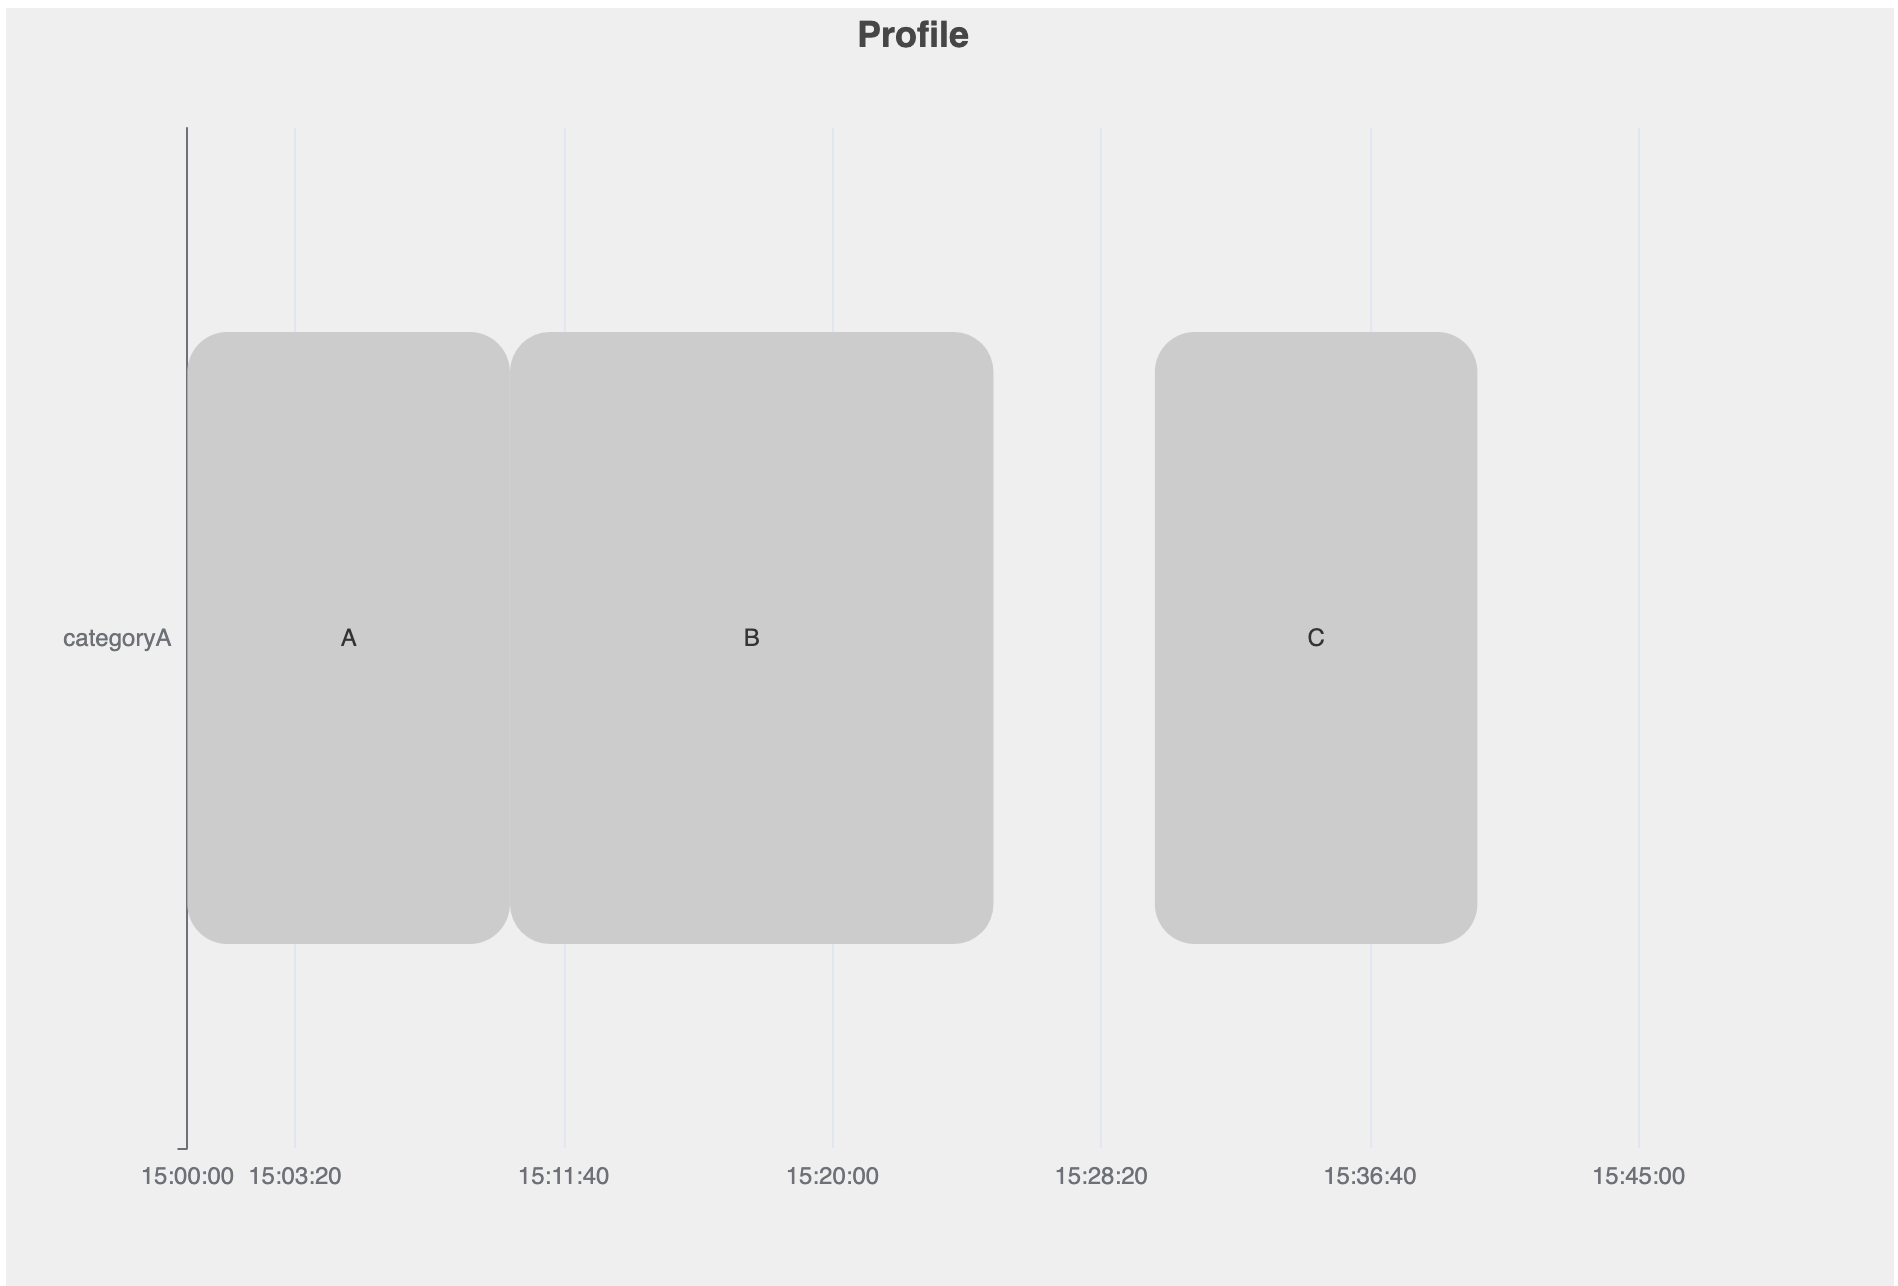 ### Steps to reproduce I need the axis of this chart to be flipped, so time is on yAxis (later at the top, earlier at the bottom). I have given it several tries but I always end up with the calculated rect being undefined. I think I'm doing something wrong with the api.coord calculation. Here's my latest attempt: https://codesandbox.io/s/echarts-custom-series-forked-qvqu2?file=/src/chart.ts Can you point me in the right direction? ### What is expected? The axis are flipped ### What is actually happening? I can't get it to work. --- Also, api.style() is still in the docs and works, but is deprecated in the package. <!-- This issue is generated by echarts-issue-helper. DO NOT REMOVE --> <!-- This issue is in English. DO NOT REMOVE --> -- This is an automated message from the Apache Git Service. To respond to the message, please log on to GitHub and use the URL above to go to the specific comment. To unsubscribe, e-mail: [email protected] For queries about this service, please contact Infrastructure at: [email protected] --------------------------------------------------------------------- To unsubscribe, e-mail: [email protected] For additional commands, e-mail: [email protected]