yousefwalid commented on issue #16056:
URL: https://github.com/apache/echarts/issues/16056#issuecomment-966880970
@pissang I don't think this is relevant to my request
Let me clarify the problem here a bit.
--
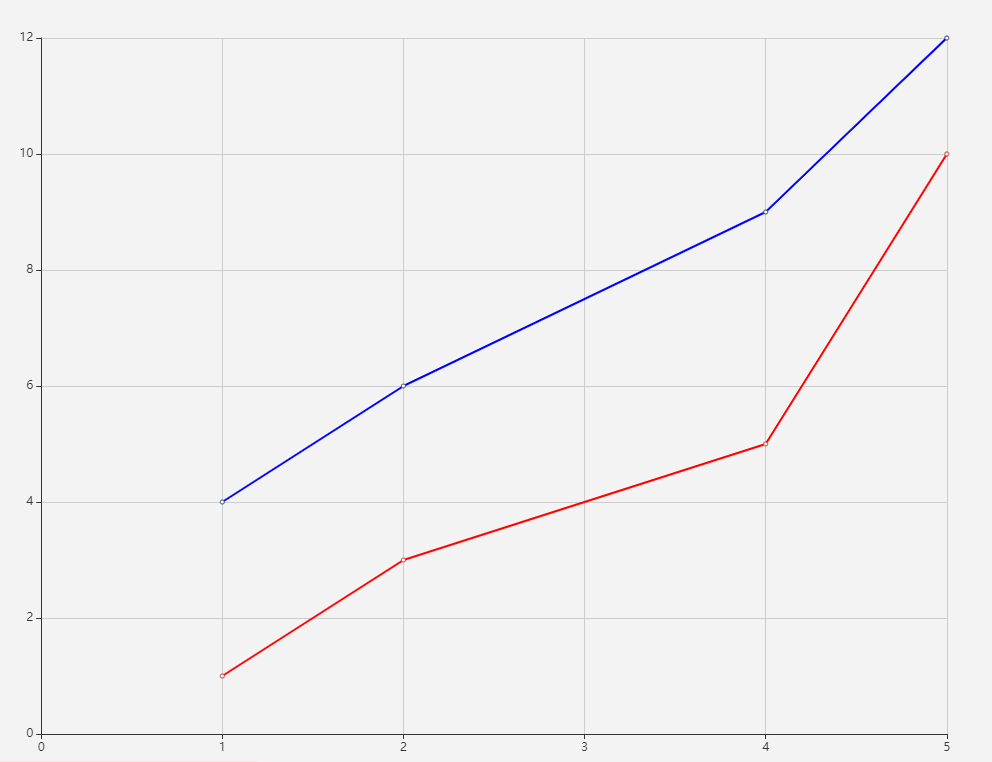
Assume we have this chart
```js
option = {
xAxis: {
type: 'value',
},
yAxis: {
type: 'value'
},
series: [
{
data: [[1,1], [2,3], [4,5], [5,10]],
type: 'line',
lineStyle: {
color: 'red'
}
},
{
data: [[1,4], [2,6], [4,9], [5,12]],
type: 'line',
lineStyle: {
color: 'blue'
}
}
]
};
```
This produces this output, where there is one series with red line color and
another series with blue line color
The behavior I want to produce is allowing to change the color of each
section of the line, so for instance, something like this:
```js
option = {
xAxis: {
type: 'value',
},
yAxis: {
type: 'value'
},
series: [
{
data: [
{
value: [1,1],
lineStyle: {
color: 'green'
}
},
{
value: [2,3],
lineStyle: {
color: 'red'
}
},
{
value: [4,5],
lineStyle: {
color: 'green'
}
},
{
value: [5,10]
}
],
type: 'line'
},
{
data: [[1,4], [2,6], [4,9], [5,12]],
type: 'line',
lineStyle: {
color: 'blue'
}
}
]
};
```
would produce the following chart
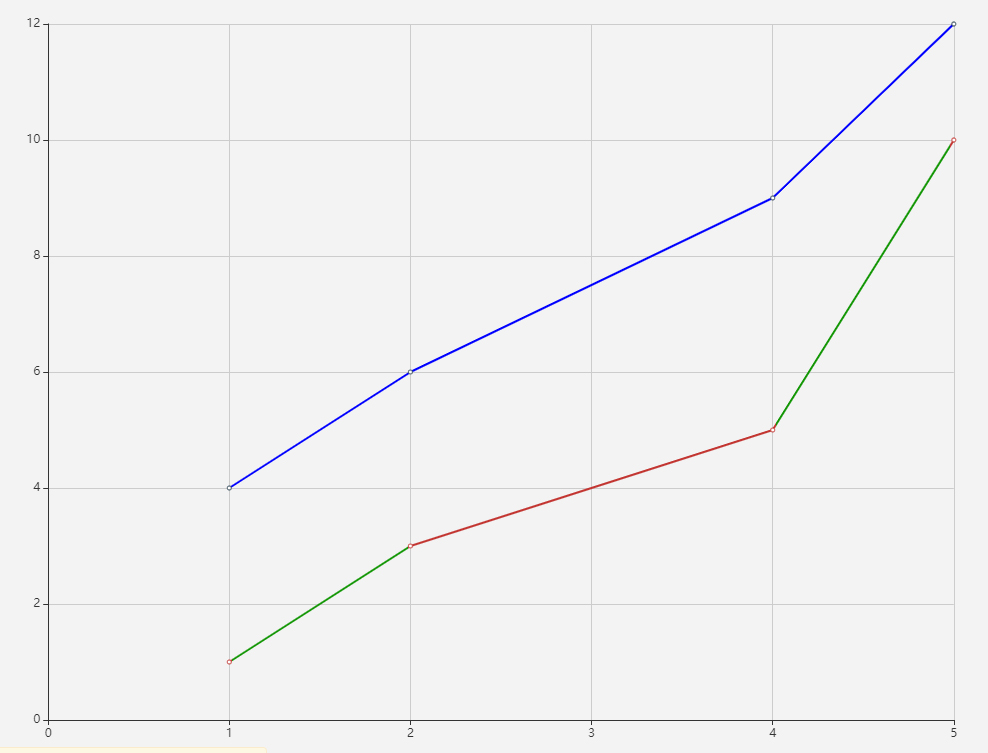
where one line has first section in green, second in red, third in green,
but the other line is unaffected.
--
This is an automated message from the Apache Git Service.
To respond to the message, please log on to GitHub and use the
URL above to go to the specific comment.
To unsubscribe, e-mail: commits-unsubscr...@echarts.apache.org
For queries about this service, please contact Infrastructure at:
us...@infra.apache.org
---------------------------------------------------------------------
To unsubscribe, e-mail: commits-unsubscr...@echarts.apache.org
For additional commands, e-mail: commits-h...@echarts.apache.org