raphael10-collab opened a new issue #16375:
URL: https://github.com/apache/echarts/issues/16375
### Version
5.2.2
### Link to Minimal Reproduction
_No response_
### Steps to Reproduce
With:
options= {
tooltip: {
trigger: 'item'
},
legend: {
orient: 'vertical',
left: 'left'
},
series: [
{
type: 'pie',
radius: '100%',
//data: psSeriesData,
//data: seriesData,
data: [
{ value: 820, name: 'Mon' },
{ value: 932, name: 'Tue' },
{ value: 901, name: 'Wed' },
{ value: 934, name: 'Thu' },
{ value: 1290, name: 'Fri' },
{ value: 1330, name: 'Sat' },
{ vaue: 1320, name: 'Sun' }
],
emphasis: {
itemStyle: {
shadowBlur: 10,
shadowOffsetX: 0,
shadowColor: 'rgba(0, 0, 0, 0.5)'
}
}
}
]
};
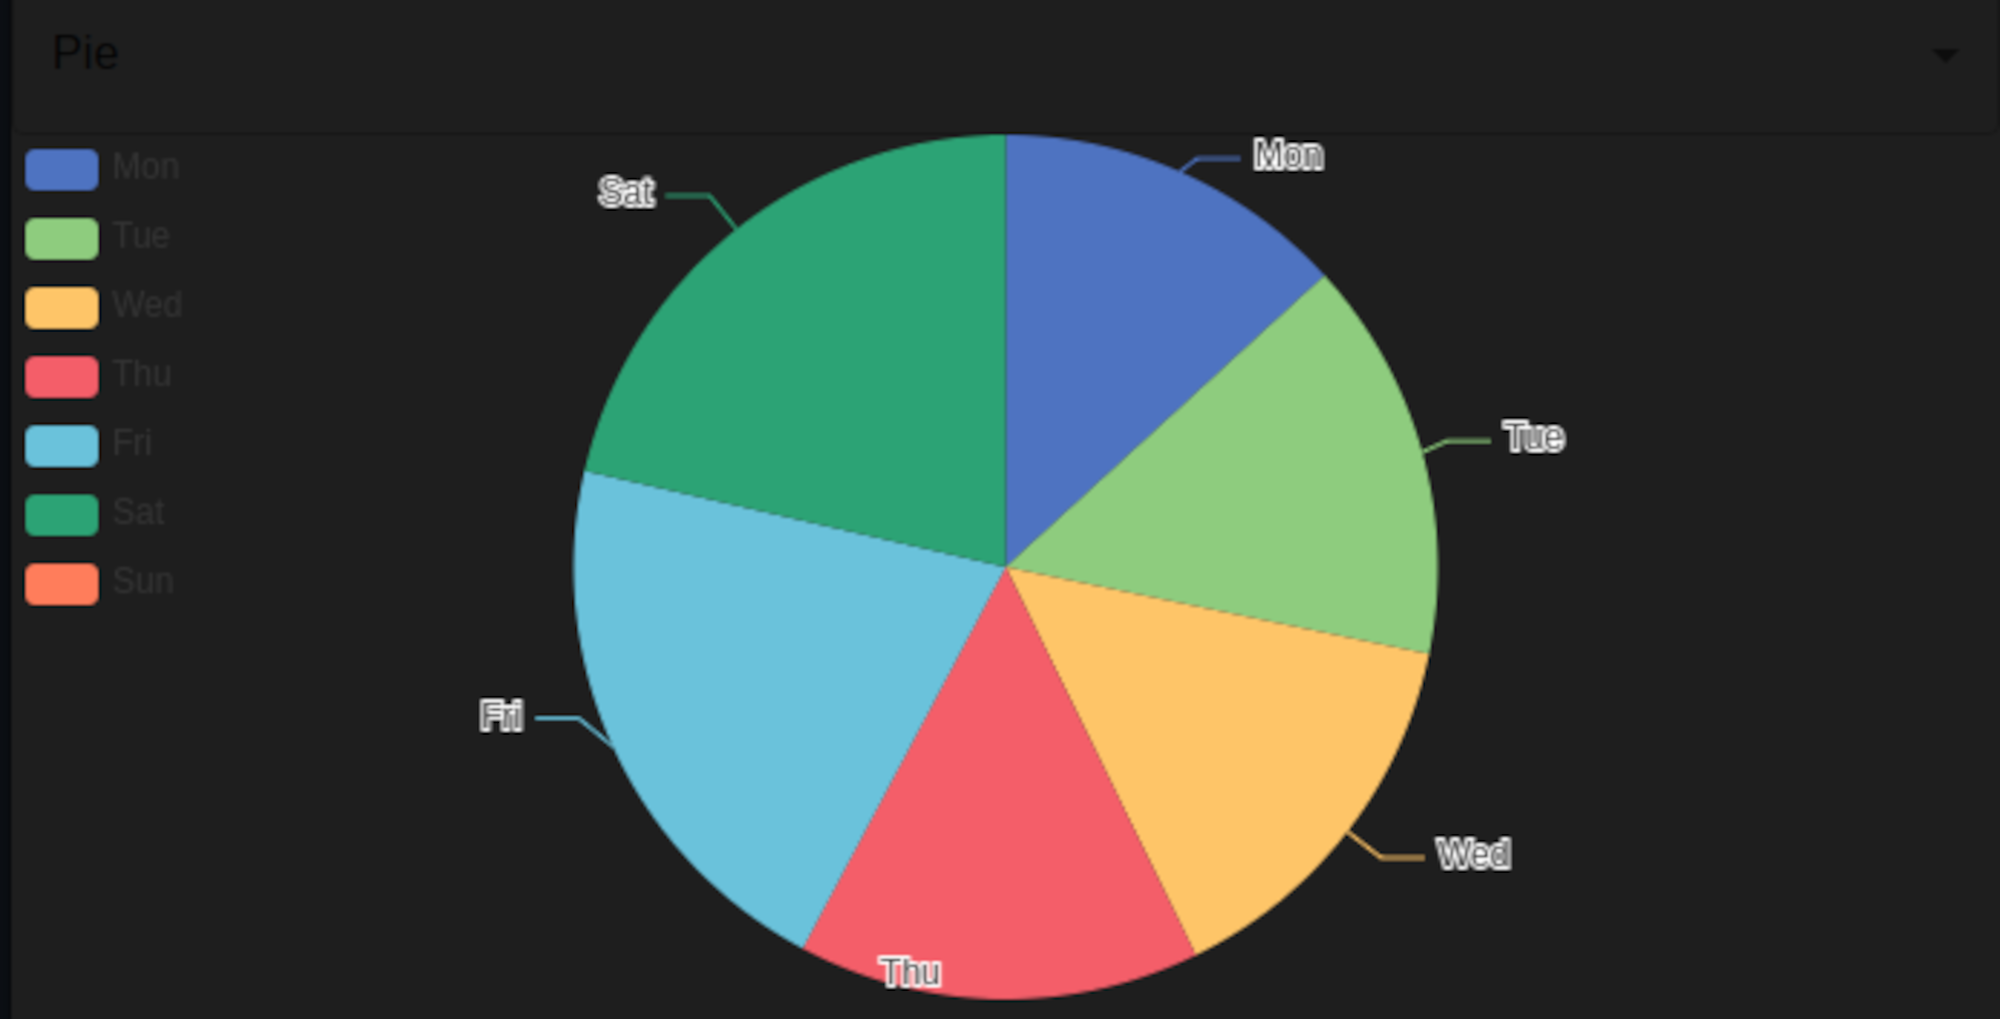
I get the correct `pie chart` :
But when I "build-up" the `data` from two separated arrays, a `data-points`
array and a `x-axis category` array :
export default function EchartDeploy (props: Props) {
const { chartType, seriesData, xAxisType, xAxisData } = props
const psSeriesDataBuild = (sd: number[], xaxisd: string[]):
psDataType[] => {
let psDataArray : psDataType[] = []
for(let i = 0; i < sd.length; i++) {
const psDataPair: psDataType = {
dataPoint: sd[i],
name: xaxisd[i]
}
psDataArray.push(psDataPair)
}
return psDataArray
}
const psSeriesDataPrint = (psSeriesD: psDataType[]) => {
for (let i = 0; i < psSeriesD.length; i++) {
console.log("{ value: " + psSeriesD[i].dataPoint + ", name: " +
psSeriesD[i].name + " }")
}
}
options= {
tooltip: {
trigger: 'item'
},
legend: {
orient: 'vertical',
left: 'left'
},
series: [
{
type: 'pie',
radius: '100%',
data: psSeriesData,
//data: seriesData,
//data: [
//{ value: 820, name: 'Mon' },
//{ value: 932, name: 'Tue' },
//{ value: 901, name: 'Wed' },
//{ value: 934, name: 'Thu' },
//{ value: 1290, name: 'Fri' },
//{ value: 1330, name: 'Sat' },
//{ vaue: 1320, name: 'Sun' }
//],
emphasis: {
itemStyle: {
shadowBlur: 10,
shadowOffsetX: 0,
shadowColor: 'rgba(0, 0, 0, 0.5)'
}
}
}
]
};
### Current Behavior
With:
options= {
tooltip: {
trigger: 'item'
},
legend: {
orient: 'vertical',
left: 'left'
},
series: [
{
type: 'pie',
radius: '100%',
//data: psSeriesData,
//data: seriesData,
data: [
{ value: 820, name: 'Mon' },
{ value: 932, name: 'Tue' },
{ value: 901, name: 'Wed' },
{ value: 934, name: 'Thu' },
{ value: 1290, name: 'Fri' },
{ value: 1330, name: 'Sat' },
{ vaue: 1320, name: 'Sun' }
],
emphasis: {
itemStyle: {
shadowBlur: 10,
shadowOffsetX: 0,
shadowColor: 'rgba(0, 0, 0, 0.5)'
}
}
}
]
};
I get the correct `pie chart` :

But when I "build-up" the `data` from two separated arrays, a `data-points`
array and a `x-axis category` array :
export default function EchartDeploy (props: Props) {
const { chartType, seriesData, xAxisType, xAxisData } = props
const psSeriesDataBuild = (sd: number[], xaxisd: string[]):
psDataType[] => {
let psDataArray : psDataType[] = []
for(let i = 0; i < sd.length; i++) {
const psDataPair: psDataType = {
dataPoint: sd[i],
name: xaxisd[i]
}
psDataArray.push(psDataPair)
}
return psDataArray
}
const psSeriesDataPrint = (psSeriesD: psDataType[]) => {
for (let i = 0; i < psSeriesD.length; i++) {
console.log("{ value: " + psSeriesD[i].dataPoint + ", name: " +
psSeriesD[i].name + " }")
}
}
options= {
tooltip: {
trigger: 'item'
},
legend: {
orient: 'vertical',
left: 'left'
},
series: [
{
type: 'pie',
radius: '100%',
data: psSeriesData,
//data: seriesData,
//data: [
//{ value: 820, name: 'Mon' },
//{ value: 932, name: 'Tue' },
//{ value: 901, name: 'Wed' },
//{ value: 934, name: 'Thu' },
//{ value: 1290, name: 'Fri' },
//{ value: 1330, name: 'Sat' },
//{ vaue: 1320, name: 'Sun' }
//],
emphasis: {
itemStyle: {
shadowBlur: 10,
shadowOffsetX: 0,
shadowColor: 'rgba(0, 0, 0, 0.5)'
}
}
}
]
};
I end up with only the `legend` visible:
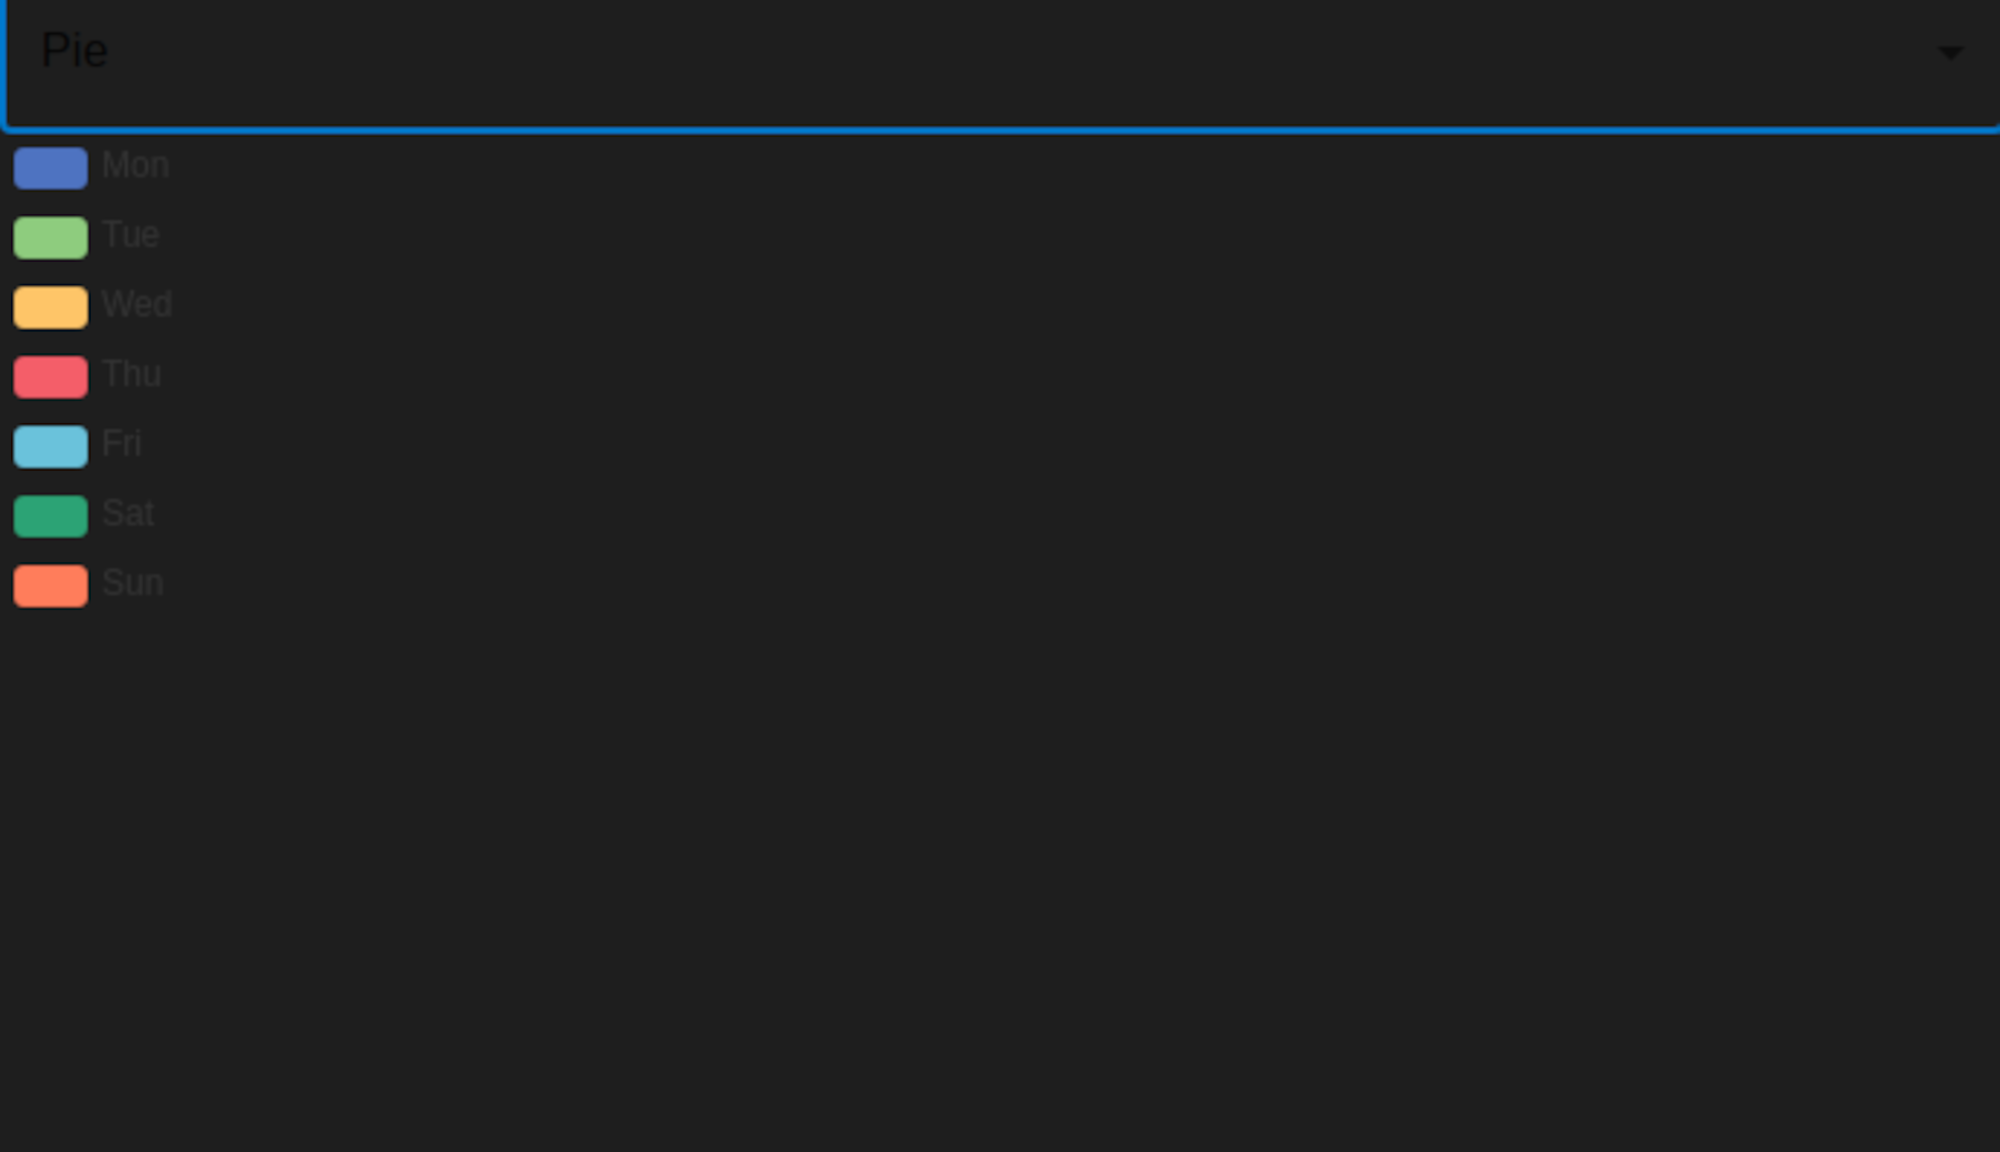
Despite the fact that the `data object array` seems correctly built:

What am I doing wrongly? How to make the correct `pie chart` visible using
the `data array` built up by two distinct `data point` array and `x axis data`
array?
### Expected Behavior
Expected Output: the correct `Pie Chart`
### Environment
```markdown
- OS: Ubuntu 20.04 Desktop
- Browser: Chromium : Electron: version 13
- echart: 5.2.2
- node: v 16.13.0
- Framework: React : version 17.0.2
```
### Any additional comments?
_No response_
--
This is an automated message from the Apache Git Service.
To respond to the message, please log on to GitHub and use the
URL above to go to the specific comment.
To unsubscribe, e-mail: [email protected]
For queries about this service, please contact Infrastructure at:
[email protected]
---------------------------------------------------------------------
To unsubscribe, e-mail: [email protected]
For additional commands, e-mail: [email protected]