fuchunhui commented on issue #16965:
URL: https://github.com/apache/echarts/issues/16965#issuecomment-1128785474
ECharts 目前不支持你说的这种场景(自动的适应背景高度)。
介于已知信息较少,不确定你目前的实现方案,希望能够补充最小粒度的 Demo,便于问题讨论。
疑问点:Y 轴高度是否固定,是否可以无限往下。【重点】
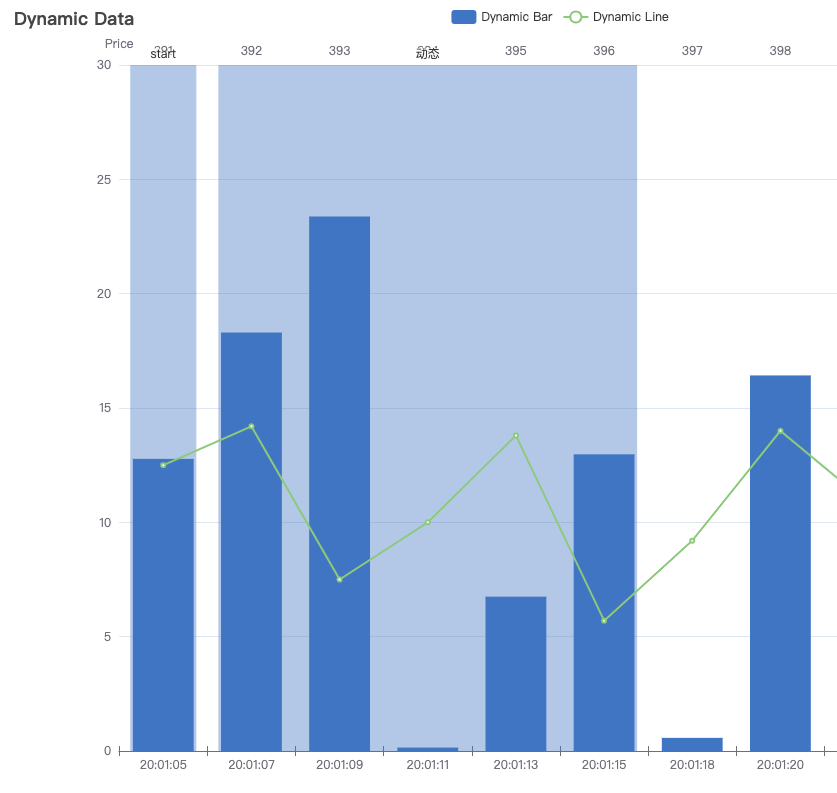
猜想下,可能的设计思路,使用 bar.markArea 绘制背景,第一个背景固定,第二个通过 柱的个数 * (每个柱的宽度 -
柱之间的空隙)计算求得动态后的值。
类似如:
```javascript
markArea: {
data: [
[
{
name: 'start',
x: '11%',
},
{
x: '17%'
}
],
[
{
name: '动态',
x: '19%'
},
{
x: '57%' // 此值,动态变化,计算求得
}
]
]
}
```

上图中,每个柱子width: 6%,gap: 2%,即刻度宽8%。
[上述截图 Demo](https://codesandbox.io/s/4h04pr)
--
This is an automated message from the Apache Git Service.
To respond to the message, please log on to GitHub and use the
URL above to go to the specific comment.
To unsubscribe, e-mail: commits-unsubscr...@echarts.apache.org
For queries about this service, please contact Infrastructure at:
us...@infra.apache.org
---------------------------------------------------------------------
To unsubscribe, e-mail: commits-unsubscr...@echarts.apache.org
For additional commands, e-mail: commits-h...@echarts.apache.org
