lwillowl opened a new issue, #18085:
URL: https://github.com/apache/echarts/issues/18085
### Version
5.3.0(actually all 5.x versions have this bug)
### Link to Minimal Reproduction
_No response_
### Steps to Reproduce
copy this code to create a gantt chart, when version is 4.+ the
xAxis.axisLine can take effect, while it does not work in version 5.+, with the
same code.
```javascript
option = {
"legend": {
"show": true,
"pageIconSize": 12,
"padding": 5,
"itemGap": 10,
"itemWidth": 20,
"itemHeight": 20,
"textStyle": {
"padding": 1,
"color": "#999999"
},
"right": 50,
"pageIconColor": "#2f4554",
"pageIconInactiveColor": "#aaa",
"type": "scroll",
"data": []
},
"grid": {
"left": 60,
"right": 50,
"bottom": 50,
"top": 50,
"containLabel": false
},
"xAxis": {
"show": true,
"name": "",
"nameTextStyle": {
"color": "#999999"
},
"type": "time",
"boundryGap": false,
"axisTick": {
"show": false
},
"axisLine": {
"lineStyle": {
"color": "#C089D9",
"width": 3,
"type": "dashed"
},
"onZero": false,
"symbol": [
"circle",
"rect"
],
"symbolSize": [
1,
2
],
"symbolOffset": [
2,
3
]
},
"splitLine": {
"show": true,
"lineStyle": {
"width": 1,
"color": "#E9E9E9",
"type": "solid"
}
},
"axisLabel": {
"textStyle": {
"color": "#999999"
},
"rotate": 0,
"hideOverlap": true,
"showMaxLabel": true,
"formatter": {
"year": "{MM}-{dd}\n{yyyy}",
"month": "{MM}-{dd}\n{yyyy}",
"day": "{MM}-{dd}\n{yyyy}",
"hour": "{HH}:{mm}",
"minute": "{HH}:{mm}",
"second": "{HH}:{mm}:{ss}",
"millisecond": "{MM}-{dd}\n{yyyy}",
"none": "{MM}-{dd}\n{yyyy}"
}
},
"position": "bottom",
"inverse": false,
},
"yAxis": {
"show": true,
"nameGap": 20,
"axisLine": {
"show": true,
"lineStyle": {
"color": "#D9E0E6"
}
},
"nameTextStyle": {
"color": "#999999"
},
"type": "category",
"inverse": true,
"axisTick": {
"show": false
},
"axisLabel": {
"interval": 0,
"textStyle": {
"color": "#999999"
}
},
"splitLine": {
"show": true,
"lineStyle": {
"width": 1,
"color": "#E9E9E9",
"type": "solid"
}
},
"data": [
"task 1",
"task 2",
"task 3",
"task 4",
"task 5",
"task 6",
"task 7",
"task 8",
"task 9"
],
"name": "",
"position": "left",
},
"tooltip": {
"extraCssText": "z-index: 10000;",
"confine": true,
"borderWidth": 0,
"position": "top",
"trigger": "axis",
"axisPointer": {
"type": "none"
},
"backgroundColor": "rgba(34, 34, 34, 0.7)"
},
"animation": false,
"series": [
{
"name": "Placeholder",
"type": "custom",
"encode": {
"x": [
1,
2
],
"y": [
0
]
},
"itemStyle": {
"color": "#3ca0ed"
},
"data": [
[
"task 1",
"2020-11-30T16:00:00.000Z",
"2020-12-01T16:00:00.000Z"
],
[
"task 2",
"2020-12-01T16:00:00.000Z",
"2020-12-02T16:00:00.000Z"
],
[
"task 3",
"2020-12-02T16:00:00.000Z",
"2020-12-03T16:00:00.000Z"
],
[
"task 4",
"2020-12-03T16:00:00.000Z",
"2020-12-04T16:00:00.000Z"
],
[
"task 5",
"2020-12-04T16:00:00.000Z",
"2020-12-05T16:00:00.000Z"
],
[
"task 6",
"2020-12-05T16:00:00.000Z",
"2020-12-06T16:00:00.000Z"
],
[
"task 7",
"2020-12-06T16:00:00.000Z",
"2020-12-07T16:00:00.000Z"
],
[
"task 8",
"2020-12-07T16:00:00.000Z",
"2020-12-08T16:00:00.000Z"
],
[
"task 9",
"2020-12-08T16:00:00.000Z",
"2020-12-09T16:00:00.000Z"
]
]
}
],
};
```
### Current Behavior
My chart needs to display xAxis.axisLine configuration when xAxis.type =
'time', and yAxis.type = 'category'.
in echart4.+ it can work, but in v5.+ it does not work.
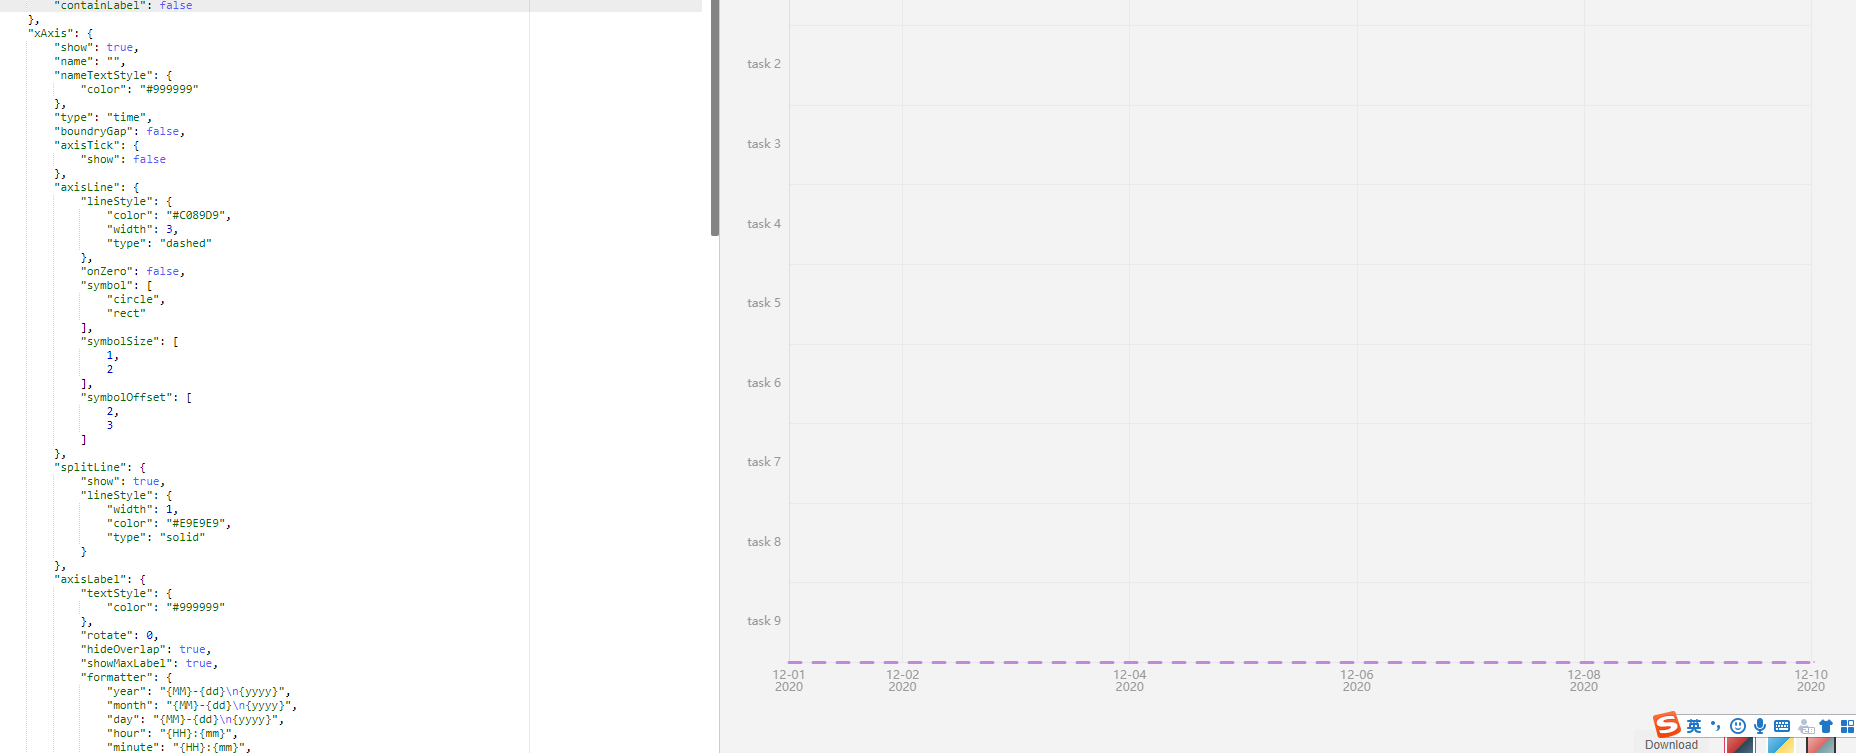
v4.+
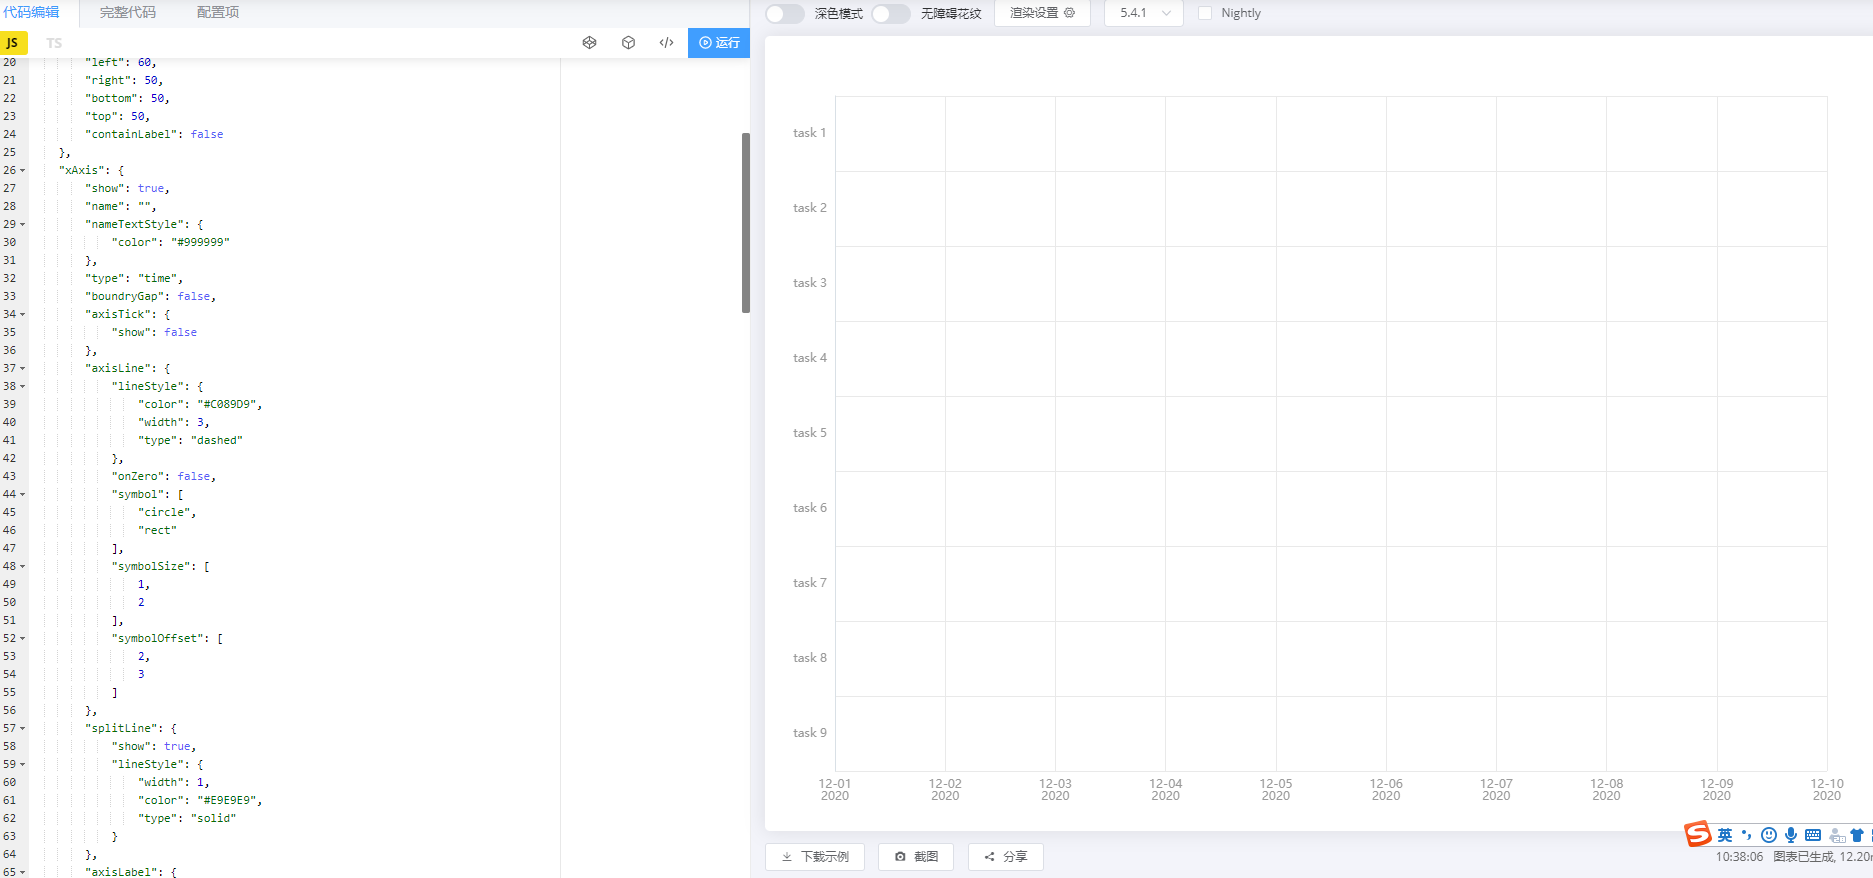
v5.+
### Expected Behavior
I need the same code has the same effect in v4.+ and v5.+
### Environment
```markdown
- OS: windows10
- Browser:Chrome 99.0.4844.74
- Framework:Vue@2
```
### Any additional comments?
_No response_
--
This is an automated message from the Apache Git Service.
To respond to the message, please log on to GitHub and use the
URL above to go to the specific comment.
To unsubscribe, e-mail: commits-unsubscr...@echarts.apache.org.apache.org
For queries about this service, please contact Infrastructure at:
us...@infra.apache.org
---------------------------------------------------------------------
To unsubscribe, e-mail: commits-unsubscr...@echarts.apache.org
For additional commands, e-mail: commits-h...@echarts.apache.org