This is an automated email from the ASF dual-hosted git repository.

haonan pushed a commit to branch rel/0.13
in repository https://gitbox.apache.org/repos/asf/iotdb.git
The following commit(s) were added to refs/heads/rel/0.13 by this push:
new a83c3bb0f6 [To rel/0.13][IOTDB-4345] Update Metric Related Doc (#7292)
a83c3bb0f6 is described below
commit a83c3bb0f6ee20f59963a4ee29ddf819a6c02aca
Author: ZhangHongYin <[email protected]>
AuthorDate: Tue Sep 13 14:12:06 2022 +0800
[To rel/0.13][IOTDB-4345] Update Metric Related Doc (#7292)
---
.../{Monitor-and-Log-Tools.md => Log-Tool.md} | 55 +---------
docs/UserGuide/Maintenance-Tools/Metric-Tool.md | 99 ++++++++++++-----
.../{Monitor-and-Log-Tools.md => Log-Tool.md} | 55 +---------
docs/zh/UserGuide/Maintenance-Tools/Metric-Tool.md | 118 ++++++++++++++-------
site/src/main/.vuepress/config.js | 8 +-
5 files changed, 160 insertions(+), 175 deletions(-)
diff --git a/docs/UserGuide/Maintenance-Tools/Monitor-and-Log-Tools.md
b/docs/UserGuide/Maintenance-Tools/Log-Tool.md
similarity index 61%
rename from docs/UserGuide/Maintenance-Tools/Monitor-and-Log-Tools.md
rename to docs/UserGuide/Maintenance-Tools/Log-Tool.md
index 18e2d2c175..5395274642 100644
--- a/docs/UserGuide/Maintenance-Tools/Monitor-and-Log-Tools.md
+++ b/docs/UserGuide/Maintenance-Tools/Log-Tool.md
@@ -19,57 +19,6 @@
-->
-## Monitor and Log Tools
-
-### System Monitor
-
-Currently, IoTDB provides users Java's JConsole tool to monitor system status
or use IoTDB's open API to check data status.
-
-#### System Status Monitoring
-
-After starting JConsole tool and connecting to IoTDB server, a basic look at
IoTDB system status(CPU Occupation, in-memory information, etc.) is provided.
See [official
documentation](https://docs.oracle.com/javase/7/docs/technotes/guides/management/jconsole.html)
for more information.
-
-#### JMX MBean Monitoring
-By using JConsole tool and connecting with JMX you are provided with some
system statistics and parameters.
-
-This section describes how to use the JConsole ```Mbean```tab of jconsole to
monitor some system configurations of IoTDB, the statistics of writing, and so
on. After connecting to JMX, you can find the "MBean" of
"org.apache.iotdb.service", as shown in the figure below.
-
-<img style="width:100%; max-width:800px; max-height:600px; margin-left:auto;
margin-right:auto; display:block;"
src="https://user-images.githubusercontent.com/46039728/149951720-707f1ee8-32ee-4fde-9252-048caebd232e.png";>
<br>
-
-### System Metric Framework
-[Metric Tool](Metric-Tool.md)
-
-### Performance Monitor
-
-#### Introduction
-
-To grasp the performance of iotdb, this module is added to count the
time-consumption of each operation. This module can compute the statistics of
the avg time-consuming of each operation and the proportion of each operation
whose time consumption falls into a time range. The output is in
log_measure.log file. An output example is below.
-
-<img style="width:100%; max-width:800px; max-height:600px; margin-left:auto;
margin-right:auto; display:block;"
src="https://user-images.githubusercontent.com/13203019/60937461-14296f80-a303-11e9-9602-a7bed624bfb3.png";>
-
-#### Configuration parameter
-
-location:conf/iotdb-engine.properties
-
-<center>
-
-**Table -parameter and description**
-
-| Parameter | Default Value | Description
|
-| :------------------------ | :------------ |
:---------------------------------------- |
-| enable\_performance\_stat | false | Is stat performance of
sub-module enable. |
-</center>
-
-### Cache Hit Ratio Statistics
-
-#### Overview
-
-To improve query performance, IOTDB caches ChunkMetaData and TsFileMetaData.
Users can view the cache hit ratio through debug level log and MXBean, and
adjust the memory occupied by the cache according to the cache hit ratio and
system memory. The method of using MXBean to view cache hit ratio is as follows:
-1. Connect to jconsole with port 31999 and select 'MBean' in the menu item
above.
-2. Expand the sidebar and select 'org.apache.iotdb.db.service'. You will get
the results shown in the following figure:
-
-<img style="width:100%; max-width:800px; max-height:600px; margin-left:auto;
margin-right:auto; display:block;"
src="https://user-images.githubusercontent.com/19167280/112426760-73e3da80-8d73-11eb-9a8f-9232d1f2033b.png";>
-
## System log
IoTDB allows users to configure IoTDB system logs (such as log output level)
by modifying the log configuration file. The default location of the system log
configuration file is in \$IOTDB_HOME/conf folder.
@@ -113,3 +62,7 @@ This method is to obtain the current log level of the
specified Logger. This met
This method is to obtain the log level of the specified Logger. This method
accepts a String type parameter named p1, which is the name of the specified
Logger. This method returns the log level of the specified Logger.
It should be noted that the difference between this method and the
`getLoggerEffectiveLevel` method is that the method returns the log level that
the specified Logger is set in the configuration file. If the user does not set
the log level for the Logger, then return empty. According to Logger's
log-level inheritance mechanism, a Logger's level is not explicitly set, it
will inherit the log level settings from its nearest ancestor. At this point,
calling the `getLoggerEffectiveLevel` met [...]
+
+* setLoggerLevel
+
+This method sets the log level of the specified Logger. The method accepts a
parameter of type String named p1 and a parameter of type String named p2,
specifying the name of the logger and the log level of the target, respectively.
\ No newline at end of file
diff --git a/docs/UserGuide/Maintenance-Tools/Metric-Tool.md
b/docs/UserGuide/Maintenance-Tools/Metric-Tool.md
index ba67f58320..94f5ffd597 100644
--- a/docs/UserGuide/Maintenance-Tools/Metric-Tool.md
+++ b/docs/UserGuide/Maintenance-Tools/Metric-Tool.md
@@ -19,11 +19,13 @@
-->
-## 1. What is metrics?
+Currently, users can use various methods to monitor the running IoTDB process,
including using Java's Jconsole tool to monitor the system status of the
running IoTDB process, using the interface developed by IoTDB for users to view
data statistics, and using the monitor framework to monitor the system status
of the running IoTDB process.
+
+# 1. Monitor Framework
Along with IoTDB running, some metrics reflecting current system's status will
be collected continuously, which will provide some useful information helping
us resolving system problems and detecting potential system risks.
-## 2. When to use metrics?
+## 1.1. When to use monitor framework?
Belows are some typical application scenarios
@@ -46,15 +48,15 @@ Belows are some typical application scenarios
We could use the count of error logs、the alive status of nodes in cluster,
etc, to determine whether the system is running abnormally.
-## 3. Who will use metrics?
+## 1.2. Who will use monitor framework?
Any person cares about the system's status, including but not limited to RD,
QA, SRE, DBA, can use the metrics to work more efficiently.
-## 4. What metrics does IoTDB have?
+## 1.3. What metrics does IoTDB have?
For now, we have provided some metrics for several core modules of IoTDB, and
more metrics will be added or updated along with the development of new
features and optimization or refactoring of architecture.
-### 4.1. Key Concept
+### 1.3.1. Key Concept
Before step into next, we'd better stop to have a look into some key concepts
about metrics.
@@ -68,15 +70,15 @@ Every metric data has two properties
Each metric could have 0 or several sub classes (Tag), for the same example,
the ```logback_events_total``` metric has a sub class named ```level```, which
means ```the total count of log events at the specific level```
-### 4.2. Data Format
+### 1.3.2. Data Format
IoTDB provides metrics data both in JMX and Prometheus format. For JMX, you
can get these metrics via ```org.apache.iotdb.metrics```.
Next, we will choose Prometheus format data as samples to describe each kind
of metric.
-### 4.3. IoTDB Metrics
+### 1.3.3. IoTDB Metrics
-#### 4.3.1. API
+#### 1.3.3.1. API
| Metric | Tag | level | Description
| Sample |
| ------------------- | ------------------------ | --------- |
---------------------------------------- |
-------------------------------------------- |
@@ -86,7 +88,7 @@ Next, we will choose Prometheus format data as samples to
describe each kind of
| quantity_total | name="pointsIn" | important | The total
points inserted into IoTDB | quantity_total{name="pointsIn",} 1.0 |
| thrift_connections | name="{{thriftService}}" | core | current number
of thrift connections | thrift_connections{name="RPC",} 1.0 |
-#### 4.3.2. Task
+#### 1.3.3.2. Task
| Metric | Tag
| level | Description
| Sample
|
| ----------------------- |
---------------------------------------------------------------------------- |
--------- | -------------------------------------------------------- |
---------------------------------------------------------------------------------------
|
| queue |
name="compaction_inner/compaction_cross/flush",<br/>status="running/waiting" |
important | The count of current tasks in running and waiting status |
queue{name="flush",status="waiting",}
0.0<br/>queue{name="flush",status="running",} 0.0 |
@@ -96,25 +98,25 @@ Next, we will choose Prometheus format data as samples to
describe each kind of
| data_written | name="compaction", <br
/>type="aligned/not-aligned/total" | important | The size of
data written in compaction |
data_written{name="compaction",type="total",} 10240
|
| data_read | name="compaction"
| important | The size of data read in compaction
| data_read={name="compaction",} 10240
|
-#### 4.3.3. Memory Usage
+#### 1.3.3.3. Memory Usage
| Metric | Tag | level | Description
| Sample
|
| ------ | --------------------------------------- | --------- |
--------------------------------------------------------------------- |
--------------------------------- |
| mem | name="chunkMetaData/storageGroup/mtree" | important | Current
memory size of chunkMetaData/storageGroup/mtree data in bytes |
mem{name="chunkMetaData",} 2050.0 |
-#### 4.3.4. Cache Hit Ratio
+#### 1.3.3.4. Cache
| Metric | Tag | level |
Description |
Sample |
| --------- | --------------------------------------- | --------- |
----------------------------------------------------------------------------- |
--------------------------- |
| cache_hit | name="chunk/timeSeriesMeta/bloomFilter" | important | Cache hit
ratio of chunk/timeSeriesMeta and prevention ratio of bloom filter |
cache_hit{name="chunk",} 80 |
-#### 4.3.5. Business Data
+#### 1.3.3.5. Business Data
| Metric | Tag
| level | Description |
Sample |
| -------- |
------------------------------------------------------------------- | ---------
| ------------------------------------------------------------- |
--------------------------------------------- |
| quantity | name="timeSeries/storageGroup/device",
type="total/normal/template" | important | The current count of
timeSeries/storageGroup/devices in IoTDB |
quantity{name="timeSeries",type="normal"} 1.0 |
-#### 4.3.6. Cluster
+#### 1.3.3.6. Cluster
| Metric | Tag | level |
Description
| Sample
|
| ------------------------- | ------------------------------- | --------- |
--------------------------------------------------------------------------------------------
| ----------------------------------------------------------------------------
|
@@ -123,12 +125,12 @@ Next, we will choose Prometheus format data as samples to
describe each kind of
| cluster_node_status | name="{{ip}}" | important |
The current node status, 1=online 2=offline
| cluster_node_status{name="127.0.0.1",} 1.0
|
| cluster_elect_total | name="{{ip}}",status="fail/win" | important |
The count and result (won or failed) of elections the node participated in.
| cluster_elect_total{name="127.0.0.1",status="win",} 1.0
|
-### 4.4. IoTDB PreDefined Metrics Set
+### 1.3.4. IoTDB PreDefined Metrics Set
Users can modify the value of `predefinedMetrics` in the `iotdb-metric.yml`
file to enable the predefined set of metrics,now support `JVM`, `LOGBACK`,
`FILE`, `PROCESS`, `SYSYTEM`.
-#### 4.4.1. JVM
+#### 1.3.4.1. JVM
-##### 4.4.1.1. Threads
+##### 1.3.4.1.1. Threads
| Metric | Tag
| level | Description | Sample
|
| -------------------------- |
------------------------------------------------------------- | --------- |
------------------------------------ |
-------------------------------------------------- |
@@ -137,7 +139,7 @@ Users can modify the value of `predefinedMetrics` in the
`iotdb-metric.yml` file
| jvm_threads_peak_threads | None
| Important | The max count of threads till now |
jvm_threads_peak_threads 28.0 |
| jvm_threads_states_threads |
state="runnable/blocked/waiting/timed-waiting/new/terminated" | Important | The
count of threads in each status |
jvm_threads_states_threads{state="runnable",} 10.0 |
-##### 4.4.1.2. GC
+##### 1.3.4.1.2. GC
| Metric | Tag
| level | Description
| Sample
|
| ----------------------------------- |
------------------------------------------------------ | --------- |
-------------------------------------------------------------------------------------------------------
|
---------------------------------------------------------------------------------------
|
@@ -149,7 +151,7 @@ Users can modify the value of `predefinedMetrics` in the
`iotdb-metric.yml` file
| jvm_gc_live_data_size_bytes | None
| Important | Size of long-lived heap memory pool after
reclamation |
jvm_gc_live_data_size_bytes 8450088.0
|
| jvm_gc_memory_allocated_bytes_total | None
| Important | Incremented for an increase in the size of the
(young) heap memory pool after one GC to before the next |
jvm_gc_memory_allocated_bytes_total 4.2979144E7
|
-##### 4.4.1.3. Memory
+##### 1.3.4.1.3. Memory
| Metric | Tag | level
| Description
| Sample
|
| ------------------------------- | ------------------------------- |
--------- |
-------------------------------------------------------------------------------------
|
-------------------------------------------------------------------------------------------------------------------------------------------------------------
|
@@ -160,7 +162,7 @@ Users can modify the value of `predefinedMetrics` in the
`iotdb-metric.yml` file
| jvm_memory_max_bytes | {area="heap/nonheap",id="xxx",} |
Important | The maximum amount of memory in bytes that can be used for memory
management | jvm_memory_max_bytes{area="heap",id="Par Survivor
Space",} 2.44252672E8<br/>jvm_memory_max_bytes{area="nonheap",id="Compressed
Class Space",} 1.073741824E9 |
| jvm_memory_used_bytes | {area="heap/nonheap",id="xxx",} |
Important | The amount of used memory
| jvm_memory_used_bytes{area="heap",id="Par Eden Space",}
1.000128376E9<br/>jvm_memory_used_bytes{area="nonheap",id="Code Cache",}
2.9783808E7<br/> |
-##### 4.4.1.4. Classes
+##### 1.3.4.1.4. Classes
| Metric | Tag
| level | Description
| Sample
|
| ---------------------------------- |
--------------------------------------------- | --------- |
-----------------------------------------------------------------------------------------
|
-----------------------------------------------------------------------------------
|
@@ -168,20 +170,20 @@ Users can modify the value of `predefinedMetrics` in the
`iotdb-metric.yml` file
| jvm_classes_loaded_classes | None
| Important | The number of classes that are currently loaded in the Java
virtual machine | jvm_classes_loaded_classes 5975.0
|
| jvm_compilation_time_ms_total | {compiler="HotSpot 64-Bit Tiered
Compilers",} | Important | The approximate accumulated elapsed time spent in
compilation |
jvm_compilation_time_ms_total{compiler="HotSpot 64-Bit Tiered Compilers",}
107092.0 |
-#### 4.4.2. File
+#### 1.3.4.2. File
| Metric | Tag | level | Description
| Sample |
| ---------- | -------------------- | --------- |
----------------------------------------------- | --------------------------- |
| file_size | name="wal/seq/unseq" | important | The current file size of
wal/seq/unseq in bytes | file_size{name="wal",} 67.0 |
| file_count | name="wal/seq/unseq" | important | The current count of
wal/seq/unseq files | file_count{name="seq",} 1.0 |
-#### 4.4.3. Logback
+#### 1.3.4.3. Logback
| Metric | Tag | level |
Description | 示例
|
| -------------------- | -------------------------------------- | --------- |
------------------------------------------------------------- |
--------------------------------------- |
| logback_events_total | {level="trace/debug/info/warn/error",} | Important |
The count of trace/debug/info/warn/error log events till now |
logback_events_total{level="warn",} 0.0 |
-#### 4.4.4. Process
+#### 1.3.4.4. Process
| Metric | Tag | level | Description
| 示例
|
| --------------------- | -------------- | ----- |
----------------------------------------------------------------------------- |
----------------------------------------------- |
| process_cpu_load | name="cpu" | core | current process CPU Usage
(%) |
process_cpu_load{name="process",} 5.0 |
@@ -194,7 +196,7 @@ Users can modify the value of `predefinedMetrics` in the
`iotdb-metric.yml` file
| process_threads_count | name="process" | core | The current number of
threads |
process_threads_count{name="process",} 11.0 |
| process_status | name="process" | core | The process survivor
status, 1.0 means survivorship, and 0.0 means terminated |
process_status{name="process",} 1.0 |
-#### 4.4.5. System
+#### 1.3.4.5. System
| Metric | Tag | level | Description
| 示例
|
| ------------------------------ | ------------- | --------- |
----------------------------------------------------------- |
-------------------------------------------------------------- |
| sys_cpu_load | name="cpu" | core | current system
CPU Usage(%) | sys_cpu_load{name="system",}
15.0 |
@@ -207,7 +209,7 @@ Users can modify the value of `predefinedMetrics` in the
`iotdb-metric.yml` file
| sys_disk_total_space | name="disk" | core | The total disk
space |
sys_disk_total_space{name="system",} 5.10770798592E11 |
| sys_disk_free_space | name="disk" | core | The available
disk space |
sys_disk_free_space{name="system",} 3.63467845632E11 |
-### 4.5. Add custom metrics
+### 1.3.5. Add custom metrics
- If you want to add your own metrics data in IoTDB, please see the [IoTDB
Metric Framework] (https://github.com/apache/iotdb/tree/master/metrics)
document.
- Metric embedded point definition rules
- `Metric`: The name of the monitoring item. For example,
`entry_seconds_count` is the cumulative number of accesses to the interface,
and `file_size` is the total number of files.
@@ -223,11 +225,11 @@ Users can modify the value of `predefinedMetrics` in the
`iotdb-metric.yml` file
- `Normal`: General indicators of the module, used by **developers** to
facilitate **locating the module** when problems occur, such as specific key
operation situations in the merger.
- `All`: All indicators of the module, used by **module developers**, often
used when the problem is reproduced, so as to solve the problem quickly.
-## 5. How to get these metrics?
+## 1.4. How to get these metrics?
The metrics collection switch is disabled by default,you need to enable it
from ```conf/iotdb-metric.yml```, Currently, it also supports hot loading via
`load configuration` after startup.
-### 5.1. Iotdb-metric.yml
+### 1.4.1. Iotdb-metric.yml
```yaml
# whether enable the module
@@ -307,7 +309,7 @@ mem{name="mtree",} 1328.0
...
```
-### 5.2. Integrating with Prometheus and Grafana
+### 1.4.2. Integrating with Prometheus and Grafana
As above descriptions,IoTDB provides metrics data in standard Prometheus
format,so we can integrate with Prometheus and Grafana directly.
@@ -348,7 +350,7 @@ The following documents may help you have a good journey
with Prometheus and Gra
[Grafana query metrics from
Prometheus](https://prometheus.io/docs/visualization/grafana/#grafana-support-for-prometheus)
-### 5.3. Apache IoTDB Dashboard
+### 1.4.3. Apache IoTDB Dashboard
We provide the Apache IoTDB Dashboard, and the rendering shown in Grafana is
as follows:

@@ -358,4 +360,43 @@ How to get Apache IoTDB Dashboard:
1. You can obtain the json files of Dashboards corresponding to different
iotdb versions in the grafana-metrics-example folder.
2. You can visit [Grafana Dashboard official
website](https://grafana.com/grafana/dashboards/), search for `Apache IoTDB
Dashboard` and use
-When creating Grafana, you can select the json file you just downloaded to
`Import` and select the corresponding target data source for Apache IoTDB
Dashboard.
\ No newline at end of file
+When creating Grafana, you can select the json file you just downloaded to
`Import` and select the corresponding target data source for Apache IoTDB
Dashboard.
+
+# 2. System Status Monitoring
+
+After starting JConsole tool and connecting to IoTDB server, a basic look at
IoTDB system status(CPU Occupation, in-memory information, etc.) is provided.
See [official
documentation](https://docs.oracle.com/javase/7/docs/technotes/guides/management/jconsole.html)
for more information.
+
+# 3. JMX MBean Monitoring
+By using JConsole tool and connecting with JMX you are provided with some
system statistics and parameters.
+
+This section describes how to use the JConsole ```Mbean```tab of jconsole to
monitor some system configurations of IoTDB, the statistics of writing, and so
on. After connecting to JMX, you can find the "MBean" of
"org.apache.iotdb.service", as shown in the figure below.
+
+<img style="width:100%; max-width:800px; max-height:600px; margin-left:auto;
margin-right:auto; display:block;"
src="https://user-images.githubusercontent.com/46039728/149951720-707f1ee8-32ee-4fde-9252-048caebd232e.png";>
<br>
+
+# 4. Performance Monitor
+
+## 4.1. Introduction
+
+To grasp the performance of iotdb, this module is added to count the
time-consumption of each operation. This module can compute the statistics of
the avg time-consuming of each operation and the proportion of each operation
whose time consumption falls into a time range. The output is in
log_measure.log file. An output example is below.
+
+<img style="width:100%; max-width:800px; max-height:600px; margin-left:auto;
margin-right:auto; display:block;"
src="https://user-images.githubusercontent.com/13203019/60937461-14296f80-a303-11e9-9602-a7bed624bfb3.png";>
+
+## 4.2. Configuration parameter
+
+location:conf/iotdb-datanode.properties
+
+<center>
+
+**Table -parameter and description**
+
+| Parameter | Default Value | Description
|
+| :------------------------ | :------------ |
:---------------------------------------- |
+| enable\_performance\_stat | false | Is stat performance of
sub-module enable. |
+</center>
+
+# 5. Cache Hit Ratio Statistics
+To improve query performance, IOTDB caches ChunkMetaData and TsFileMetaData.
Users can view the cache hit ratio through debug level log and MXBean, and
adjust the memory occupied by the cache according to the cache hit ratio and
system memory. The method of using MXBean to view cache hit ratio is as follows:
+1. Connect to jconsole with port 31999 and select 'MBean' in the menu item
above.
+2. Expand the sidebar and select 'org.apache.iotdb.db.service'. You will get
the results shown in the following figure:
+
+<img style="width:100%; max-width:800px; max-height:600px; margin-left:auto;
margin-right:auto; display:block;"
src="https://user-images.githubusercontent.com/19167280/112426760-73e3da80-8d73-11eb-9a8f-9232d1f2033b.png";>
diff --git a/docs/zh/UserGuide/Maintenance-Tools/Monitor-and-Log-Tools.md
b/docs/zh/UserGuide/Maintenance-Tools/Log-Tool.md
similarity index 60%
rename from docs/zh/UserGuide/Maintenance-Tools/Monitor-and-Log-Tools.md
rename to docs/zh/UserGuide/Maintenance-Tools/Log-Tool.md
index 3e90ceefbd..6da846968e 100644
--- a/docs/zh/UserGuide/Maintenance-Tools/Monitor-and-Log-Tools.md
+++ b/docs/zh/UserGuide/Maintenance-Tools/Log-Tool.md
@@ -19,60 +19,11 @@
-->
-## 监控工具
-
-### 系统监控
-
-当前用户可以使用 Java 的 JConsole 工具对正在运行的 IoTDB 进程进行系统状态监控,或使用 IoTDB 为用户开放的接口查看数据统计量。
-
-#### 系统状态监控
-
-进入 Jconsole 监控页面后,首先看到的是 IoTDB 各类运行情况的概览。在这里,您可以看到堆内存信息、线程信息、类信息以及服务器的 CPU
使用情况。
-
-#### JMX MBean 监控
-
-通过使用 JConsole 工具并与 JMX 连接,您可以查看一些系统统计信息和参数。
-本节描述如何使用 JConsole 的 "Mbean" 选项卡来监视 IoTDB 的一些系统配置、写入数据统计等等。 连接到 JMX 后,您可以通过
"MBeans" 标签找到名为 "org.apache.iotdb.service" 的 "MBean",如下图所示。
-
-<img style="width:100%; max-width:800px; max-height:600px; margin-left:auto;
margin-right:auto; display:block;"
src="https://user-images.githubusercontent.com/46039728/149951720-707f1ee8-32ee-4fde-9252-048caebd232e.png";>
<br>
-
-#### 系统监控框架监控
-[监控工具](Metric-Tool.md)
-
-### 性能监控
-
-#### 介绍
-
-性能监控模块用来监控 IOTDB
每一个操作的耗时,以便用户更好的了解数据库的整体性能。此模块会统计每一种操作的平均耗时,以及耗时在一定时间区间内(1ms,4ms,16ms,64ms,256ms,1024ms,以上)的操作的比例。输出文件在
log_measure.log 中。输出样例如下:
-
-<img style="width:100%; max-width:800px; max-height:600px; margin-left:auto;
margin-right:auto; display:block;"
src="https://user-images.githubusercontent.com/13203019/60937461-14296f80-a303-11e9-9602-a7bed624bfb3.png";>
-
-#### 配置参数
-
-配置文件位置:conf/iotdb-engine.properties
-
-<center>
-
-**表 -配置参数以及描述项**
-
-| 参数 | 默认值 | 描述 |
-| :------------------------ | :----- | :------------------- |
-| enable\_performance\_stat | false | 是否开启性能监控模块 |
-</center>
-
-### cache 命中率统计
-
-#### 概述
-
-为了提高查询性能,IOTDB 对 ChunkMetaData 和 TsFileMetaData 进行了缓存。用户可以通过 debug 级别的日志以及
MXBean 两种方式来查看缓存的命中率,并根据缓存命中率以及系统内存来调节缓存所使用的内存大小。使用 MXBean 查看缓存命中率的方法为:
-1. 通过端口 31999 连接 jconsole,并在上方菜单项中选择‘MBean’.
-2. 展开侧边框并选择 'org.apache.iotdb.db.service'. 将会得到如下图所示结果:
-
-<img style="width:100%; max-width:800px; max-height:600px; margin-left:auto;
margin-right:auto; display:block;"
src="https://user-images.githubusercontent.com/19167280/112426760-73e3da80-8d73-11eb-9a8f-9232d1f2033b.png";>
-
## 系统日志
-IoTDB 支持用户通过修改日志配置文件的方式对 IoTDB
系统日志(如日志输出级别等)进行配置,系统日志配置文件默认位置在$IOTDB_HOME/conf 文件夹下,默认的日志配置文件名为
logback.xml。用户可以通过增加或更改其中的 xml 树型节点参数对系统运行日志的相关配置进行修改。详细配置说明参看本文日志文件配置说明。
+IoTDB 支持用户通过修改日志配置文件的方式对 IoTDB
系统日志(如日志输出级别等)进行配置,系统日志配置文件默认位置在$IOTDB_HOME/conf 文件夹下。
+
+默认的日志配置文件名为 logback.xml。用户可以通过增加或更改其中的 xml
树型节点参数对系统运行日志的相关配置进行修改。需要注意的是,使用日志配置文件配置系统日志并不会在修改后立即生效,而是在重启系统后生效。详细配置说明参看本文日志文件配置说明。
同时,为了方便在系统运行过程中运维人员对系统的调试,我们为系统运维人员提供了动态修改日志配置的 JMX 接口,能够在系统不重启的前提下实时对系统的 Log
模块进行配置。详细使用方法参看动态系统日志配置说明)。
diff --git a/docs/zh/UserGuide/Maintenance-Tools/Metric-Tool.md
b/docs/zh/UserGuide/Maintenance-Tools/Metric-Tool.md
index 20de20372b..fa94643c5c 100644
--- a/docs/zh/UserGuide/Maintenance-Tools/Metric-Tool.md
+++ b/docs/zh/UserGuide/Maintenance-Tools/Metric-Tool.md
@@ -18,14 +18,16 @@
under the License.
-->
-## Metric 工具
-### 1. 什么是Metrics?
-在IoTDB运行过程中,我们希望对IoTDB的状态进行观测,以便于排查系统问题或者及时发现系统潜在的风险。能**反映系统运行状态的一系列指标**就是metrics。
+当前用户可以使用多种手段对正在运行的IoTDB进程进行系统监控,包括使用 Java 的 Jconsole 工具对正在运行的 IoTDB
进程进行系统状态监控,使用 IoTDB 为用户开发的接口查看数据统计量,使用监控框架进行 IoTDB 的运行状态监控
-### 2. 什么场景下会使用到metrics?
+# 1. 监控框架
-那么什么时候会用到metrics呢?下面列举一些常见的场景。
+在IoTDB运行过程中,我们希望对IoTDB的状态进行观测,以便于排查系统问题或者及时发现系统潜在的风险。能**反映系统运行状态的一系列指标**就是系统监控指标。
+
+## 1.1. 什么场景下会使用到监控框架?
+
+那么什么时候会用到监控框架呢?下面列举一些常见的场景。
1. 系统变慢了
@@ -46,15 +48,15 @@
此时我们可能需要通过错误日志的数量、集群节点的状态等指标来判断系统是否在正常运行。
-### 3. 什么人需要使用metrics?
+## 1.2. 什么人需要使用监控框架?
所有关注系统状态的人员都可以使用,包括但不限于研发、测试、运维、DBA等等
-### 4. IoTDB都有哪些metrics?
+## 1.3. IoTDB都有哪些监控指标?
目前,IoTDB对外提供一些主要模块的metrics,并且随着新功能的开发以及系统优化或者重构,metrics也会同步添加和更新。
-#### 4.1. 名词解释
+### 1.3.1. 名词解释
在进一步了解这些指标之前,我们先来看几个名词解释:
@@ -66,15 +68,15 @@
每个指标下面可以有0到多个分类,比如logback_events_total下有一个```level```的分类,用来表示特定级别下的日志数量。
-#### 4.2. 数据格式
+### 1.3.2. 数据格式
-IoTDB对外提供JMX和Prometheus格式的监控指标,对于JMX,可以通过```org.apache.iotdb.metrics```获取metrics指标。
+IoTDB对外提供JMX和Prometheus格式的监控指标,对于JMX,可以通过```org.apache.iotdb.metrics```获取系统监控指标指标。
接下来我们以Prometheus格式为例对目前已有监控项进行说明。
-#### 4.3. IoTDB 默认指标
+### 1.3.3. IoTDB 默认指标
-##### 4.3.1. 接入层
+#### 1.3.3.1. 接入层
| Metric | Tag | level | 说明
| 示例 |
| ------------------- | ------------------------ | --------- |
---------------- | -------------------------------------------- |
@@ -84,7 +86,7 @@ IoTDB对外提供JMX和Prometheus格式的监控指标,对于JMX,可以通
| quantity_total | name="pointsIn" | important | 系统累计写入点数 |
quantity_total{name="pointsIn",} 1.0 |
| thrift_connections | name="{{thriftService}}" | core | thrift当前连接数 |
thrift_connections{name="RPC",} 1.0 |
-##### 4.3.2. Task
+#### 1.3.3.2. Task
| Metric | Tag
| level | 说明 | 示例
|
| ----------------------- |
----------------------------------------------------------------------------- |
--------- | ------------------------------- |
--------------------------------------------------------------------------------------------------
|
@@ -95,25 +97,25 @@ IoTDB对外提供JMX和Prometheus格式的监控指标,对于JMX,可以通
| data_written | name="compaction", <br
/>type="aligned/not-aligned/total" | important | 合并文件时写入量
| data_written{name="compaction",type="total",} 10240
|
| data_read | name="compaction"
| important | 合并文件时的读取量 |
data_read={name="compaction",} 10240
|
-##### 4.3.3. 内存占用
+#### 1.3.3.3. 内存占用
| Metric | Tag | level | 说明
| 示例 |
| ------ | --------------------------------------- | --------- |
-------------------------------------------------- |
--------------------------------- |
| mem | name="chunkMetaData/storageGroup/mtree" | important |
chunkMetaData/storageGroup/mtree占用的内存(byte) | mem{name="chunkMetaData",} 2050.0
|
-##### 4.3.4. 缓存命中率
+#### 1.3.3.4. 缓存
| Metric | Tag | level | 说明
| 示例 |
| --------- | --------------------------------------- | --------- |
------------------------------------------------ | --------------------------- |
| cache_hit | name="chunk/timeSeriesMeta/bloomFilter" | important |
chunk/timeSeriesMeta缓存命中率,bloomFilter拦截率 | cache_hit{name="chunk",} 80 |
-##### 4.3.5. 业务数据
+#### 1.3.3.5. 业务数据
| Metric | Tag
| level | 说明 | 示例
|
| -------- |
------------------------------------------------------------------- | ---------
| -------------------------------------------- |
--------------------------------------------- |
| quantity | name="timeSeries/storageGroup/device",
type="total/normal/template" | important |
当前时间timeSeries/storageGroup/device的数量 |
quantity{name="timeSeries",type="normal"} 1.0 |
-##### 4.3.6. 集群
+#### 1.3.3.6. 集群
| Metric | Tag | level | 说明
| 示例
|
| ------------------------- | ------------------------------- | --------- |
------------------------------------------------------------- |
---------------------------------------------------------------------------- |
@@ -122,13 +124,13 @@ IoTDB对外提供JMX和Prometheus格式的监控指标,对于JMX,可以通
| cluster_node_status | name="{{ip}}" | important |
节点状态,1=online 2=offline |
cluster_node_status{name="127.0.0.1",} 1.0 |
| cluster_elect_total | name="{{ip}}",status="fail/win" | important |
节点参与选举的次数及结果 |
cluster_elect_total{name="127.0.0.1",status="win",} 1.0 |
-#### 4.4. IoTDB 预定义指标集
+### 1.3.4. IoTDB 预定义指标集
用户可以在`iotdb-metric.yml`文件中,修改`predefinedMetrics`的值来启用预定义指标集,目前有`JVM`、`LOGBACK`、`FILE`、`PROCESS`、`SYSYTEM`这五种。
-##### 4.4.1. JVM
+#### 1.3.4.1. JVM
-###### 4.4.1.1. 线程
+##### 1.3.4.1.1. 线程
| Metric | Tag
| level | 说明 | 示例
|
| -------------------------- |
------------------------------------------------------------- | --------- |
------------------------ | -------------------------------------------------- |
@@ -137,7 +139,7 @@ IoTDB对外提供JMX和Prometheus格式的监控指标,对于JMX,可以通
| jvm_threads_peak_threads | 无
| important | 峰值线程数 | jvm_threads_peak_threads 28.0
|
| jvm_threads_states_threads |
state="runnable/blocked/waiting/timed-waiting/new/terminated" | important |
当前处于各种状态的线程数 | jvm_threads_states_threads{state="runnable",} 10.0 |
-###### 4.4.1.2. 垃圾回收
+##### 1.3.4.1.2. 垃圾回收
| Metric | Tag
| level | 说明 | 示例
|
| ----------------------------------- |
------------------------------------------------------ | --------- |
-------------------------------------------- |
---------------------------------------------------------------------------------------
|
@@ -149,7 +151,7 @@ IoTDB对外提供JMX和Prometheus格式的监控指标,对于JMX,可以通
| jvm_gc_live_data_size_bytes | 无
| important | GC后老年代内存的大小 |
jvm_gc_live_data_size_bytes 8450088.0
|
| jvm_gc_memory_allocated_bytes_total | 无
| important | 在一个GC之后到下一个GC之前年轻代增加的内存 |
jvm_gc_memory_allocated_bytes_total 4.2979144E7
|
-###### 4.4.1.3. 内存
+##### 1.3.4.1.3. 内存
| Metric | Tag | level
| 说明 | 示例
|
| ------------------------------- | ------------------------------- |
--------- | ----------------------- |
-------------------------------------------------------------------------------------------------------------------------------------------------------------
|
@@ -160,7 +162,7 @@ IoTDB对外提供JMX和Prometheus格式的监控指标,对于JMX,可以通
| jvm_memory_max_bytes | {area="heap/nonheap",id="xxx",} |
important | JVM最大内存 | jvm_memory_max_bytes{area="heap",id="Par
Survivor Space",}
2.44252672E8<br/>jvm_memory_max_bytes{area="nonheap",id="Compressed Class
Space",} 1.073741824E9 |
| jvm_memory_used_bytes | {area="heap/nonheap",id="xxx",} |
important | JVM已使用内存大小 | jvm_memory_used_bytes{area="heap",id="Par Eden
Space",} 1.000128376E9<br/>jvm_memory_used_bytes{area="nonheap",id="Code
Cache",} 2.9783808E7<br/> |
-###### 4.4.1.4. Classes
+##### 1.3.4.1.4. Classes
| Metric | Tag
| level | 说明 | 示例
|
| ---------------------------------- |
--------------------------------------------- | --------- |
---------------------- |
-----------------------------------------------------------------------------------
|
@@ -168,20 +170,20 @@ IoTDB对外提供JMX和Prometheus格式的监控指标,对于JMX,可以通
| jvm_classes_loaded_classes | 无
| important | jvm累计加载的class数量 | jvm_classes_loaded_classes 5975.0
|
| jvm_compilation_time_ms_total | {compiler="HotSpot 64-Bit Tiered
Compilers",} | important | jvm耗费在编译上的时间 |
jvm_compilation_time_ms_total{compiler="HotSpot 64-Bit Tiered Compilers",}
107092.0 |
-##### 4.4.2. 文件(File)
+#### 1.3.4.2. 文件(File)
| Metric | Tag | level | 说明
| 示例 |
| ---------- | -------------------- | --------- |
----------------------------------- | --------------------------- |
| file_size | name="wal/seq/unseq" | important | 当前时间wal/seq/unseq文件大小(byte)
| file_size{name="wal",} 67.0 |
| file_count | name="wal/seq/unseq" | important | 当前时间wal/seq/unseq文件个数
| file_count{name="seq",} 1.0 |
-##### 4.4.3. 日志(logback)
+#### 1.3.4.3. 日志(logback)
| Metric | Tag | level |
说明 | 示例 |
| -------------------- | -------------------------------------- | --------- |
--------------------------------------- |
--------------------------------------- |
| logback_events_total | {level="trace/debug/info/warn/error",} | important |
trace/debug/info/warn/error日志累计数量 | logback_events_total{level="warn",} 0.0 |
-##### 4.4.4. 进程(Process)
+##### 1.3.4.3.1. 进程(Process)
| Metric | Tag | level | 说明
| 示例 |
| --------------------- | -------------- | ----- |
---------------------------------- |
----------------------------------------------- |
| process_cpu_load | name="cpu" | core | process当前CPU占用率(%)
| process_cpu_load{name="process",} 5.0 |
@@ -194,7 +196,7 @@ IoTDB对外提供JMX和Prometheus格式的监控指标,对于JMX,可以通
| process_threads_count | name="process" | core | 当前线程数
| process_threads_count{name="process",} 11.0 |
| process_status | name="process" | core | 进程存活状态,1.0为存活,0.0为终止 |
process_status{name="process",} 1.0 |
-##### 4.4.5. 系统(System)
+#### 1.3.4.5. 系统(System)
| Metric | Tag | level | 说明
| 示例
|
| ------------------------------ | ------------- | --------- |
------------------------------------------ |
-------------------------------------------------------------- |
| sys_cpu_load | name="cpu" | core |
system当前CPU占用率(%) | sys_cpu_load{name="system",} 15.0
|
@@ -207,9 +209,9 @@ IoTDB对外提供JMX和Prometheus格式的监控指标,对于JMX,可以通
| sys_disk_total_space | name="disk" | core | 磁盘总大小
| sys_disk_total_space{name="system",} 5.10770798592E11
|
| sys_disk_free_space | name="disk" | core | 磁盘可用大小
| sys_disk_free_space{name="system",} 3.63467845632E11
|
-#### 4.5. 自定义添加埋点
+### 1.3.5. 自定义添加埋点
-- 如果想自己在IoTDB中添加更多Metrics埋点,可以参考[IoTDB Metrics
Framework](https://github.com/apache/iotdb/tree/master/metrics)使用说明
+- 如果想自己在IoTDB中添加更多系统监控指标埋点,可以参考[IoTDB Metrics
Framework](https://github.com/apache/iotdb/tree/master/metrics)使用说明
- Metric 埋点定义规则
- `Metric`:监控项的名称,比如`entry_seconds_count`为接口累计访问次数,file_size 为文件总数。
- `Tags`:Key-Value对,用来明确被监控项,可选项
@@ -224,11 +226,11 @@ IoTDB对外提供JMX和Prometheus格式的监控指标,对于JMX,可以通
- `Normal`:模块的一般指标,供**开发人员**使用,方便在出现问题时**定位模块**,比如合并中的特定关键操作情况。
- `All`:模块的全部指标,供**模块开发人员**使用,往往在复现问题的时候使用,从而快速解决问题。
-### 5. 怎样获取这些metrics?
+## 1.4. 怎样获取这些系统监控指标?
metric采集默认是关闭的,需要先到conf/iotdb-metric.yml中打开后启动server,目前也支持启动后,通过`load
configuration`热加载。
-#### 5.1. 配置文件
+### 1.4.1. 配置文件
```yaml
# 是否启动监控模块,默认为false
@@ -266,7 +268,7 @@ ioTDBReporterConfig:
pushPeriodInSecond: 15
```
-然后按照下面的操作获取metrics数据
+然后按照下面的操作获取监控指标数据
1. 打开配置文件中的metric开关
2. 其他参数使用默认配置即可
@@ -308,18 +310,18 @@ mem{name="mtree",} 1328.0
...
```
-#### 5.2. 对接Prometheus和Grafana
+### 1.4.2. 对接Prometheus和Grafana
-如上面所述,IoTDB对外透出标准Prometheus格式的metrics数据,可以直接和Prometheus以及Grafana集成。
+如上面所述,IoTDB对外暴露出标准Prometheus格式的监控指标数据,可以直接和Prometheus以及Grafana集成。
IoTDB、Prometheus、Grafana三者的关系如下图所示:
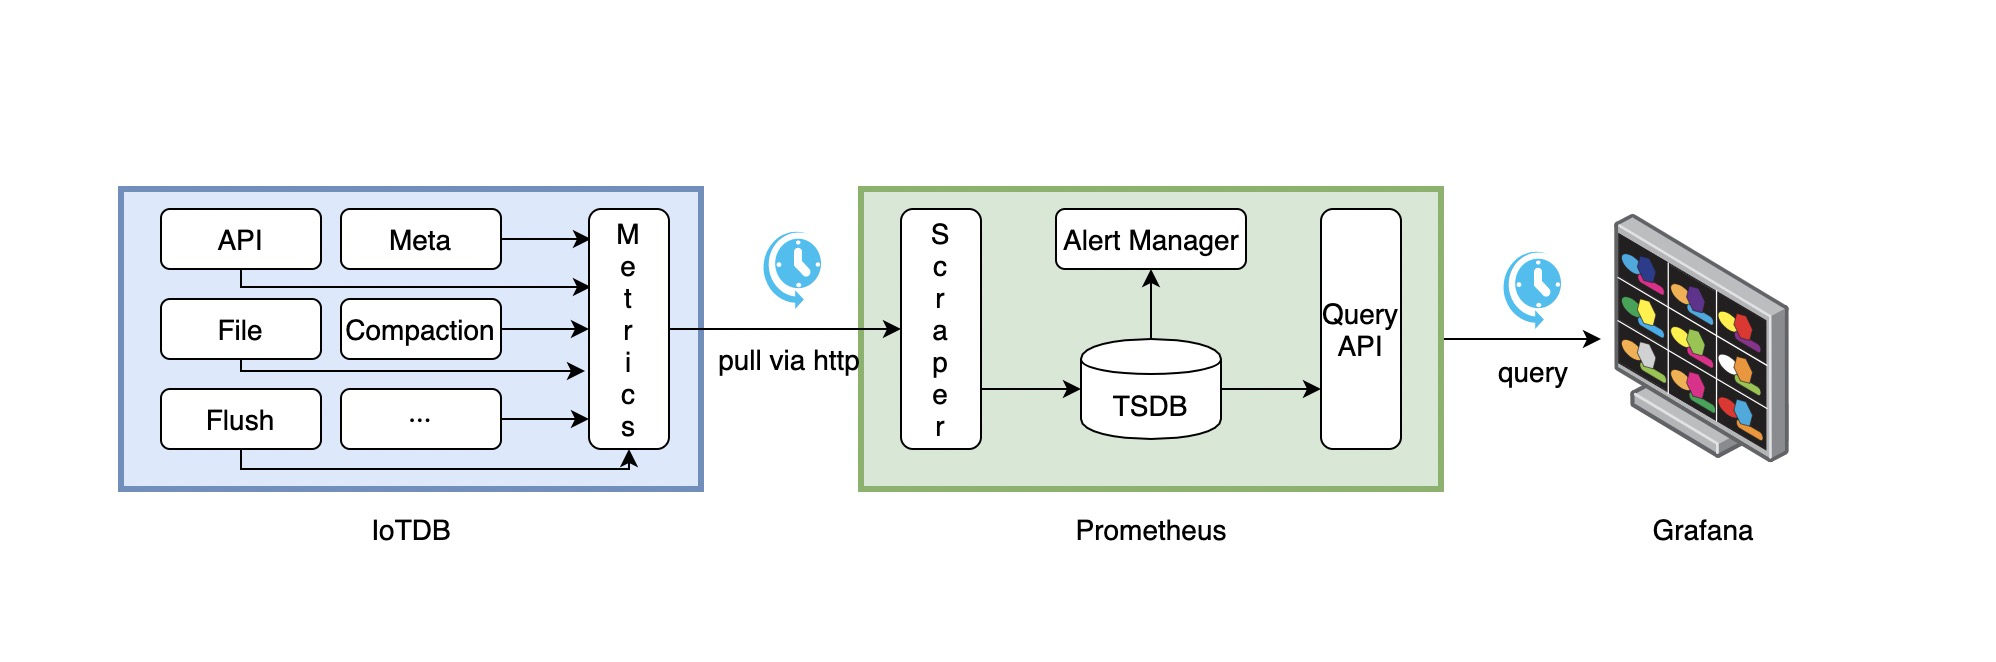
-1. IoTDB在运行过程中持续收集metrics数据。
-2. Prometheus以固定的间隔(可配置)从IoTDB的HTTP接口拉取metrics数据。
-3. Prometheus将拉取到的metrics数据存储到自己的TSDB中。
-4. Grafana以固定的间隔(可配置)从Prometheus查询metrics数据并绘图展示。
+1. IoTDB在运行过程中持续收集监控指标数据。
+2. Prometheus以固定的间隔(可配置)从IoTDB的HTTP接口拉取监控指标数据。
+3. Prometheus将拉取到的监控指标数据存储到自己的TSDB中。
+4. Grafana以固定的间隔(可配置)从Prometheus查询监控指标数据并绘图展示。
从交互流程可以看出,我们需要做一些额外的工作来部署和配置Prometheus和Grafana。
@@ -349,7 +351,7 @@ static_configs:
[Grafana从Prometheus查询数据并绘图的文档](https://prometheus.io/docs/visualization/grafana/#grafana-support-for-prometheus)
-#### 5.3. Apache IoTDB Dashboard
+### 1.4.3. Apache IoTDB Dashboard
我们提供了Apache IoTDB Dashboard,在Grafana中显示的效果图如下所示:

@@ -360,3 +362,41 @@ Apache IoTDB Dashboard的获取方式:
2. 您可以访问[Grafana
Dashboard官网](https://grafana.com/grafana/dashboards/)搜索`Apache IoTDB
Dashboard`并使用
在创建Grafana时,您可以选择Import刚刚下载的json文件,并为Apache IoTDB Dashboard选择对应目标数据源。
+
+# 2. 系统状态监控
+进入 Jconsole 监控页面后,首先看到的是 IoTDB 各类运行情况的概览。在这里,您可以看到堆内存信息、线程信息、类信息以及服务器的 CPU
使用情况。
+
+# 3. JMX MBean 监控
+通过使用 JConsole 工具并与 JMX 连接,您可以查看一些系统统计信息和参数。
+本节描述如何使用 JConsole 的 "Mbean" 选项卡来监视 IoTDB 的一些系统配置、写入数据统计等等。 连接到 JMX 后,您可以通过
"MBeans" 标签找到名为 "org.apache.iotdb.service" 的 "MBean",如下图所示。
+
+<img style="width:100%; max-width:800px; max-height:600px; margin-left:auto;
margin-right:auto; display:block;"
src="https://user-images.githubusercontent.com/46039728/149951720-707f1ee8-32ee-4fde-9252-048caebd232e.png";>
<br>
+
+# 4. 性能监控
+
+## 4.1. 介绍
+
+性能监控模块用来监控 IOTDB
每一个操作的耗时,以便用户更好的了解数据库的整体性能。此模块会统计每一种操作的平均耗时,以及耗时在一定时间区间内(1ms,4ms,16ms,64ms,256ms,1024ms,以上)的操作的比例。输出文件在
log_measure.log 中。输出样例如下:
+
+<img style="width:100%; max-width:800px; max-height:600px; margin-left:auto;
margin-right:auto; display:block;"
src="https://user-images.githubusercontent.com/13203019/60937461-14296f80-a303-11e9-9602-a7bed624bfb3.png";>
+
+## 4.2. 配置参数
+
+配置文件位置:conf/iotdb-datanode.properties
+
+<center>
+
+**表 -配置参数以及描述项**
+
+| 参数 | 默认值 | 描述 |
+| :------------------------ | :----- | :------------------- |
+| enable\_performance\_stat | false | 是否开启性能监控模块 |
+</center>
+
+# 5. Cache 命中率统计
+
+为了提高查询性能,IOTDB 对 ChunkMetaData 和 TsFileMetaData 进行了缓存。用户可以通过 debug 级别的日志以及
MXBean 两种方式来查看缓存的命中率,并根据缓存命中率以及系统内存来调节缓存所使用的内存大小。使用 MXBean 查看缓存命中率的方法为:
+1. 通过端口 31999 连接 jconsole,并在上方菜单项中选择‘MBean’.
+2. 展开侧边框并选择 'org.apache.iotdb.db.service'. 将会得到如下图所示结果:
+
+<img style="width:100%; max-width:800px; max-height:600px; margin-left:auto;
margin-right:auto; display:block;"
src="https://user-images.githubusercontent.com/19167280/112426760-73e3da80-8d73-11eb-9a8f-9232d1f2033b.png";>
\ No newline at end of file
diff --git a/site/src/main/.vuepress/config.js
b/site/src/main/.vuepress/config.js
index 2230fe457b..9bdba2d08c 100644
--- a/site/src/main/.vuepress/config.js
+++ b/site/src/main/.vuepress/config.js
@@ -762,7 +762,7 @@ var config = {
title: 'Maintenance Tools',
children: [
['Maintenance-Tools/Maintenance-Command','Maintenance Command'],
-
['Maintenance-Tools/Monitor-and-Log-Tools','Monitor and Log Tools'],
+
['Maintenance-Tools/Log-Tool','Log Tool'],
['Maintenance-Tools/JMX-Tool','JMX Tool'],
['Maintenance-Tools/MLogParser-Tool','MLogParser Tool'],
['Maintenance-Tools/NodeTool','Node Tool'],
@@ -938,7 +938,7 @@ var config = {
title: 'Maintenance Tools',
children: [
['Maintenance-Tools/Maintenance-Command','Maintenance Command'],
-
['Maintenance-Tools/Monitor-and-Log-Tools','Monitor and Log Tools'],
+
['Maintenance-Tools/Log-Tool','Log Tool'],
['Maintenance-Tools/JMX-Tool','JMX Tool'],
['Maintenance-Tools/MLogParser-Tool','MLogParser Tool'],
['Maintenance-Tools/NodeTool','Node Tool'],
@@ -1681,7 +1681,7 @@ var config = {
title: '运维工具',
children: [
['Maintenance-Tools/Maintenance-Command','运维命令'],
-
['Maintenance-Tools/Monitor-and-Log-Tools','监控工具和系统日志'],
+
['Maintenance-Tools/Log-Tool','日志工具'],
['Maintenance-Tools/JMX-Tool','JMX 工具'],
['Maintenance-Tools/MLogParser-Tool','Mlog解析工具'],
['Maintenance-Tools/NodeTool','节点工具'],
@@ -1859,7 +1859,7 @@ var config = {
title: '运维工具',
children: [
['Maintenance-Tools/Maintenance-Command','运维命令'],
-
['Maintenance-Tools/Monitor-and-Log-Tools','监控工具和系统日志'],
+
['Maintenance-Tools/Log-Tool','日志工具'],
['Maintenance-Tools/JMX-Tool','JMX 工具'],
['Maintenance-Tools/MLogParser-Tool','Mlog解析工具'],
['Maintenance-Tools/NodeTool','节点工具'],