This is an automated email from the ASF dual-hosted git repository.

leirui pushed a commit to branch rl
in repository https://gitbox.apache.org/repos/asf/iotdb-docs.git
The following commit(s) were added to refs/heads/rl by this push:
new 24cdf48 fix url in benchmark.md and finish WorkBench
24cdf48 is described below
commit 24cdf48f62a8d3b2304783f58ee9cc239ba6a6bf
Author: Lei Rui <[email protected]>
AuthorDate: Thu Jul 27 22:29:51 2023 +0800
fix url in benchmark.md and finish WorkBench
---
src/UserGuide/Master/Tools-System/Benchmark.md | 34 ++--
src/UserGuide/Master/Tools-System/Workbench.md | 220 +++++++++++-----------
src/zh/UserGuide/Master/Tools-System/Benchmark.md | 46 ++---
src/zh/UserGuide/Master/Tools-System/Workbench.md | 2 +-
src/zh/UserGuide/V1.2.x/Tools-System/Benchmark.md | 44 ++---
5 files changed, 152 insertions(+), 194 deletions(-)
diff --git a/src/UserGuide/Master/Tools-System/Benchmark.md
b/src/UserGuide/Master/Tools-System/Benchmark.md
index 54628f9..ce889b8 100644
--- a/src/UserGuide/Master/Tools-System/Benchmark.md
+++ b/src/UserGuide/Master/Tools-System/Benchmark.md
@@ -25,13 +25,13 @@ IoT-benchmark is a time-series database benchmarking tool
based on Java and big
Figure 1-1 below includes the test benchmark process and other extended
functions. These processes can be unified by IoT-benchmark. IoT Benchmark
supports a variety of workloads, including **pure write, pure query, write
query mixed**, etc., supports **software and hardware system monitoring, test
metric measurement** and other monitoring functions, and also realizes
**initializing the database automatically, test data analysis and system
parameter optimization** functions.
-
+
Figure 1-1
Referring to the YCSB test tool's design idea of separating the three
components of workload generation, performance metric measurement and database
interface, the modular design of IoT-benchmark is shown in Figure 1-2.
Different from the YCSB-based test tool system, IoT-benchmark adds a system
monitoring module to support the persistence of test data and system monitoring
data. In addition, some special load testing functions especially designed for
time series data scenarios have been [...]
-
+
Figure 1-2
@@ -71,7 +71,7 @@ Table 1-1 Comparison of big data test benchmarks
The directory structure of the test package is shown in Figure 1-3 below. The
test configuration file is conf/config.properties, and the test startup scripts
are benchmark.sh (Linux & MacOS) and benchmark.bat (Windows). The detailed
usage of the files is shown in Table 1-2.
-
+
Figure 1-3 List of files and folders
@@ -99,7 +99,7 @@ Table 1-2 Usage list of files and folders
All the log files of the test are stored in the logs folder, and the test
results are stored in the data/csvOutput folder after the test is completed.
For example, after the test, we get the following result matrix:
-
+
- Result Matrix
- OkOperation: successful operations
@@ -253,27 +253,24 @@ Table 2-3 Configuration parameter information
First, start the tested time series databases Apache-IoTDB and KairosDB on
172.21.4.3 and 172.21.4.4 respectively, and then start server resource
monitoring through the ser-benchamrk.sh script on 172.21.4.2, 172.21.4.3 and
172.21.4.4 (Figure 2-1). Then modify the conf/config.properties files in the
iotdb-0.13-0.0.1 and kairosdb-0.0.1 folders in 172.21.4.2 according to Table
2-3 to meet the test requirements. Use benchmark.sh to start the writing test
of Apache-IoTDB and KairosDB successively.
-
+
Figure 2-1 Server monitoring tasks
For example, if we first start the test on KairosDB, IoT-benchmark will create
a CONFIG data table in the MySQL database to store the configuration
information of this test (Figure 2-2), and there will be a log output of the
current test progress during the test execution (Figure 2-3) . When the test is
completed, the test result will be output (Figure 2-3), and the result will be
written into the FINAL_RESULT data table (Figure 2-4).
-
+
Figure 2-2 Test configuration information table
-
-
-
-
-
-
-
+
+
+
+
Figure 2-3 Test progress and results
-
+
Figure 2-4 Test result table
@@ -281,15 +278,14 @@ Afterwards, we will start the test on Apache-IoTDB. The
same IoT-benchmark will
依照测试结果信息我们知道同样的配置写入Apache-IoTDB和KairosDB写入延时时间分别为:55.98ms和1324.45ms;写入吞吐分别为:5,125,600.86点/秒和224,819.01点/秒;测试分别执行了585.30秒和11777.99秒。并且KairosDB有写入失败出现,排查后发现是数据磁盘使用率已达到100%,无磁盘空间继续接收数据。而Apache-IoTDB无写入失败现象,全部数据写入完毕后占用磁盘空间仅为4.7G(如图2-5所示);从写入吞吐和磁盘占用情况上看Apache-IoTDB均优于KairosDB。当然后续还有其他测试来从多方面观察和对比,比如查询性能、文件压缩比、数据安全性等。According
to the test result information, we know that under the same configuration the
write delay times of Apache-IoTDB and KairosDB are 55.98ms and 1324.45ms
respectively; the [...]
-
+
Figure 2-5 Disk usage
So what is the resource usage of each server during the test? What is the
specific performance of each write operation? At this time, we can visualize
the data in the server monitoring table and test process recording table by
installing and using Tableau. The use of Tableau will not be introduced in this
article. After connecting to the data table for test data persistence, the
specific results are as follows (taking Apache-IoTDB as an example):
-
-
-
+
+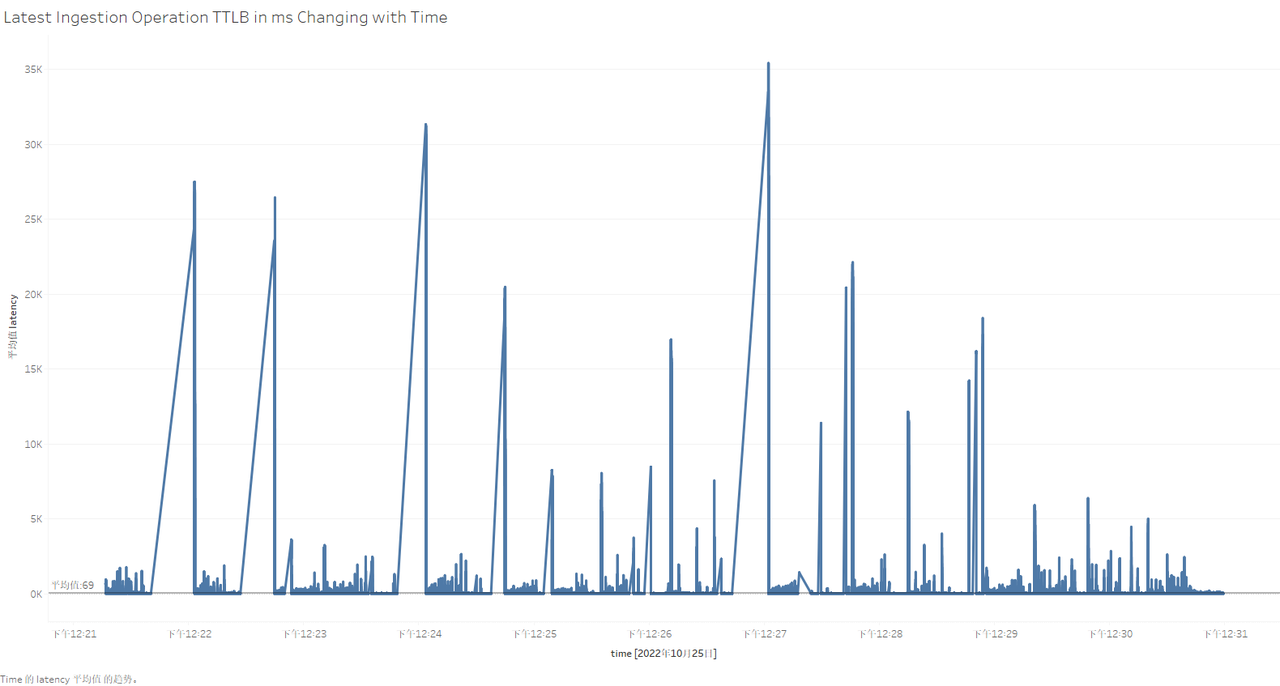
Figure 2-6 Visualization of testing process in Tableau
@@ -314,7 +310,7 @@ Table 2-4 Configuration parameter information
Results:
-
+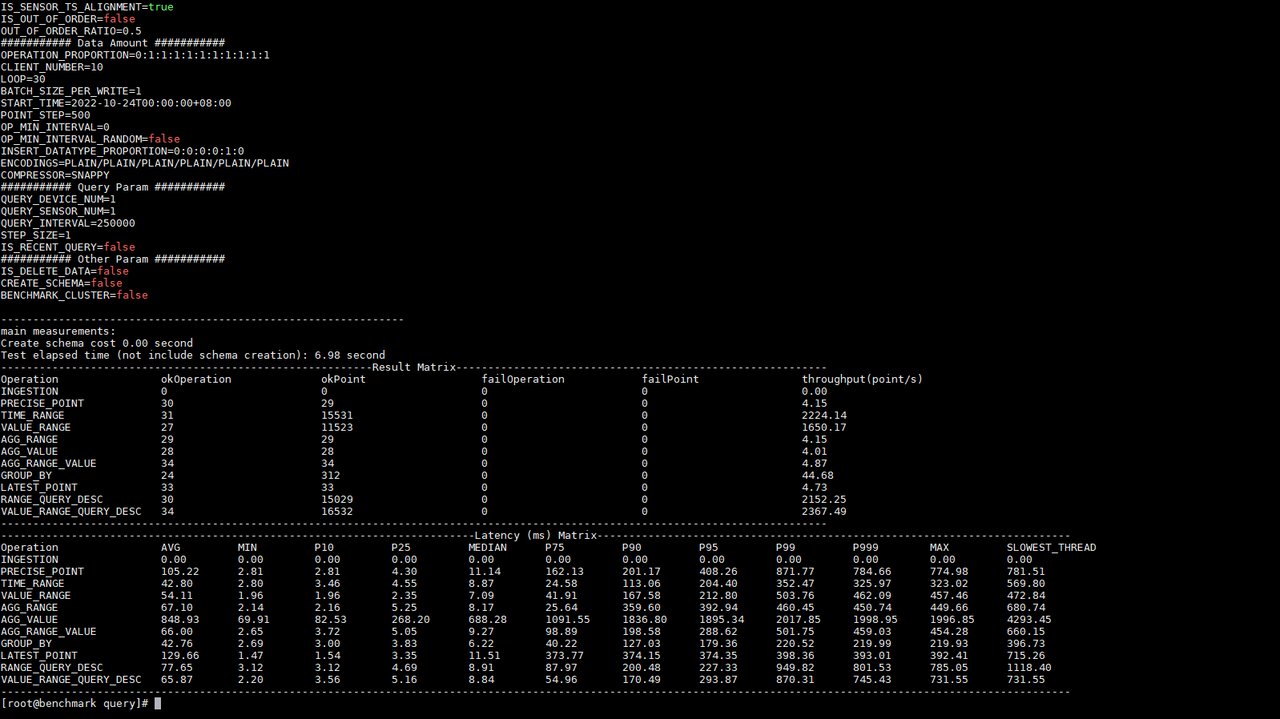
Figure 2-7 Query test results
diff --git a/src/UserGuide/Master/Tools-System/Workbench.md
b/src/UserGuide/Master/Tools-System/Workbench.md
index b01d7e3..ba9c20d 100644
--- a/src/UserGuide/Master/Tools-System/Workbench.md
+++ b/src/UserGuide/Master/Tools-System/Workbench.md
@@ -19,293 +19,286 @@
-->
-## Workbench
+# Workbench
-Workbench是一个可创建多个连接的图形化数据库管理工具,用于管理IoTDB,提供元数据的可视化与管理、数据的增删改查以及权限控制等功能。Workbench不仅满足专业开发人员的所有需求,同时简洁友好的界面设计对初学者来说也易于上手。
+Workbench is a graphical database management tool that can create multiple
connections. It is used to manage IoTDB, and provides functions such as
metadata visualization and management, data addition, deletion, modification,
and permission control. Workbench not only meets all the needs of professional
developers, but the simple and friendly interface design is also easy for
beginners to use.
-## 安装
+## Installation
-如果你在安装过程中遇到任何问题,你可以参考文档或向软件供应商或技术支持团队寻求帮助。
+If you encounter any problems during the installation process, you can refer
to the documentation or seek help from the software vendor or technical support
team.
-环境要求:JDK1.8.0_162及以上。
+Environmental requirements: JDK1.8.0_162 and above.
-1. 下载并解压软件。第一步是从官方网站或一个可信赖的来源下载软件,下载地址为https://www.timecho.com/product 。
-2. 启动后端服务。输入指令:
+1. Download and unzip the software. The first step is to download the software
from the official website or a trusted source at
https://www.timecho.com/product.
+2. Start the backend service. Enter the command:
```
java -jar workbench.jar
```
-或:
+or
```
nohup java -jar workbench.jar >/dev/null 2>&1 &
```
-默认端口为 9090;
+The default port is 9090.
-1. 访问web界面。默认地址为`IP:9090`。
+3. Access the web interface. The default address is `IP:9090`.
-## 登录
+## Log In
-默认用户名为root,密码为123456。用户名必须由字母、数字、下划线组成,不能以数字和下划线开始,须大于等于4个字符,密码必须大于等于6位。点击"**文A**"可切换语言,有中文、英文可选。
+The default user name is root and the password is 123456. The user name must
be composed of letters, numbers, and underscores, and cannot start with numbers
and underscores. It must be greater than or equal to 4 characters, and the
password must be greater than or equal to 6 characters. Click "**文A**" to
switch languages, Chinese and English are available.

-## 用户界面
+## User Interface
-**主界面**
+**Main interface**
-主界面由操作栏、导航栏、工具栏和几个窗格组成。
+The main interface consists of an action bar, a navigation bar, a toolbar, and
several panes.
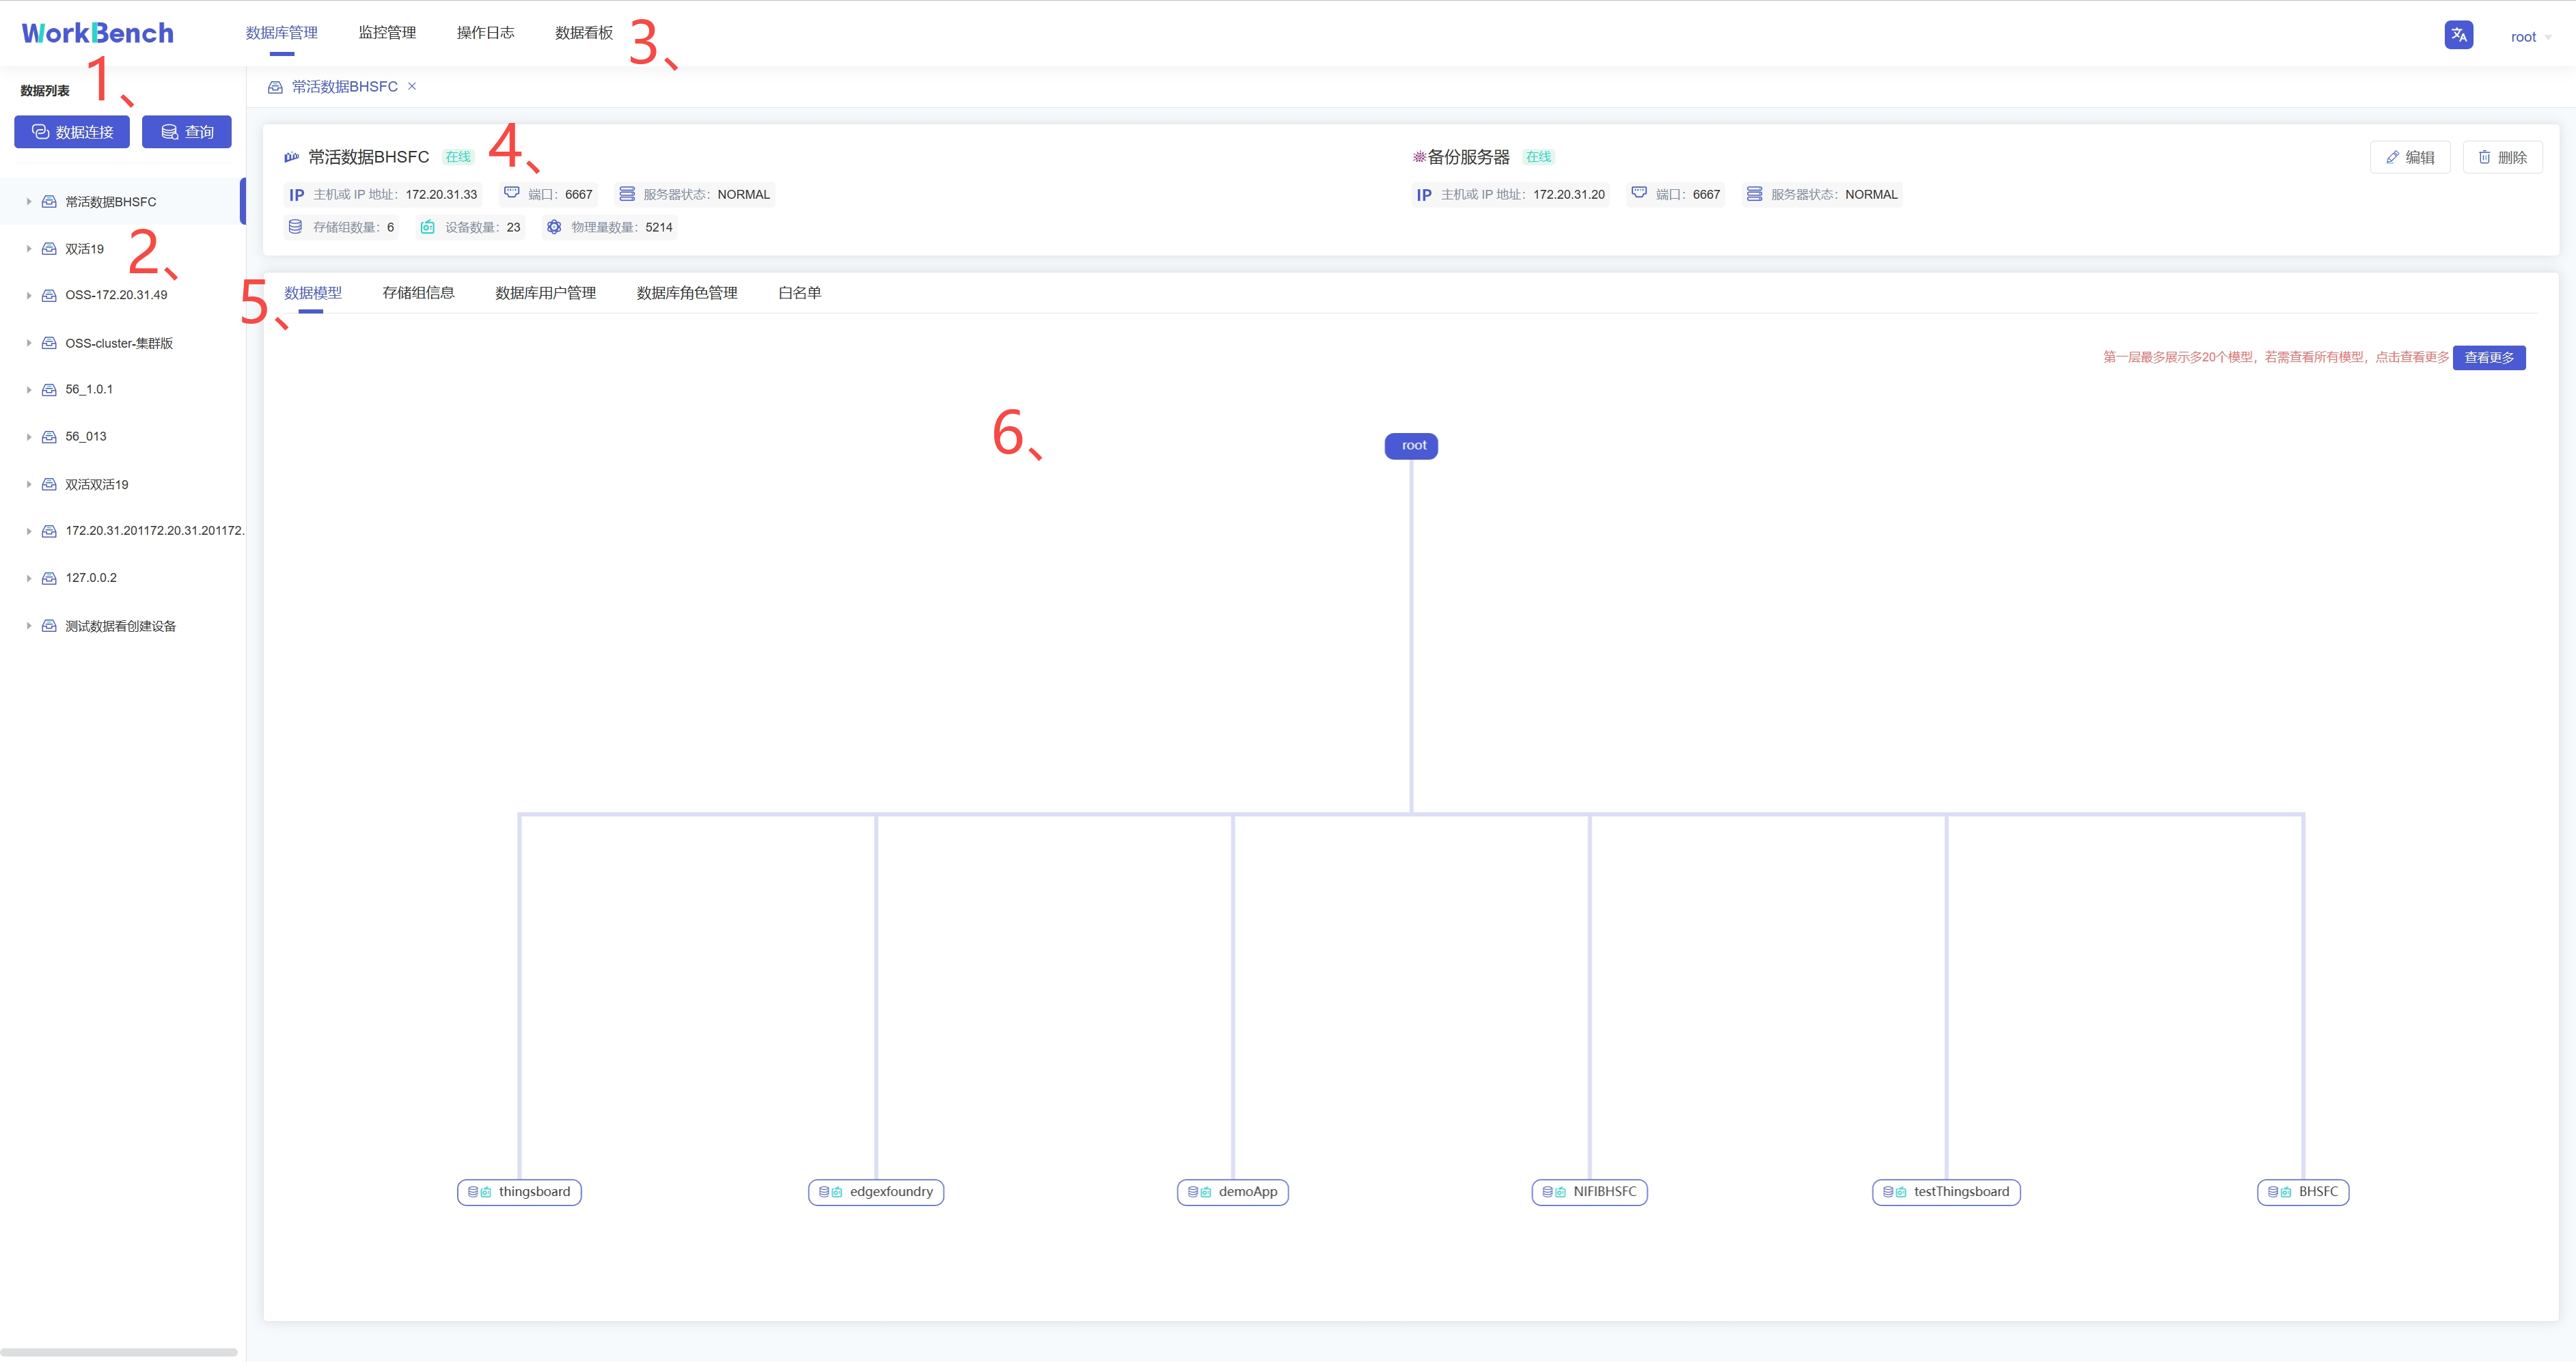
-1、连接操作栏
+### 1. Connection Operation Bar
-可以新建数据库的连接或者数据库的查询。
+You can create a new database connection or database query.
-2、对象窗格
+### 2. Object Pane
-对象窗格显示已连接的数据库实例,采用树状结构设计,点击出现子节点可以方便地处理数据库和它们管理的对象,展示的最低层级是设备。
+The object pane displays the connected database instances. It adopts a tree
structure design. Clicking to display sub-nodes can facilitate the processing
of databases and their managed objects. The lowest level displayed is the
device.
-3、导航栏
+### 3. Navigation Bar
-导航栏可选择"**数据库管理**"、"**监控管理**"、"**操作日志**"、"**数据看板**"。
+In the navigation bar, you can choose "**Database Management**", "**Monitoring
Management**", "**Operation Log**", "**Data Dashboard**".
-4、状态栏
+### 4. Status Bar
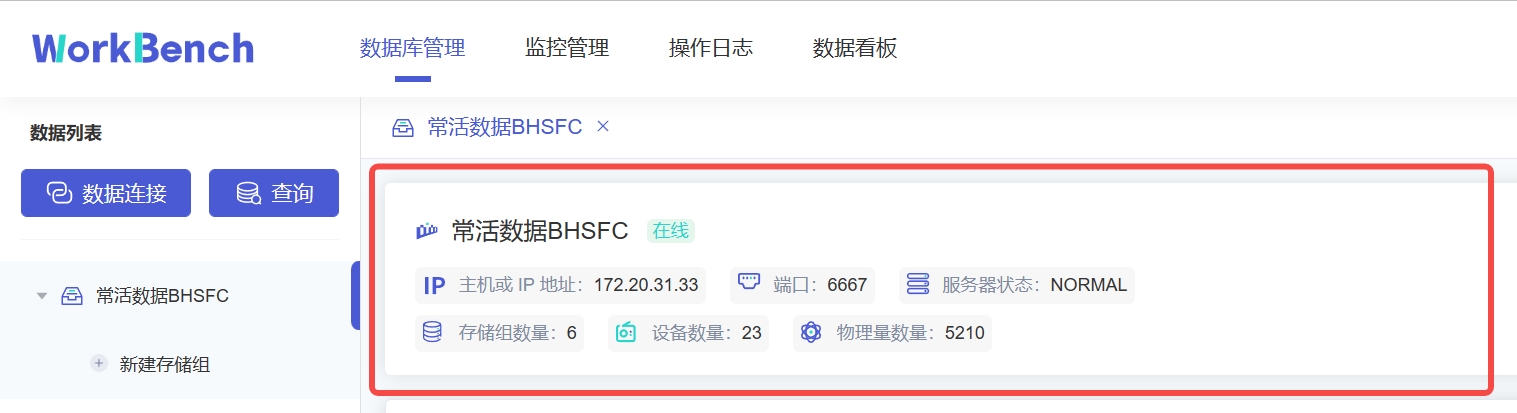
-状态栏显示当前选项下的状态信息,当选中"**数据库管理**"时,状态栏显示数据库的在线情况、IP、端口、服务器状态及其存储组、设备、物理量的数量信息。
+The status bar displays the status information under the current option. When
"**Database Management**" is selected, the status bar displays the online
status of the database, IP, port, server status, and information about the
number of storage groups, devices, and physical quantities.
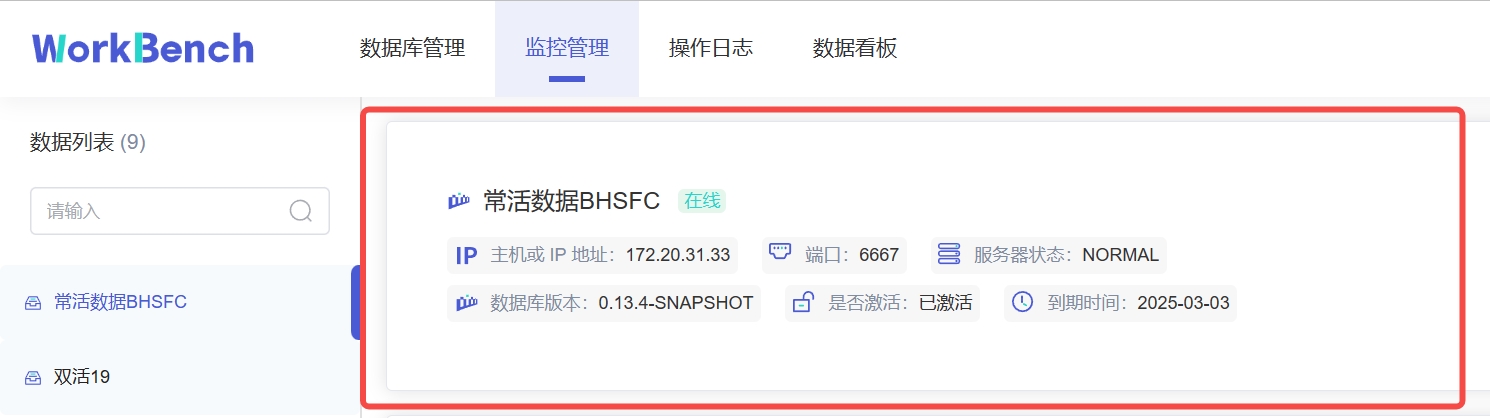
-当选\"**监控管理**\"时,状态栏显示数据库的在线情况、IP、端口、服务器状态、数据库版本、激活信息及到期时间。z注:"**数据库版本**"处的图标表示企业版或开源版,Workbench部分功能在开源版上无法使用。
+When "**Monitoring Management**" is selected, the status column displays the
online status, IP, port, server status, database version, activation
information and expiration time of the database. Note: The icon at "**Database
Version**" indicates the Enterprise Edition or the Open Source Edition, and
some functions of Workbench cannot be used on the Open Source Edition.
-5、操作列
+### 5. Operation Column
-操作列可以选择任意选项进行操作。
+In the operation column, any option can be selected for operation.
-6、信息窗格
+### 6. Information Pane
-信息窗格显示对象的详细信息。
+The information pane displays detailed information about the object.
-## 连接
+## Connection
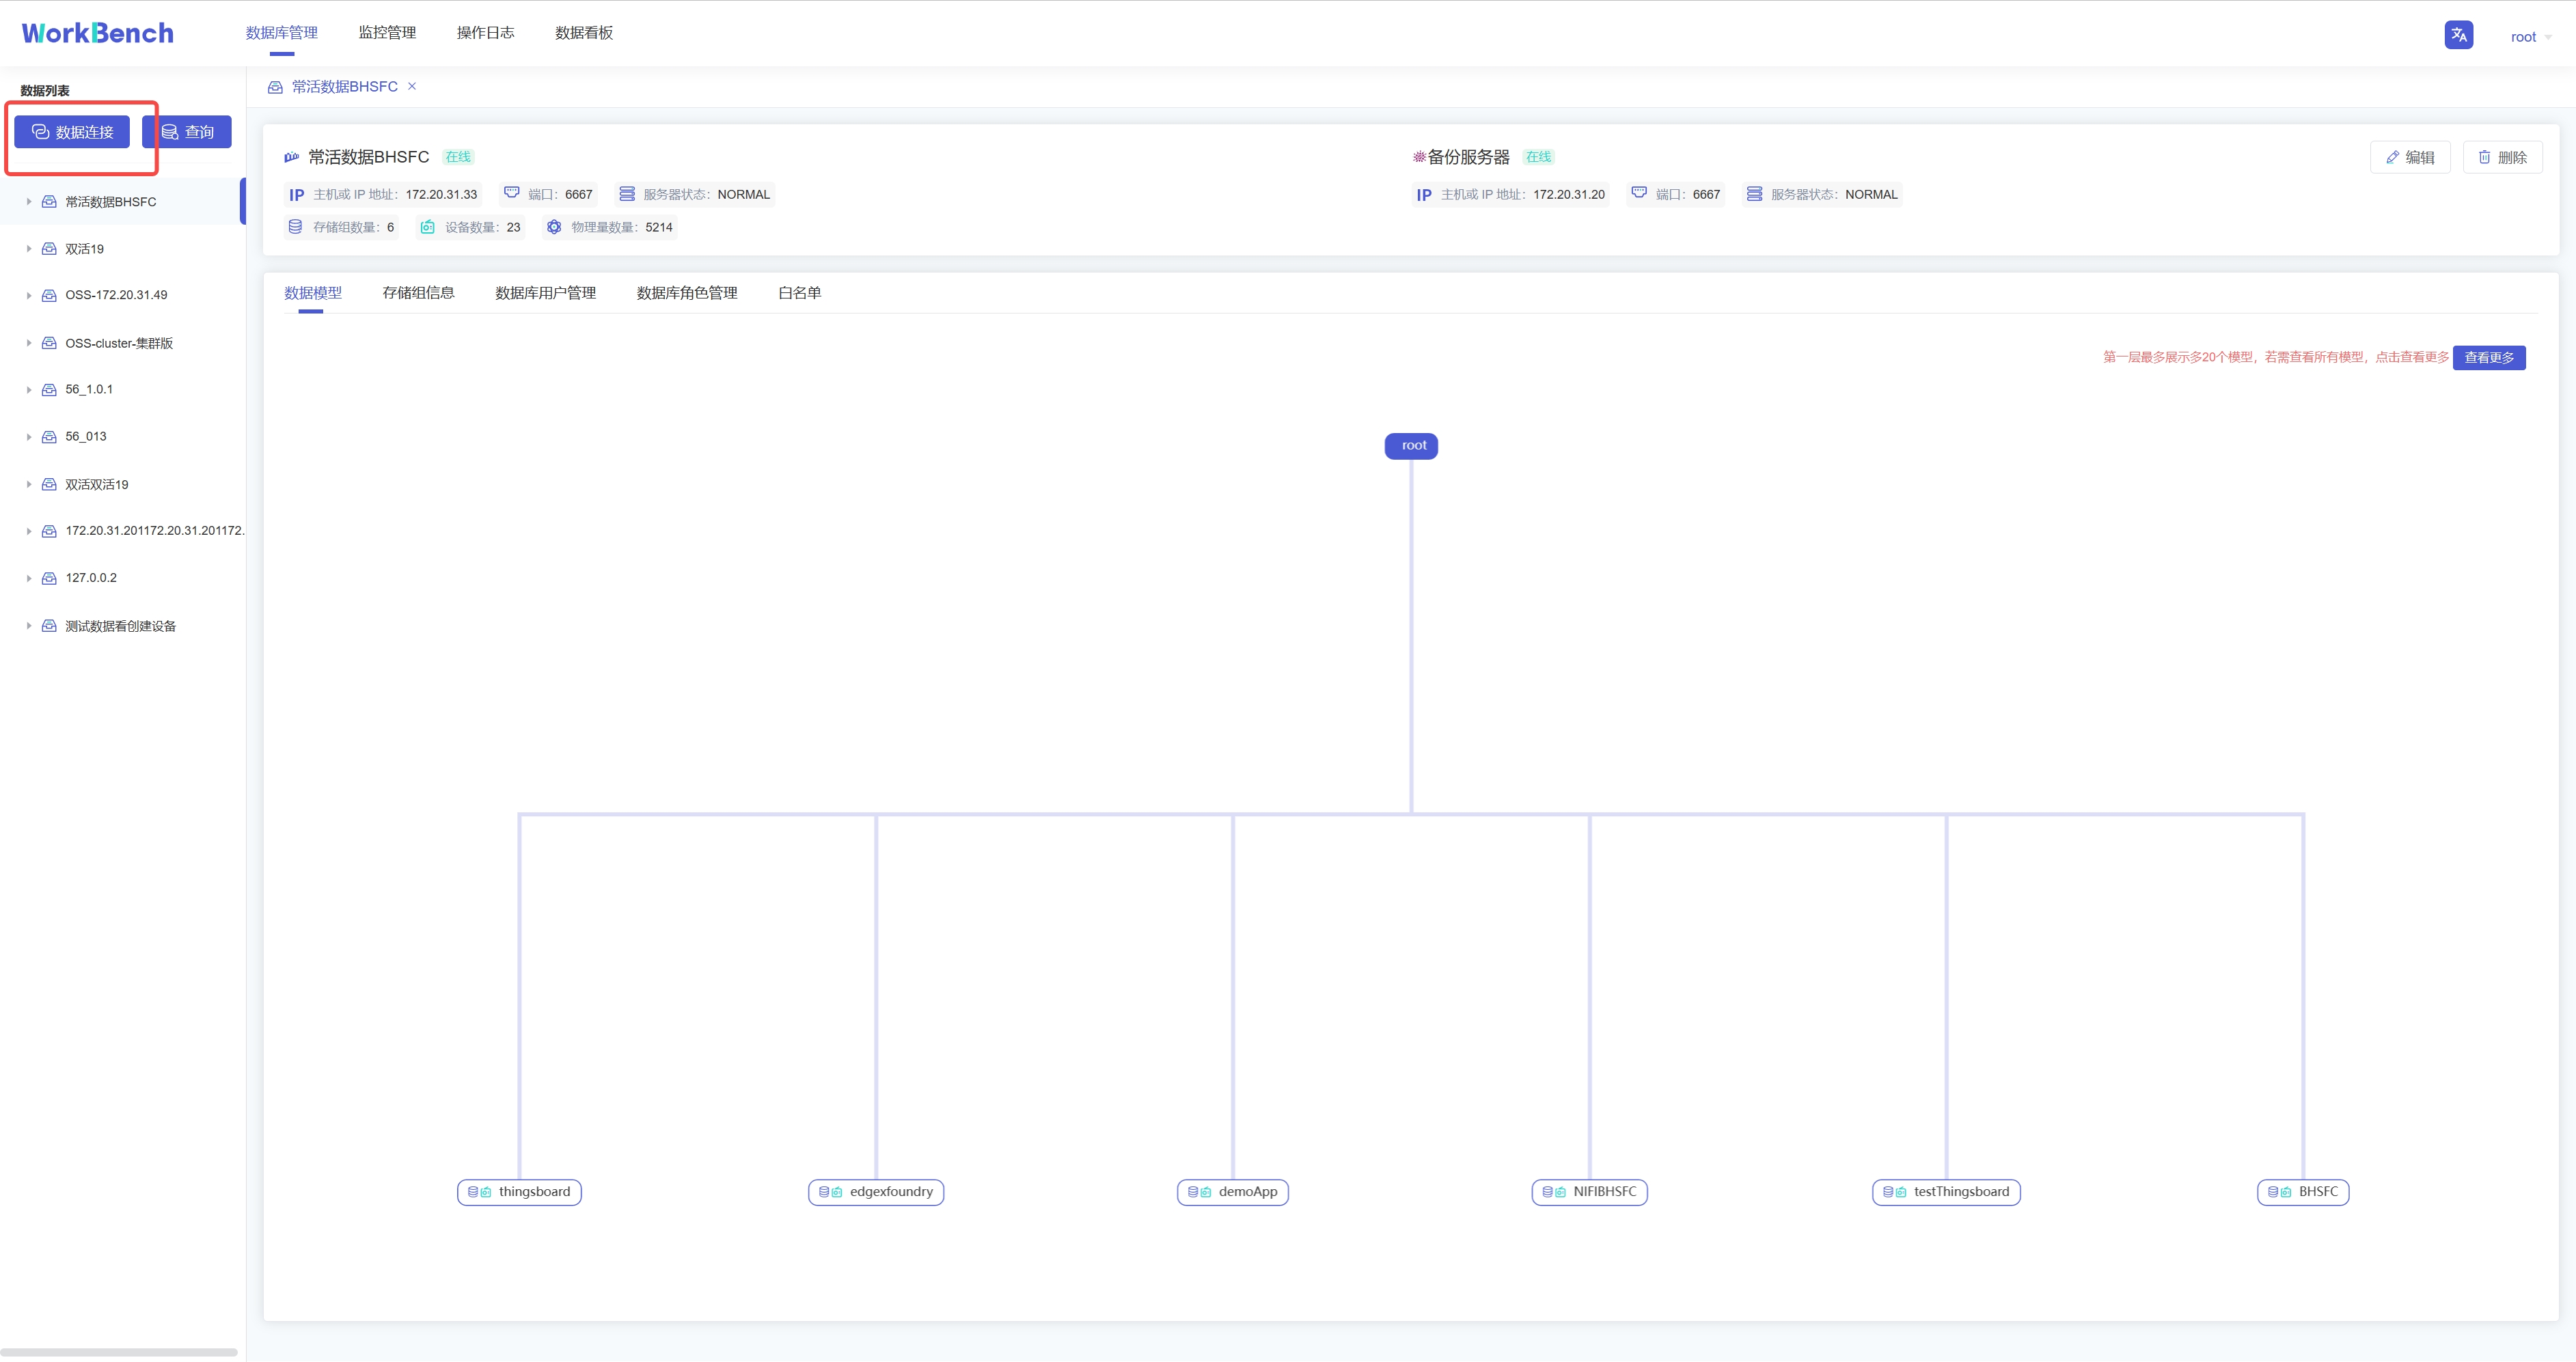
-首先用连接窗口创建一个或多个连接。点击"**数据连接**"创建新建连接。
+First create one or more connections using the connections window. Click
"**Data Connection**" to create a new connection.
-在弹出的连接窗口输入需要填写的信息,其中数据连接名称必须大于等于3个字符。然后点击"**连接测试**",显示"**连接测试通过**"则表示正确连接,点击确定即可新建连接。
+Enter the required information in the pop-up connection window, where the data
connection name must be greater than or equal to 3 characters. Then click
"**Connection Test**", if "**Connection Test Passed**" is displayed, it means
the connection is correct, click OK to create a new connection.
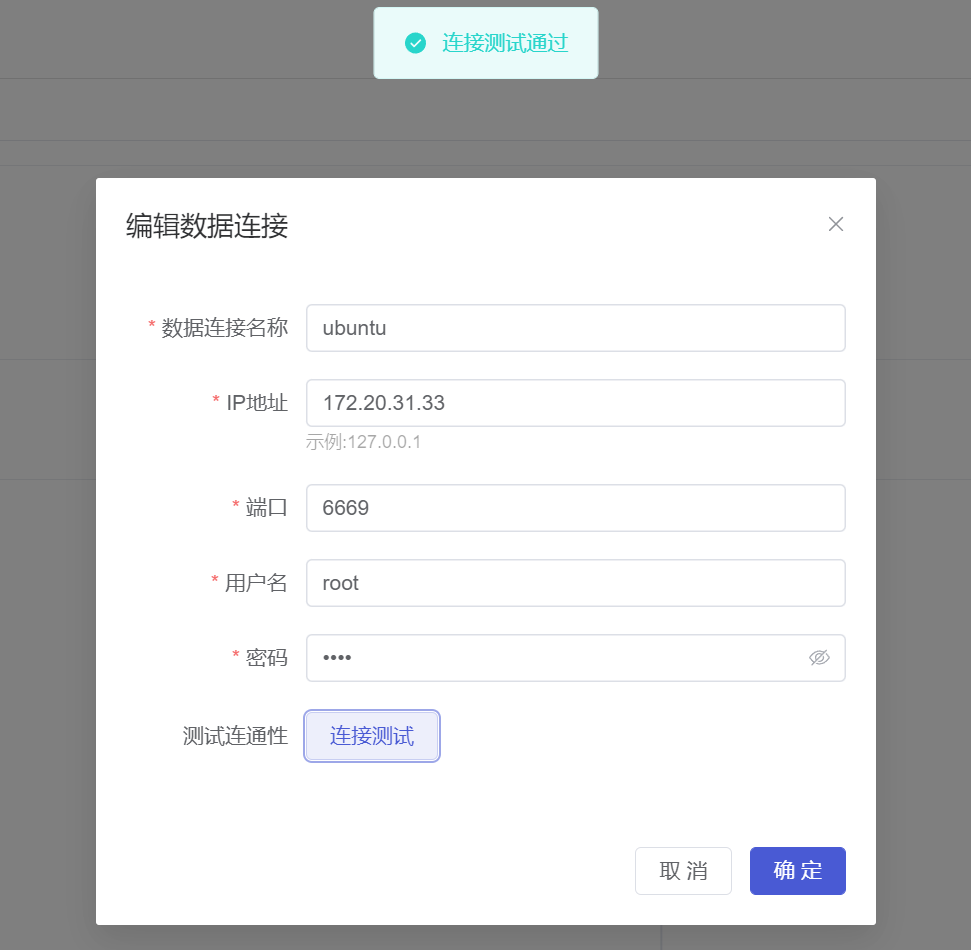
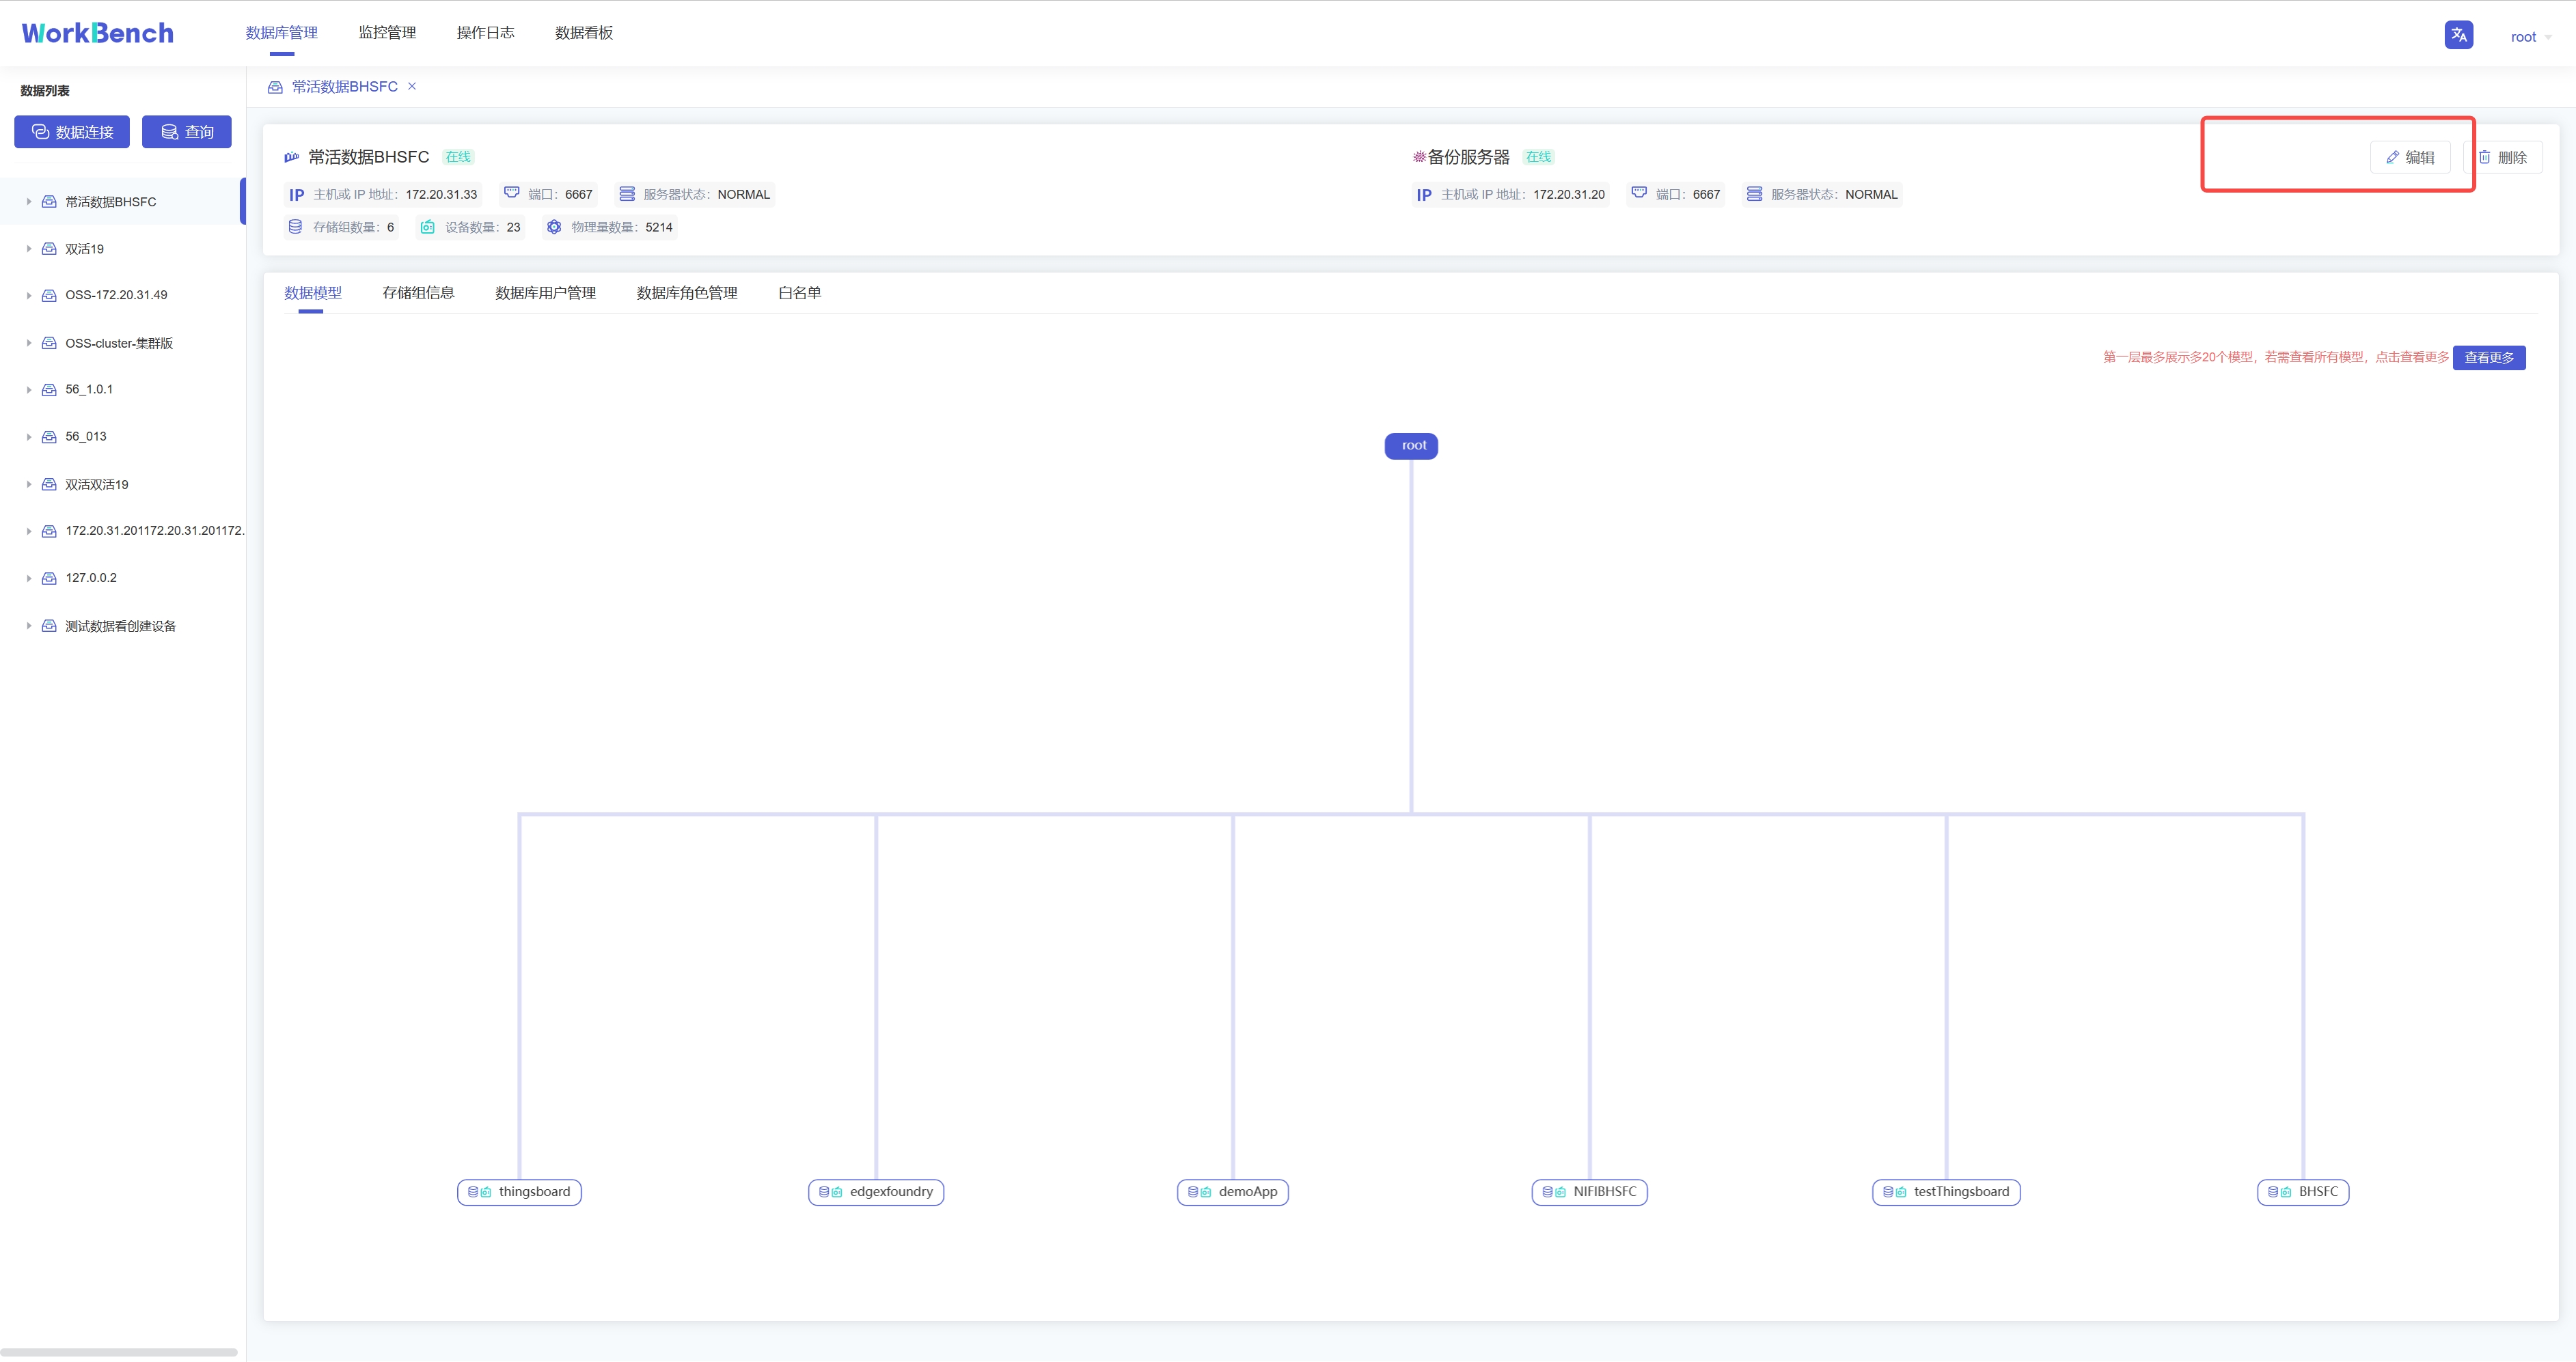
-若要修改连接情况,则可在状态栏右侧点"**编辑**"选项即可修改数据库连接信息。
+If you want to modify the connection, you can click the "**Edit**" option on
the right side of the status bar to modify the database connection information.
-## 服务器安全性
+## Server Security
-**白名单**
+### Whitelist
-企业版IoTDB可以通过添加白名单列表来设置允许访问IoTDB的IP。使用开源版IoTDB连接Workbench无法使用该功能。
+The enterprise version of IoTDB can set the IPs that are allowed to access
IoTDB by adding a whitelist. This function cannot be used when using the open
source version of IoTDB to connect to Workbench.
-从导航栏选择"**数据库管理**"-\>"**白名单**"可查看已添加的白名单IP列表。
+Select "**Database Management**"->"**White List**" from the navigation bar to
view the list of added whitelist IPs.
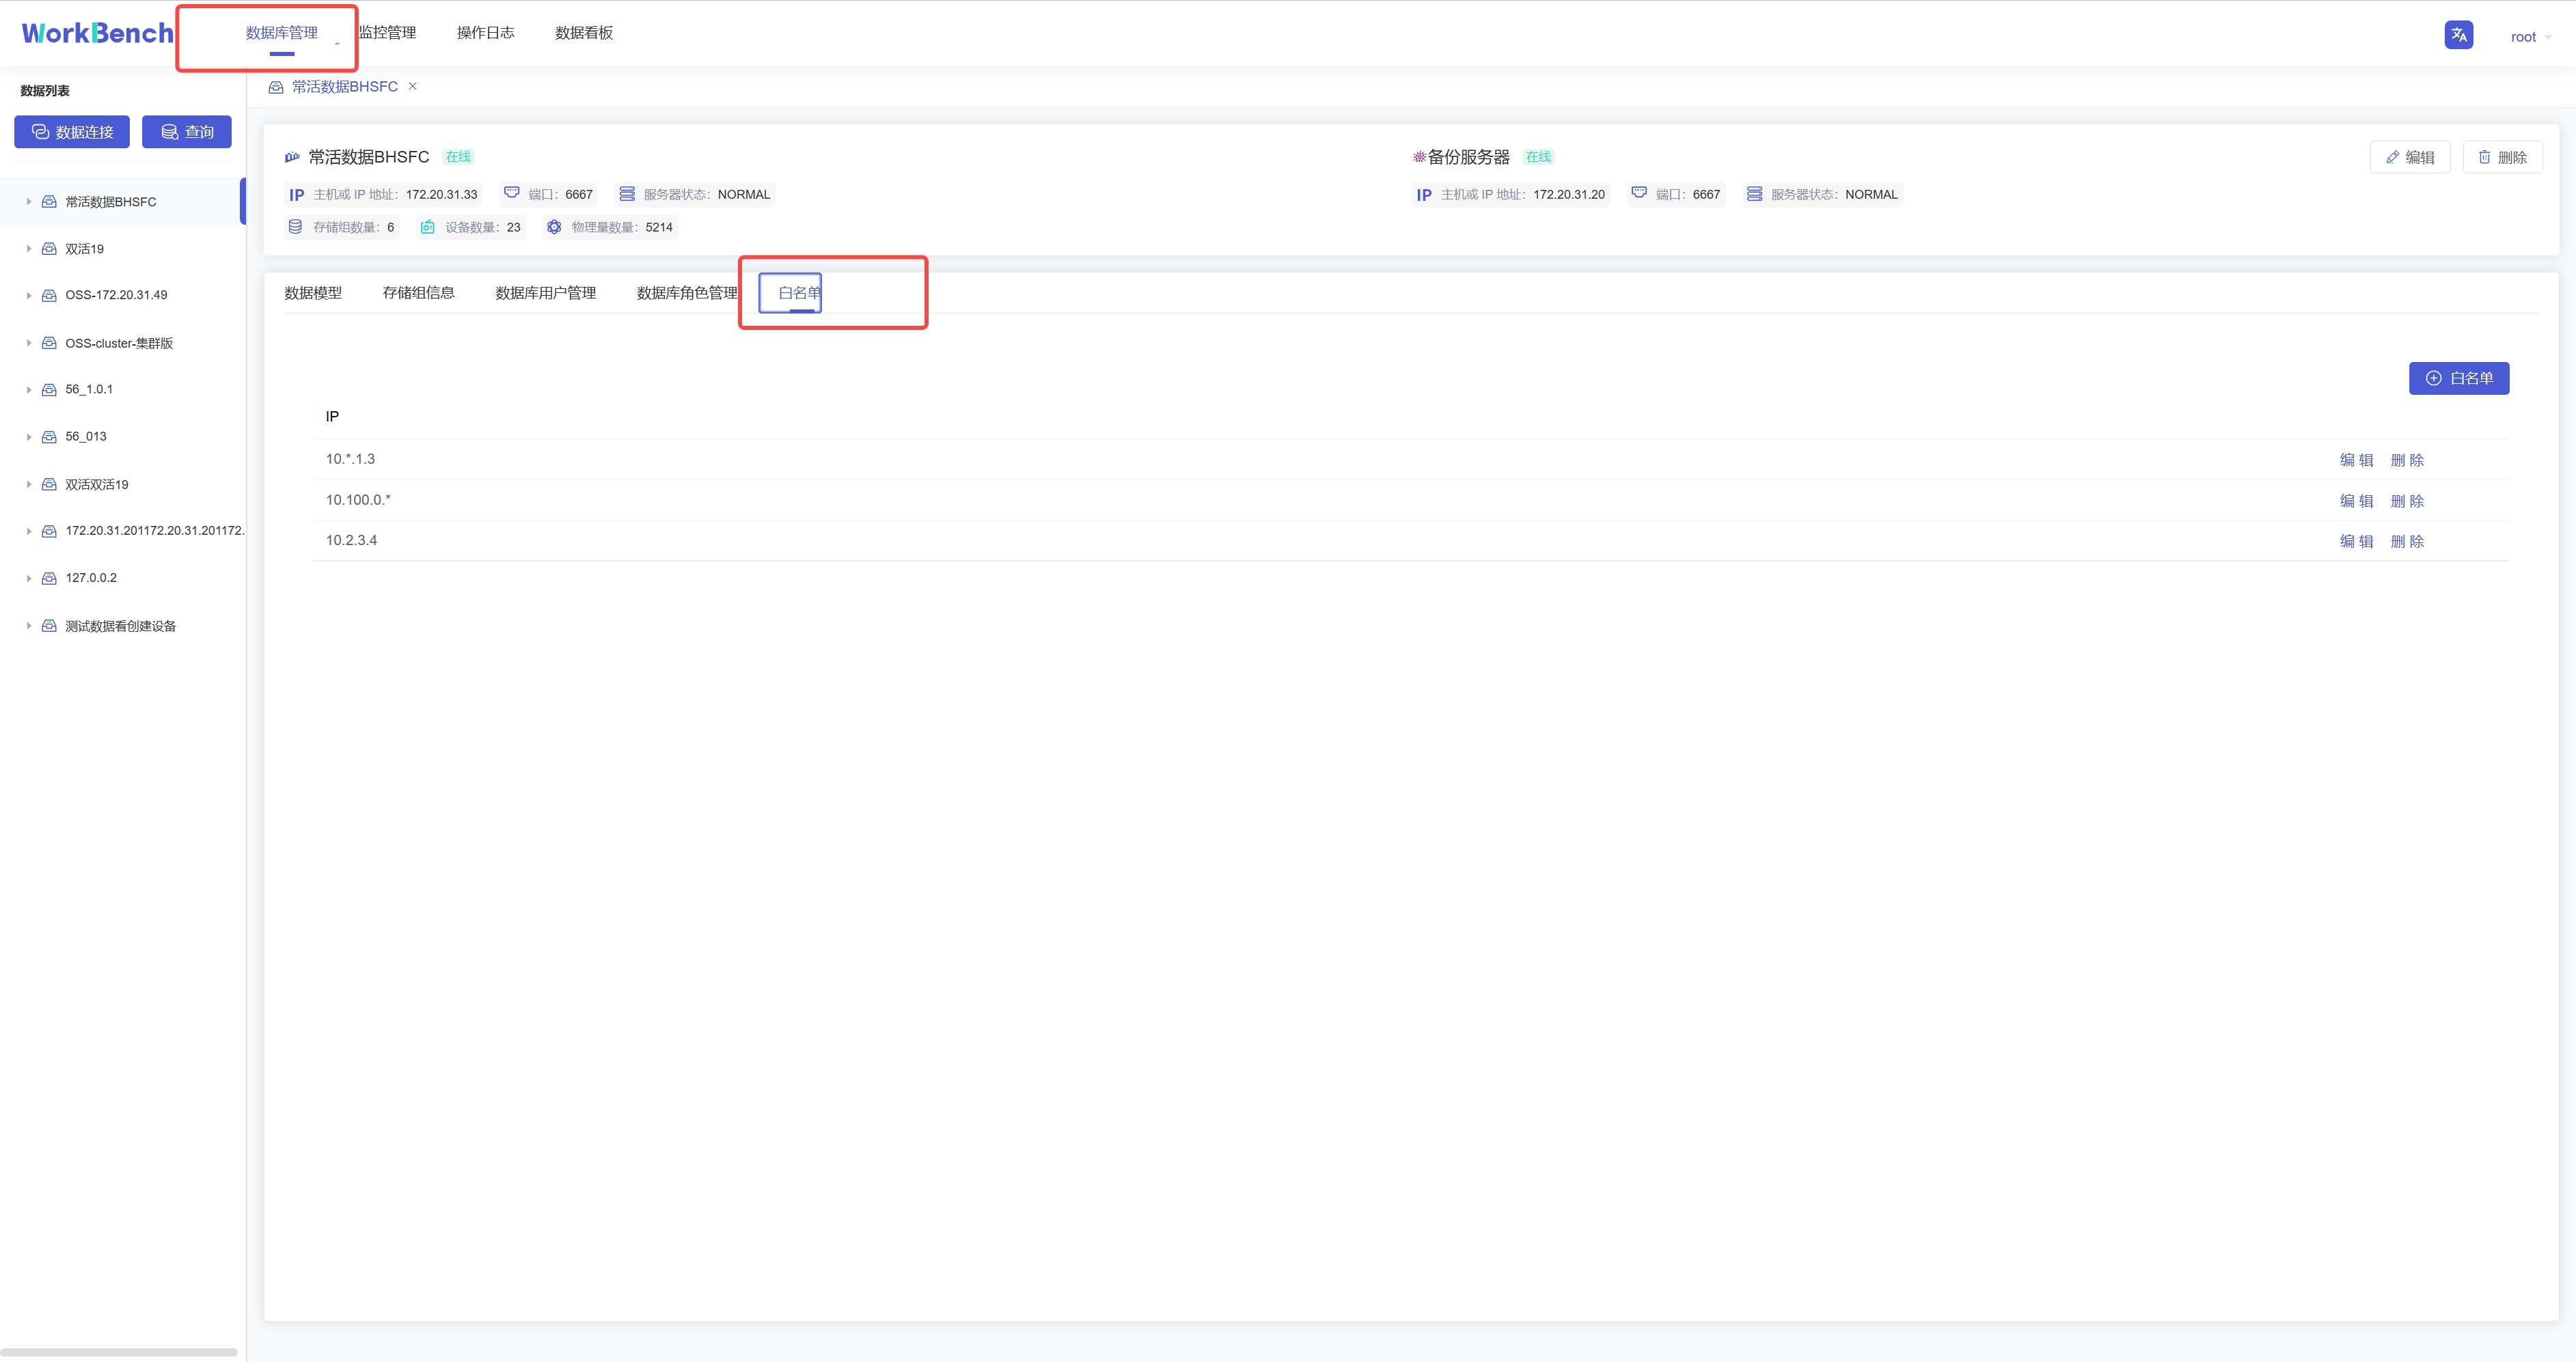
-点击"**白名单**"可新增白名单IP,点击"**编辑**"/"**删除**"可修改白名单列表的IP信息。
+Click "**Whitelist**" to add whitelist IP, and click "**Edit**"/"**Delete**"
to modify the IP information of whitelist.
-**权限管理**
+### Authority Management
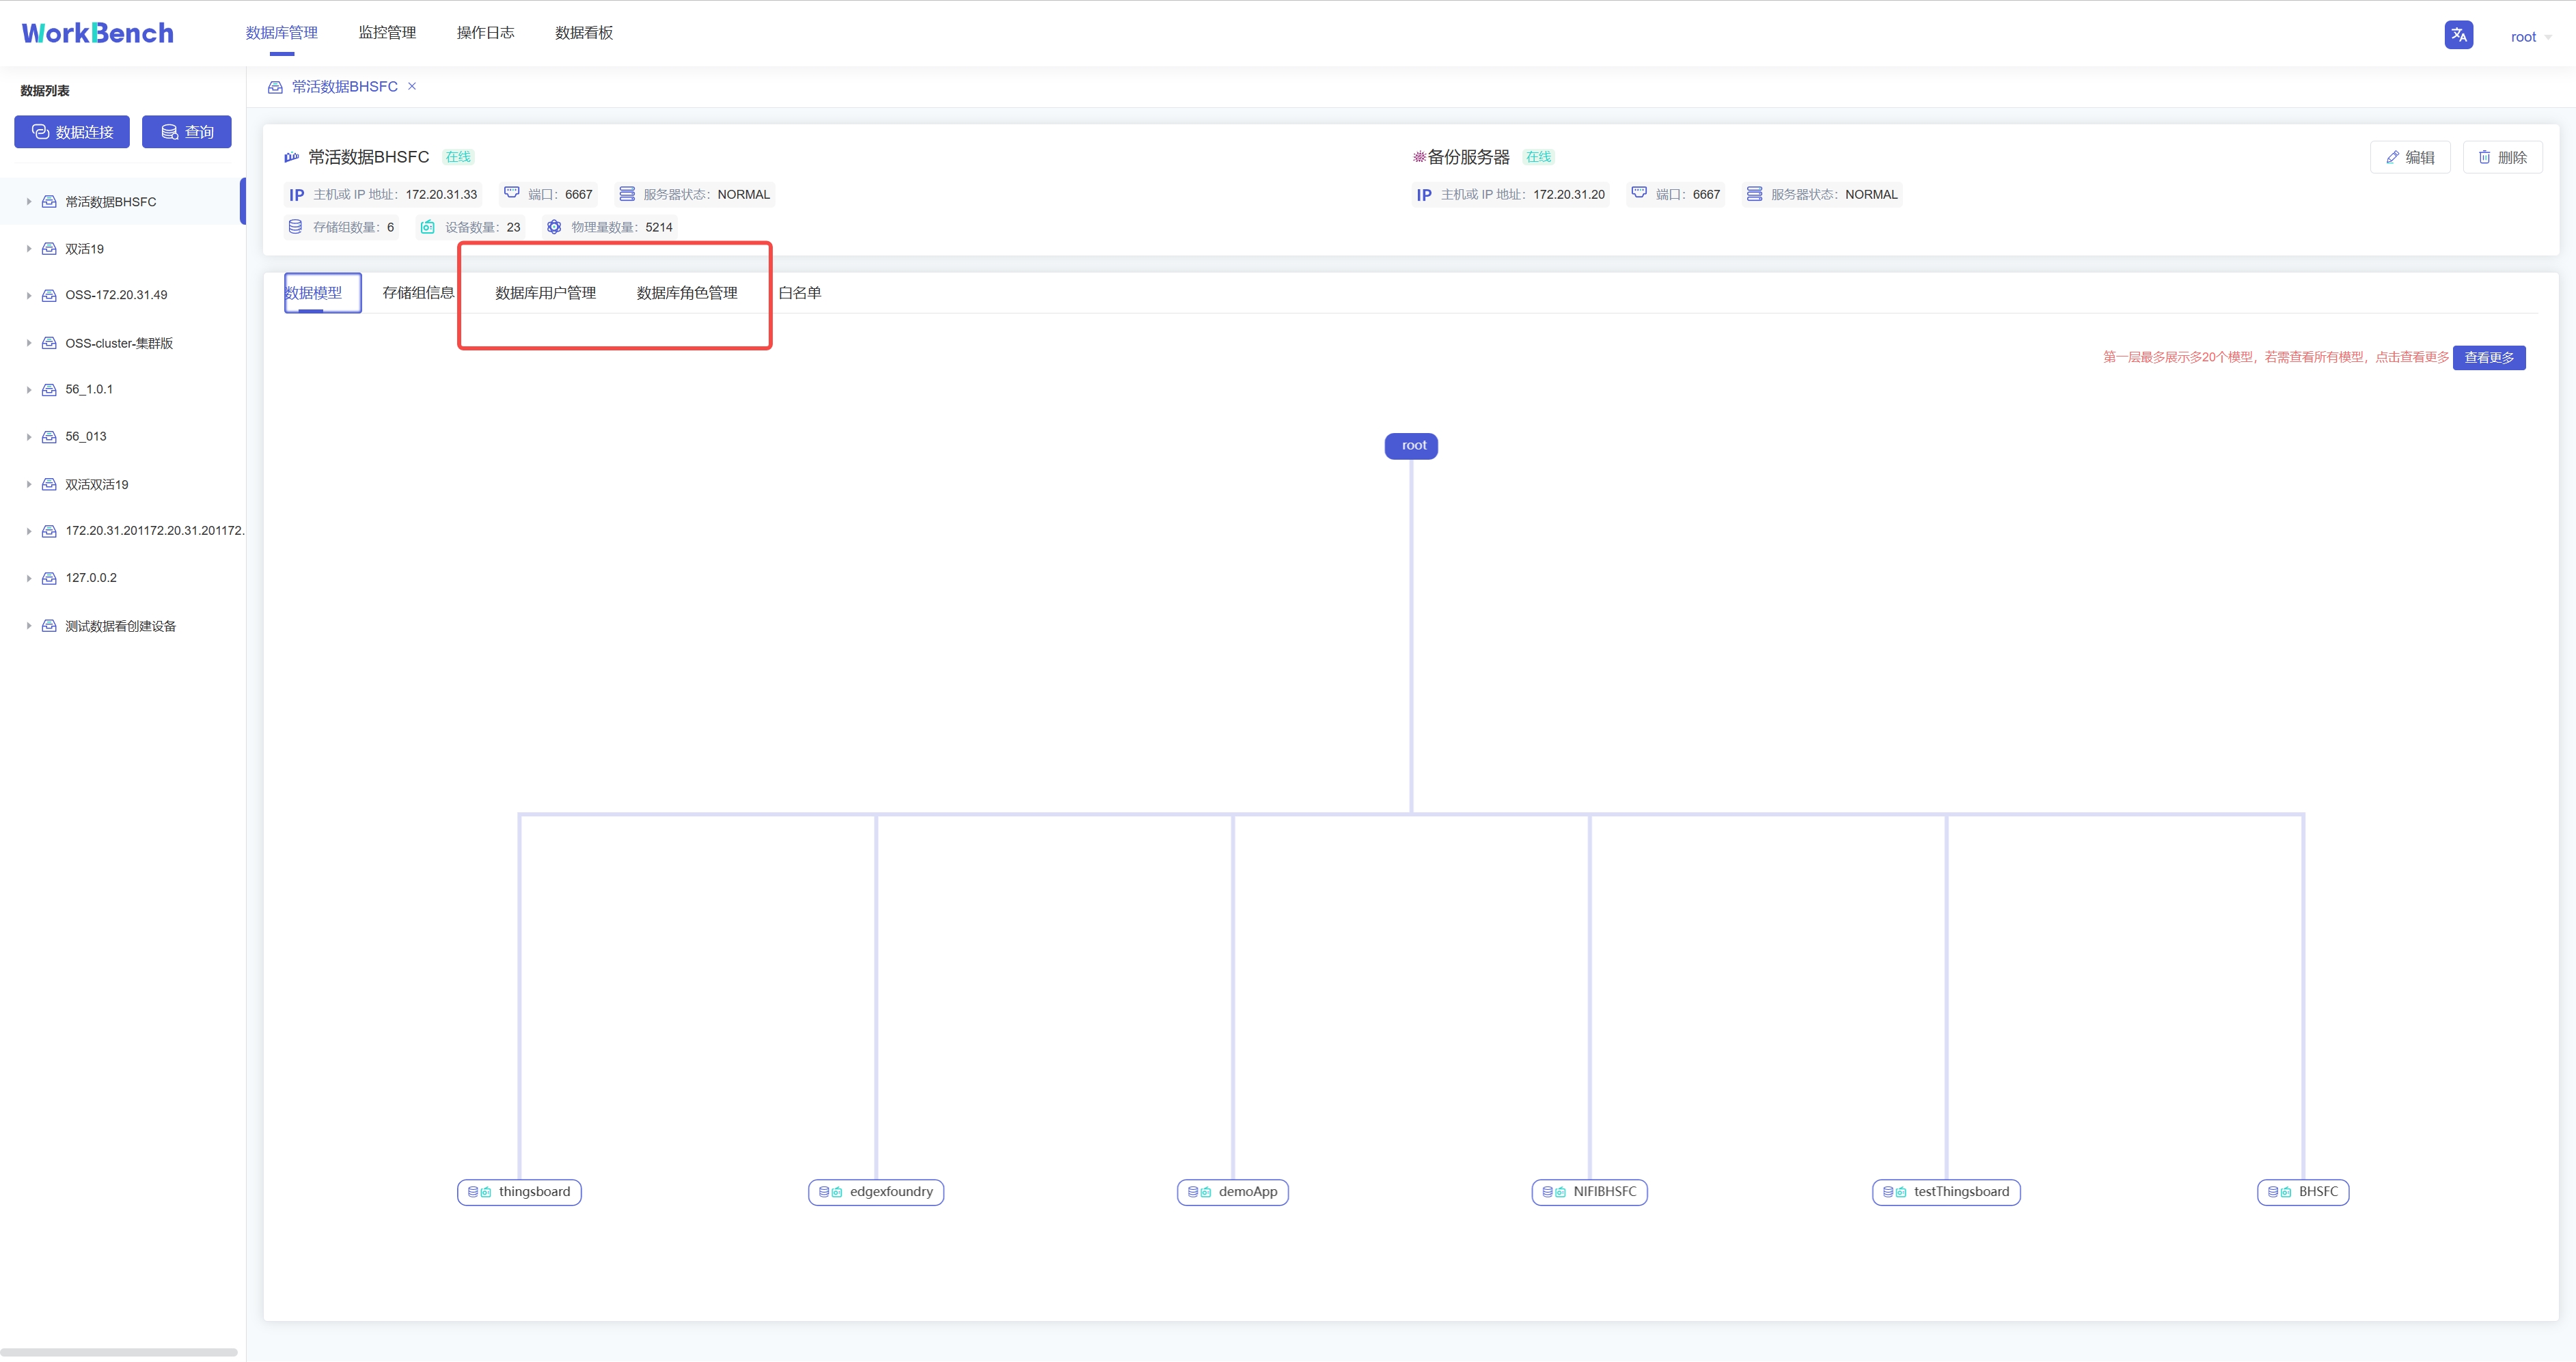
-Workbench提供强大的工具以管理服务器用户帐号和数据库对象的权限。在操作列中点击
-"**数据库用户管理**"或 "**数据库角色管理**"来打开用户或角色的对象列表。
+Workbench provides powerful tools to manage permissions on server user
accounts and database objects. Click "**Database User Management**" or
"**Database Role Management**" in the operation column to open the user or role
object list.
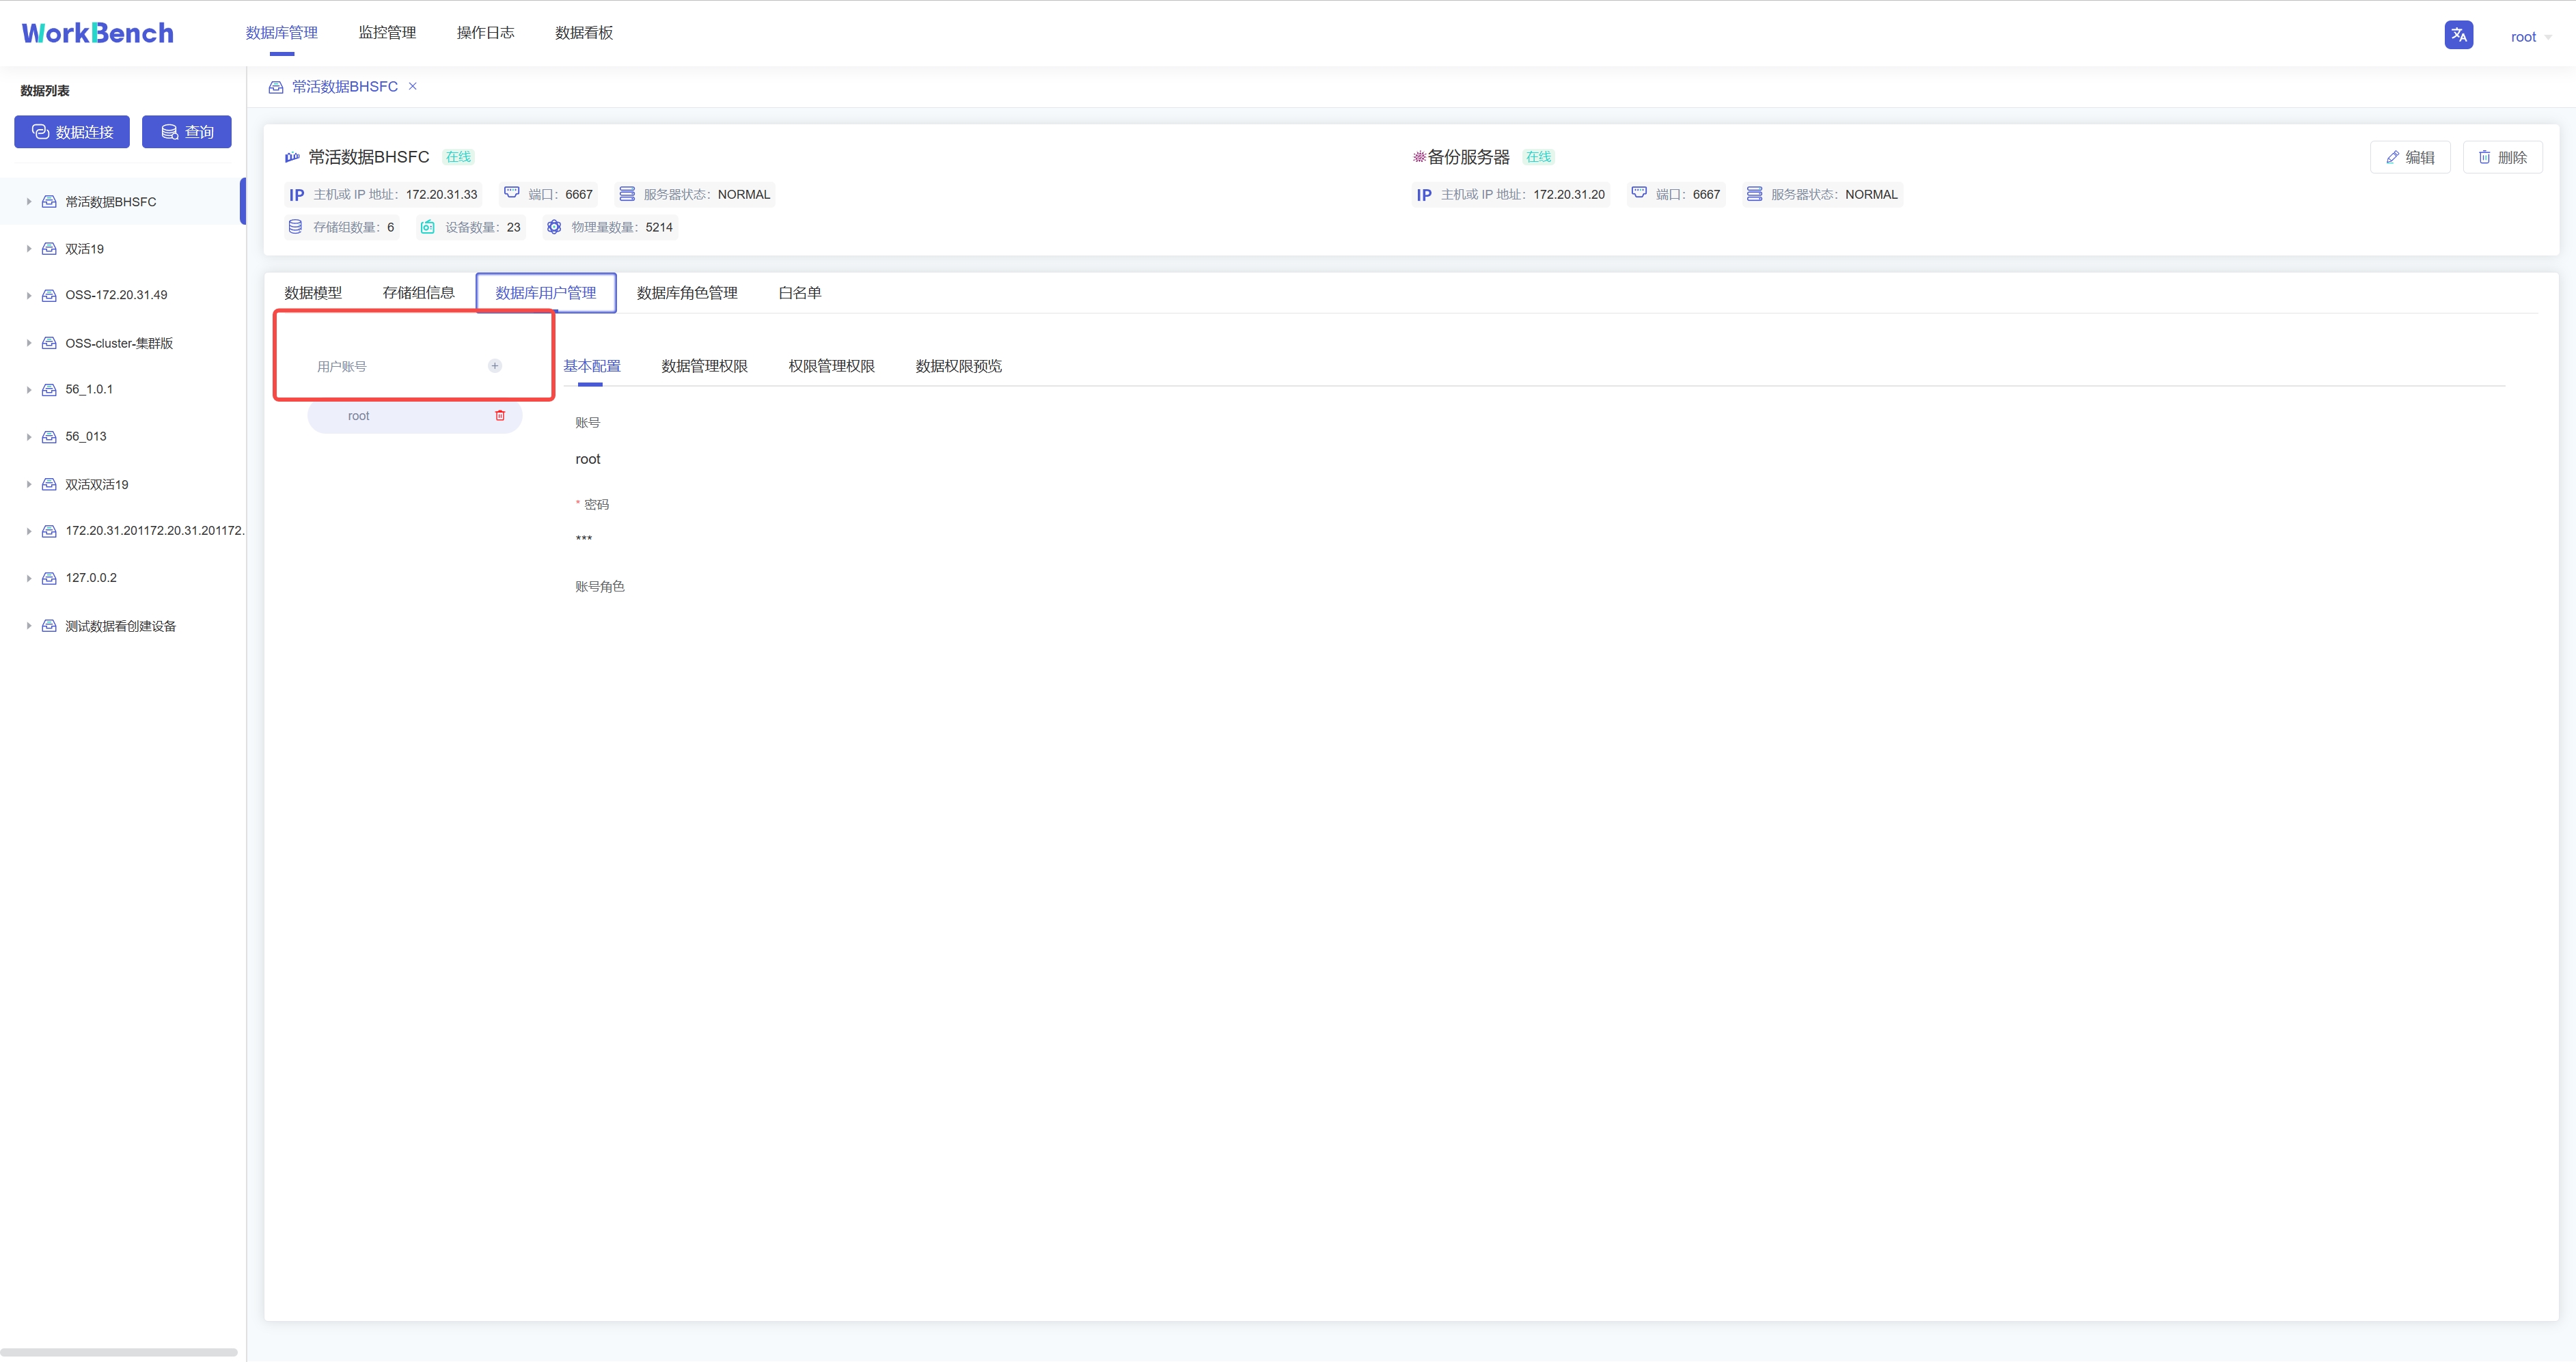
-**新增用户**。选择"**数据库用户管理**"-\>"**用户账号+**"可新增用户,按要求填写用户名和密码即可,可以为用户添加角色信息。
+**New users**. Select "**Database User Management**"-\>"**User Account+**" to
add a new user, fill in the user name and password as required, and add role
information for the user.
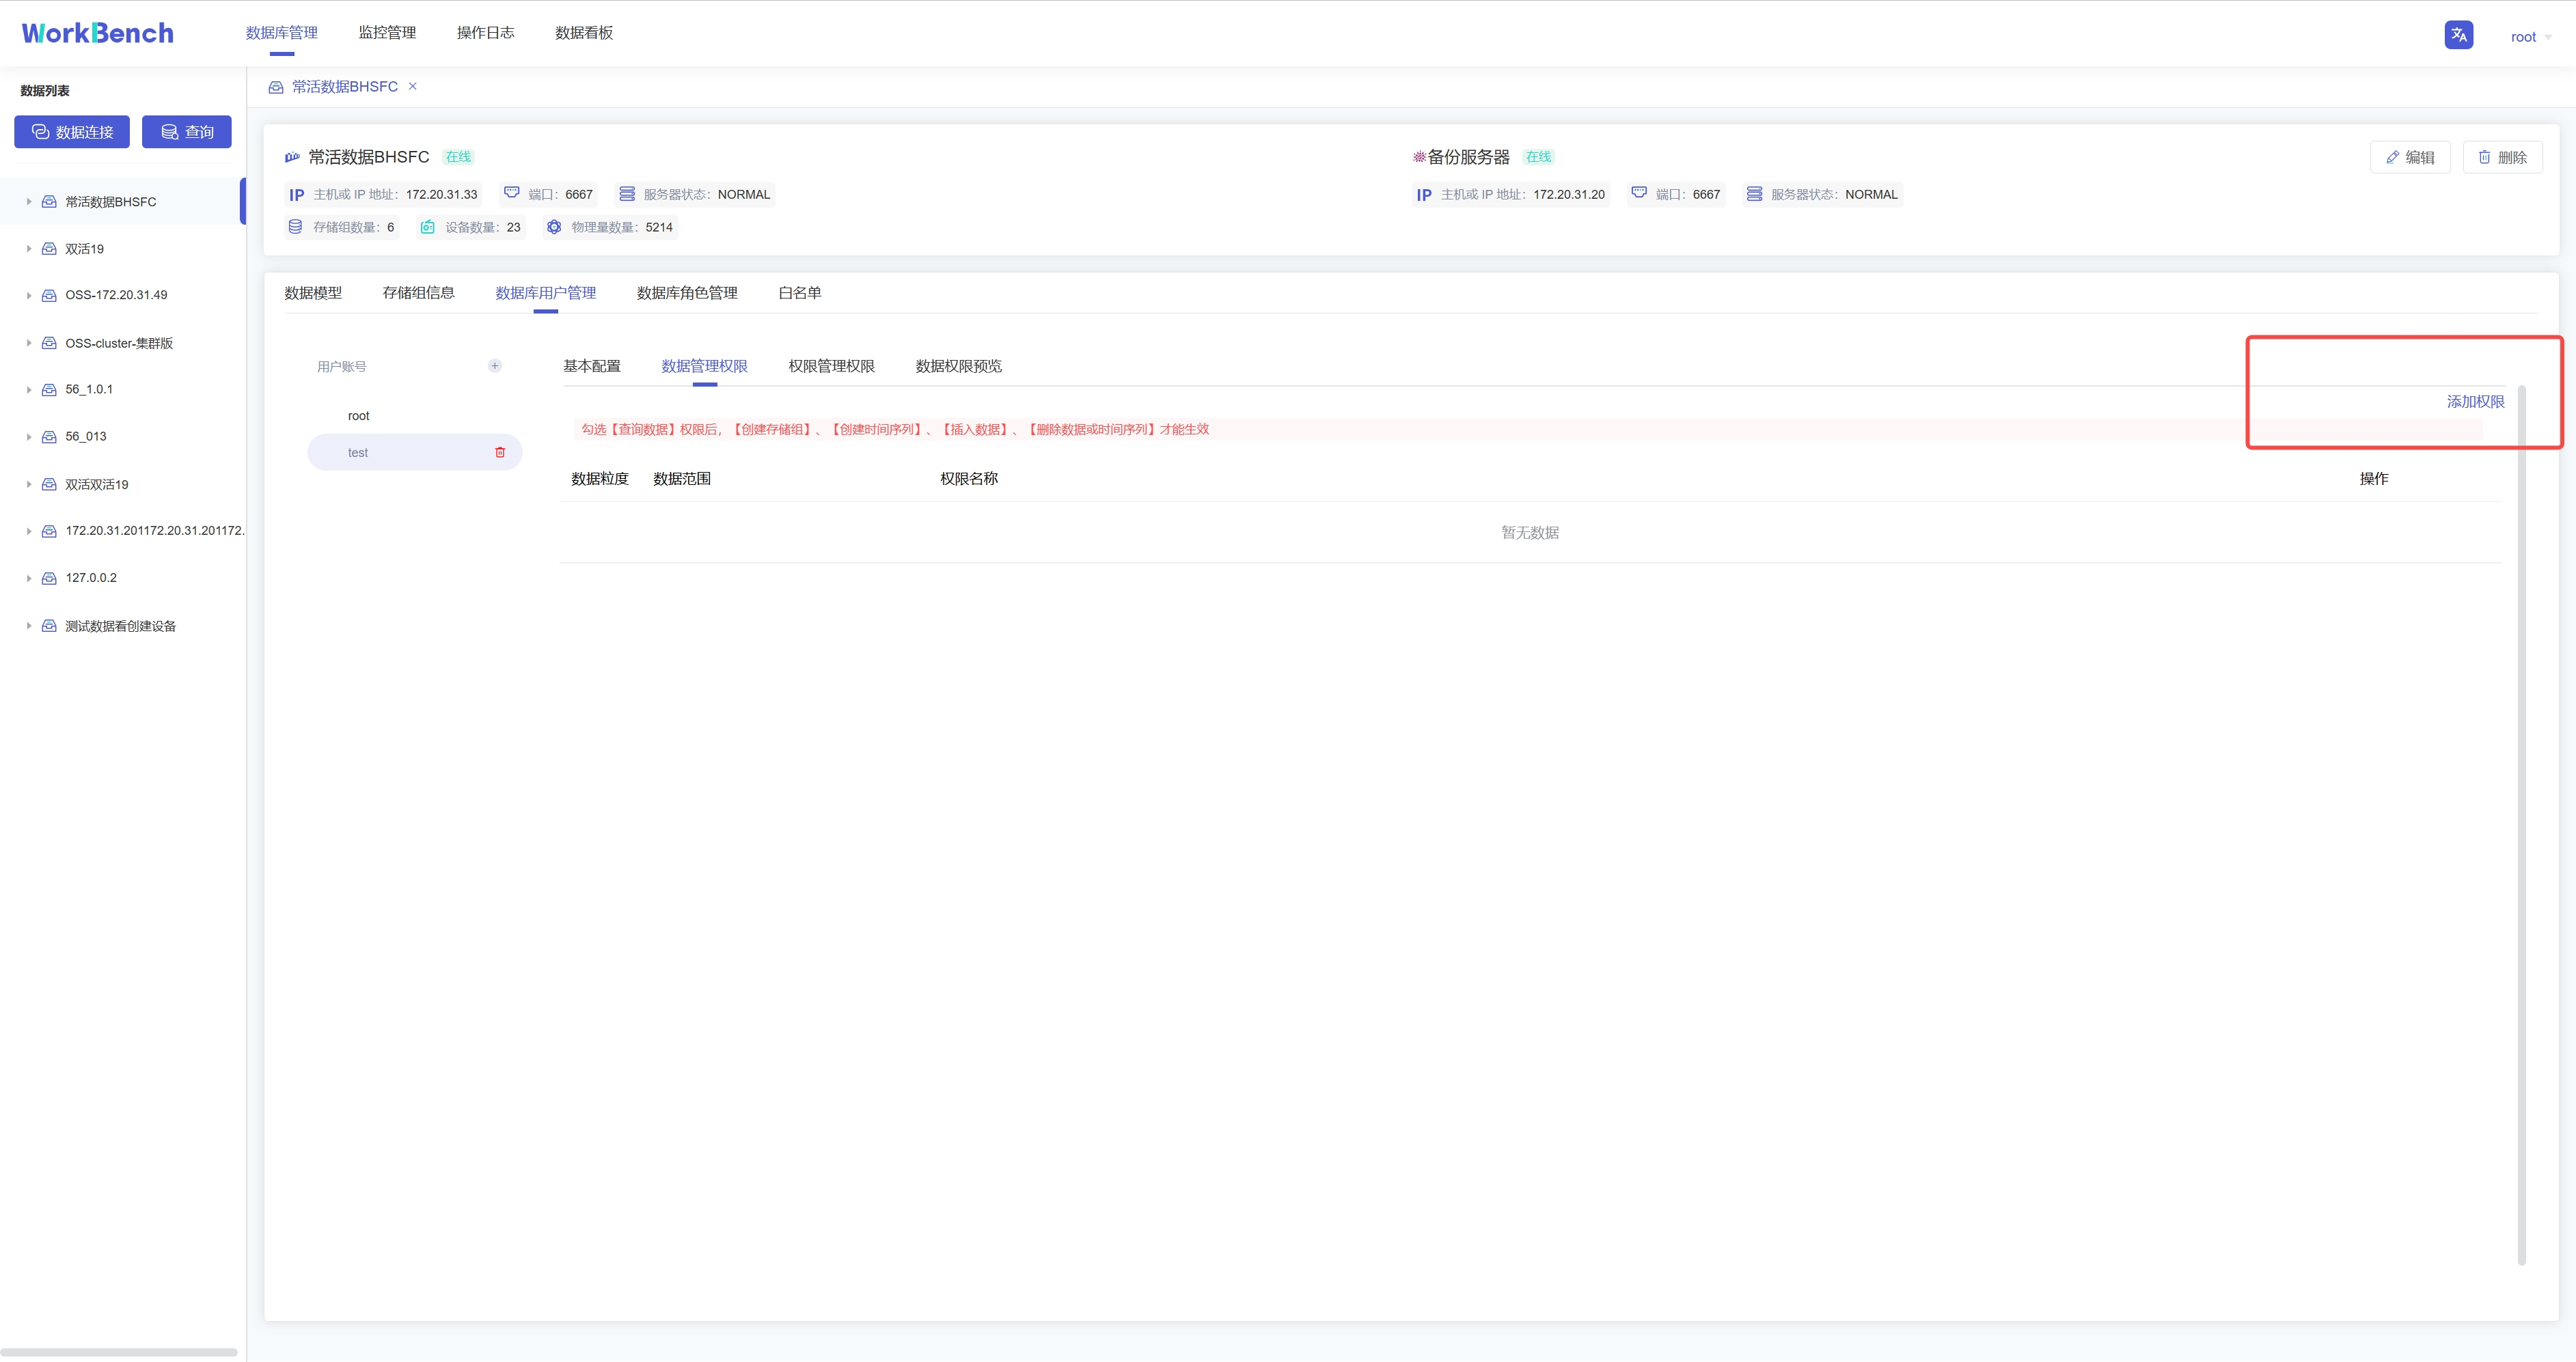
-**添加权限**。权限可分为数据管理权限(如对数据进行增删改查)以及权限管理权限(用户、角色的创建与删除,权限的赋予与撤销等)。选择"**数据库用户管理**"-\>"**数据管理权限**"-\>"**添加权限**"可为用户添加数据管理权限。在已添加的权限处可以选择"**编辑**"或"**删除**"以修改权限信息。
+Permissions can be divided into data management permissions (such as adding,
deleting, modifying and querying data) and permission management permissions
(creating and deleting users and roles, granting and revoking permissions,
etc.). Select "**Database User Management**"-\>"**Data Management
Permission**"-\>"**Add Permission**" to add data management permission to the
user. You can select "**Edit**" or "**Delete**" at the added permission to
modify the permission information.
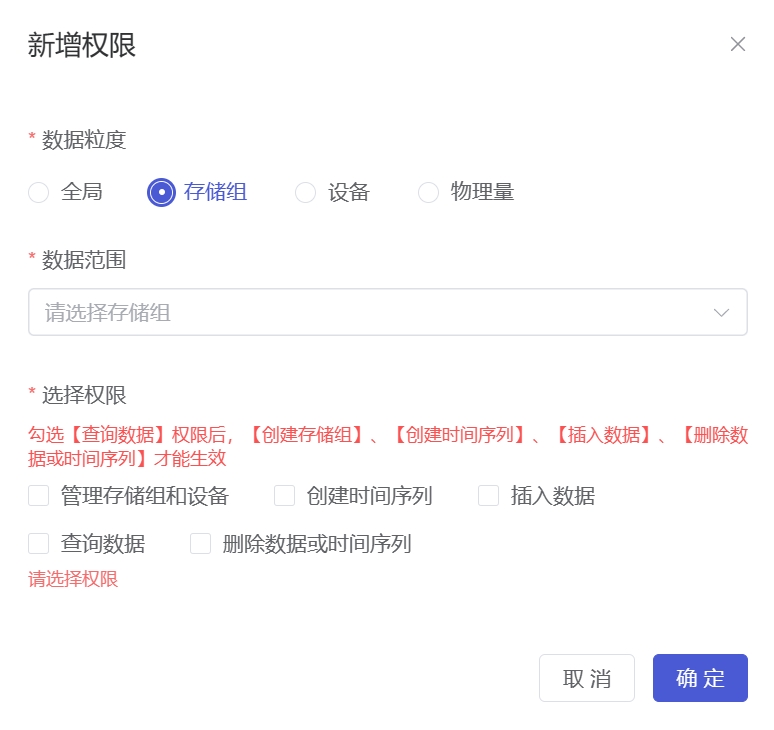
-弹出的界面可以选择权限作用的粒度以及具体权限内容。注意只有勾选【查询数据】权限和【查看用户】权限,其他权限才能在Workbench中生效查看。
+In the pop-up interface, you can choose the granularity of permission function
and specific permission content. Note that only when the [Query Data]
permission and [View User] permission are checked, other permissions can be
viewed in Workbench.
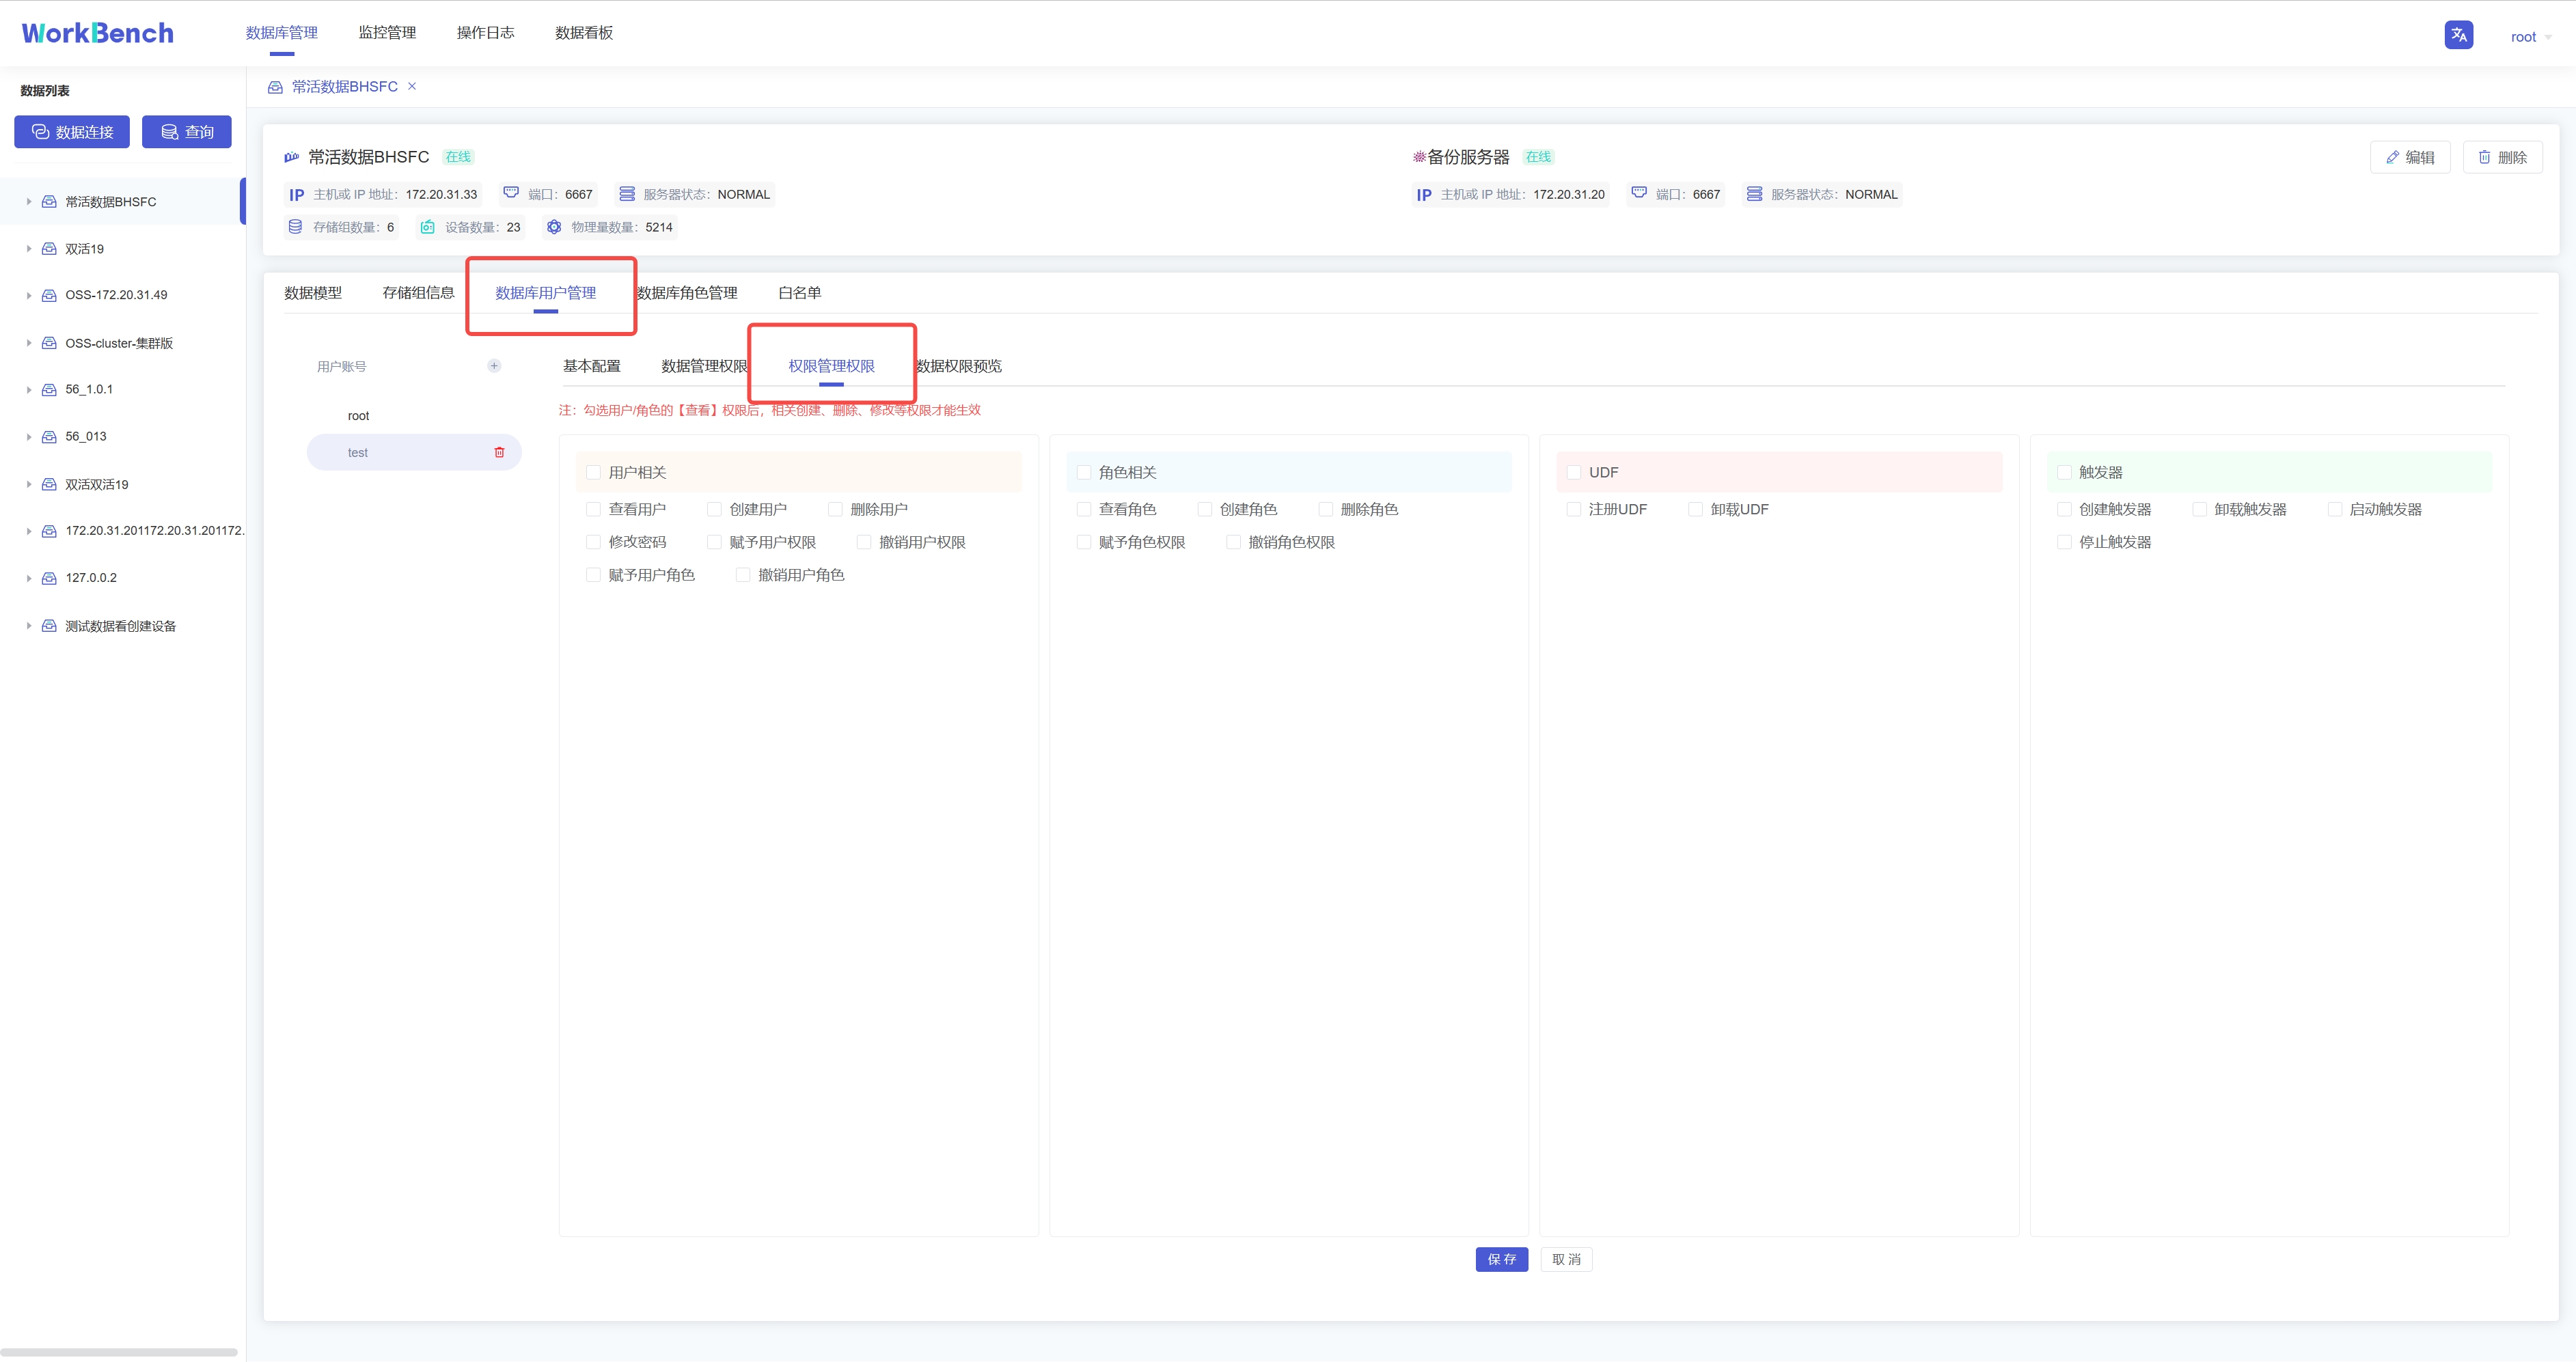
-选择"**数据库用户管理**"-\>"**权限管理权限**"勾选信息窗格中具体的权限信息,点击"保存"可为用户添加权限管理权限。
+Select "**Database User Management**"-\>"**Authority Management Authority**"
to check the specific authority information in the information pane, and click
"Save" to add authority management authority to the user.
-**权限预览**。选择"**数据库用户管理**"-\>"**数据权限预览**"可预览该用户名下所有的数据权限。注:该功能仅支持企业版。
+**Permission Preview**. Select "**Database User Management**"-\>"**Data
Permission Preview**" to preview all data permissions under the user name.
Note: This feature is only supported in Enterprise Edition.
-## 数据迁移
+## Data Migration
-导入导出工具可将CSV格式的文件批量导入或导出IoTDB。
+The import and export tool can import or export files in CSV format to IoTDB
in batches.
-**批量导入**
+### Batch Import
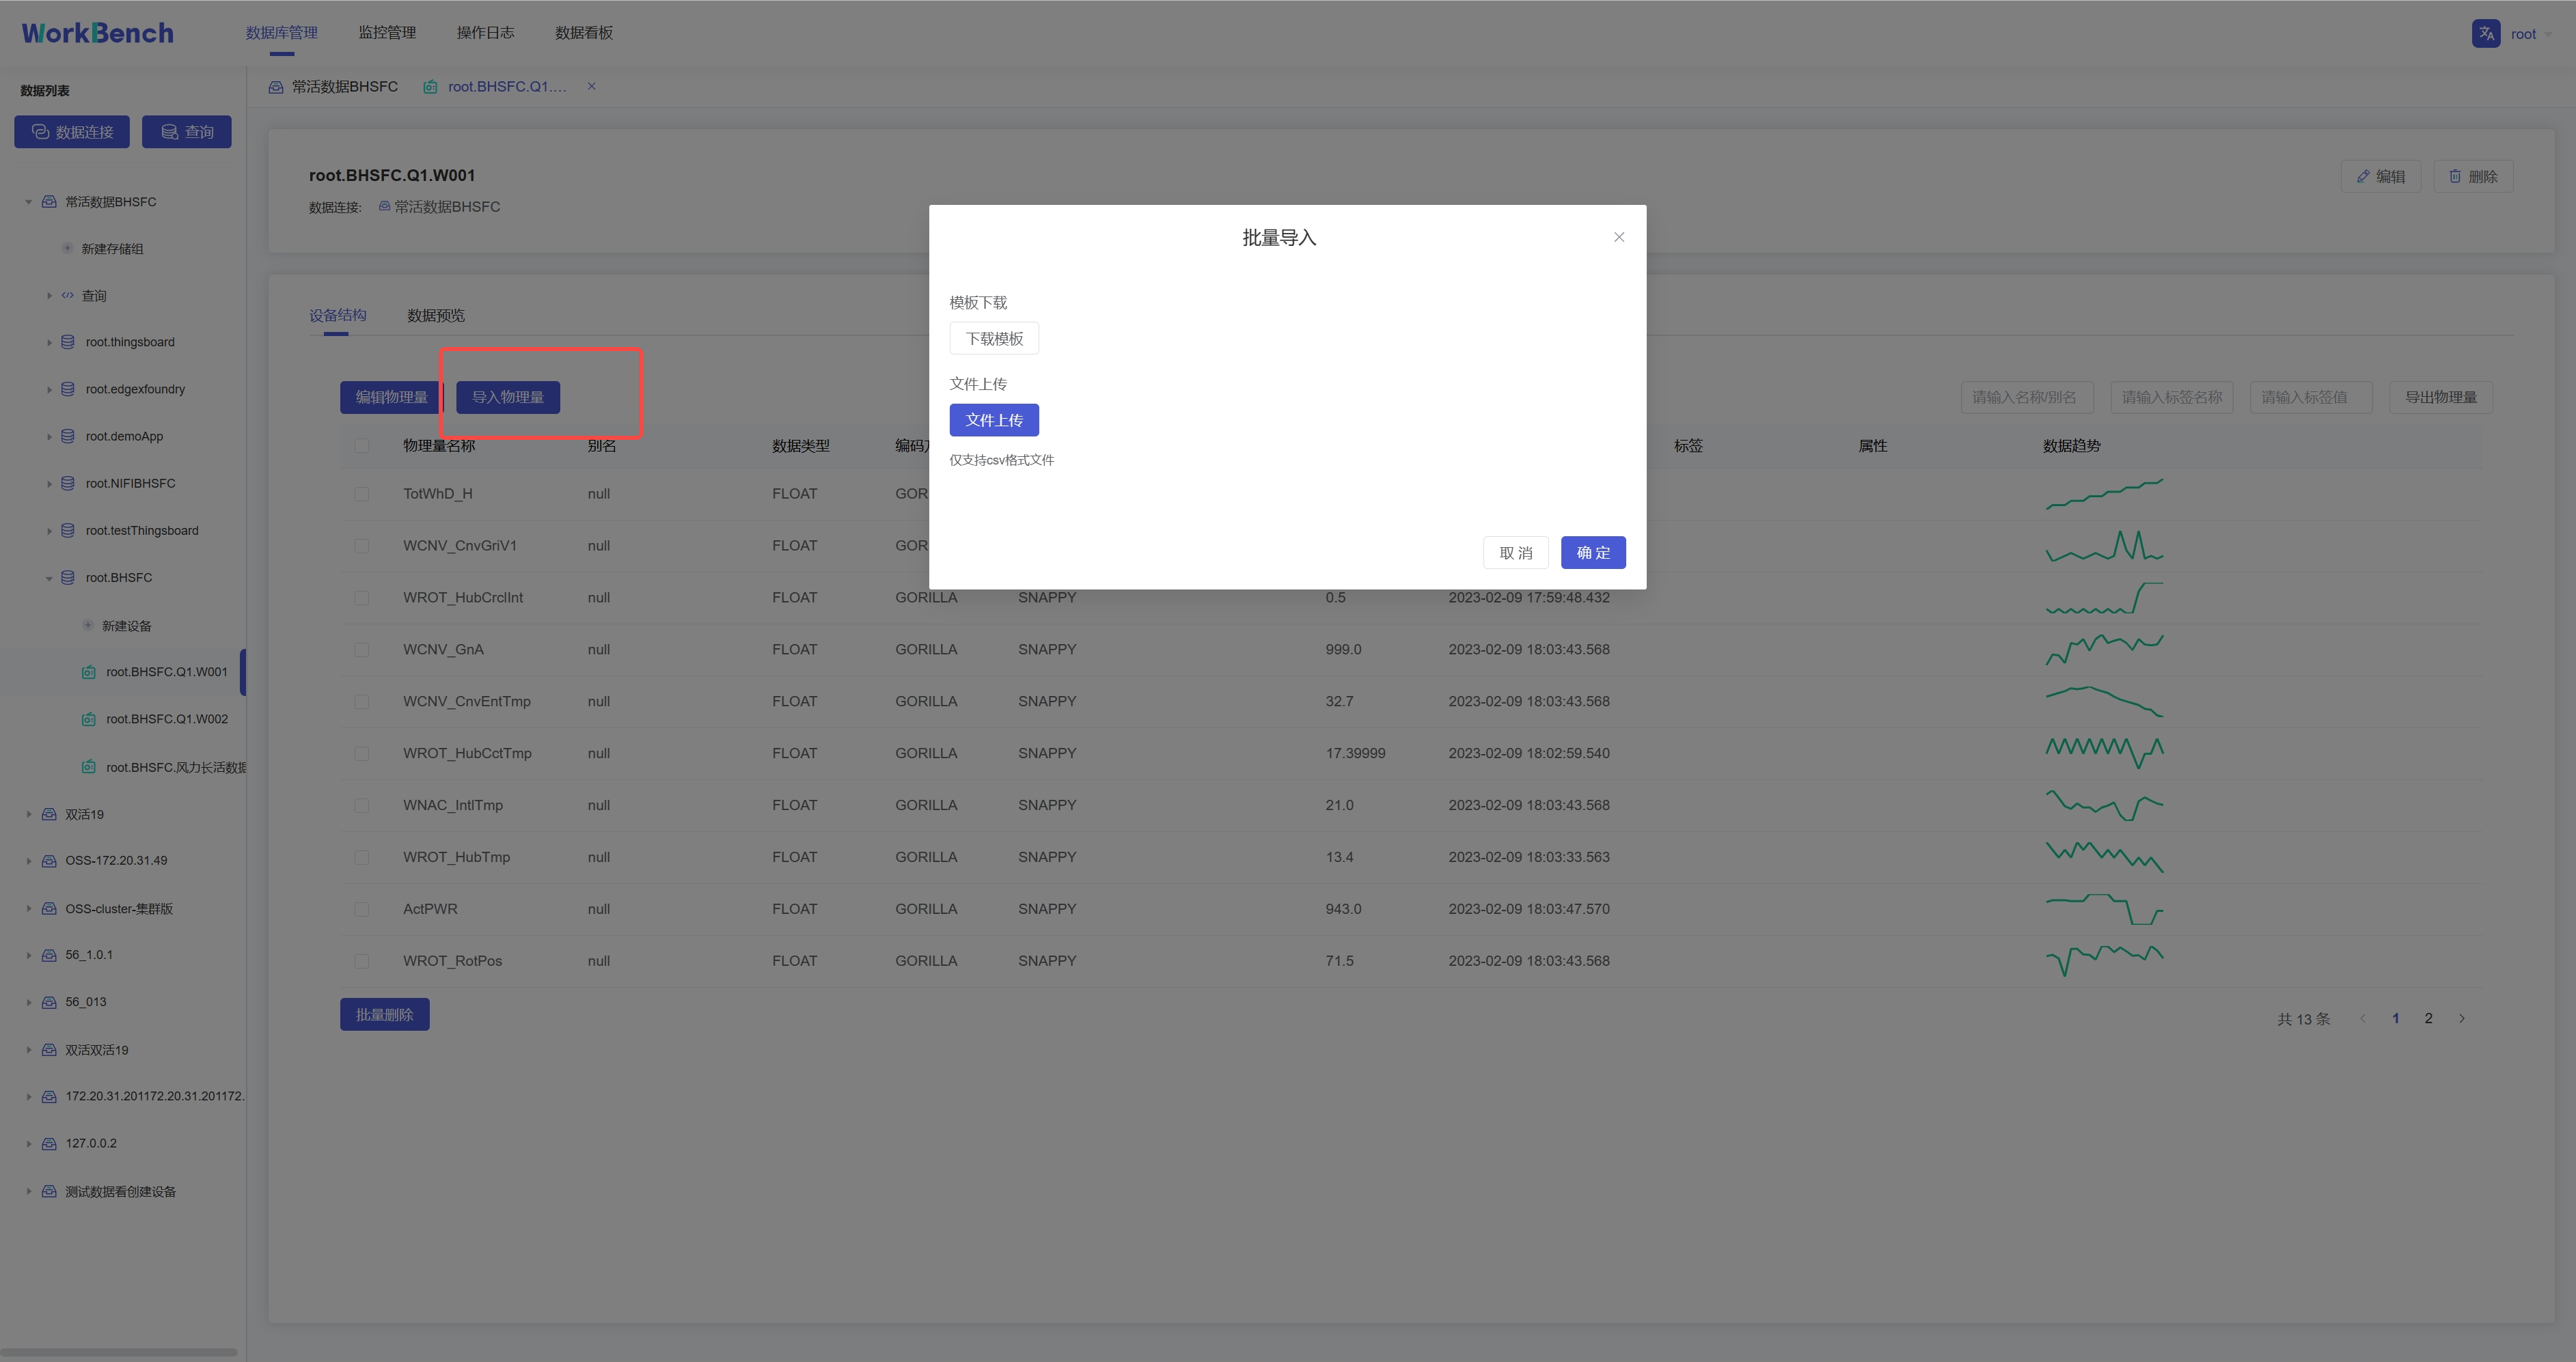
-批量导入功能仅在企业版中支持。在对象窗格中选择要操作的数据库,选择到设备节点,则右侧信息窗格将出现"**设备结构"**信息,点击"**导入物理量**",下载模板填写物理量信息,再上传该CSV文件即可批量导入物理量。注:当前版本不支持导入对齐物理量。
+The batch import feature is only supported in the Enterprise Edition. Select
the database to be operated in the object pane, select the device node, and the
information "**Device Structure"** will appear in the information pane on the
right. Click "**Import Physical Quantity**" to download the template and fill
in the physical quantity information. Then upload the CSV file to import
physical quantities in batches. Note: The current version does not support the
import of alignment physica [...]
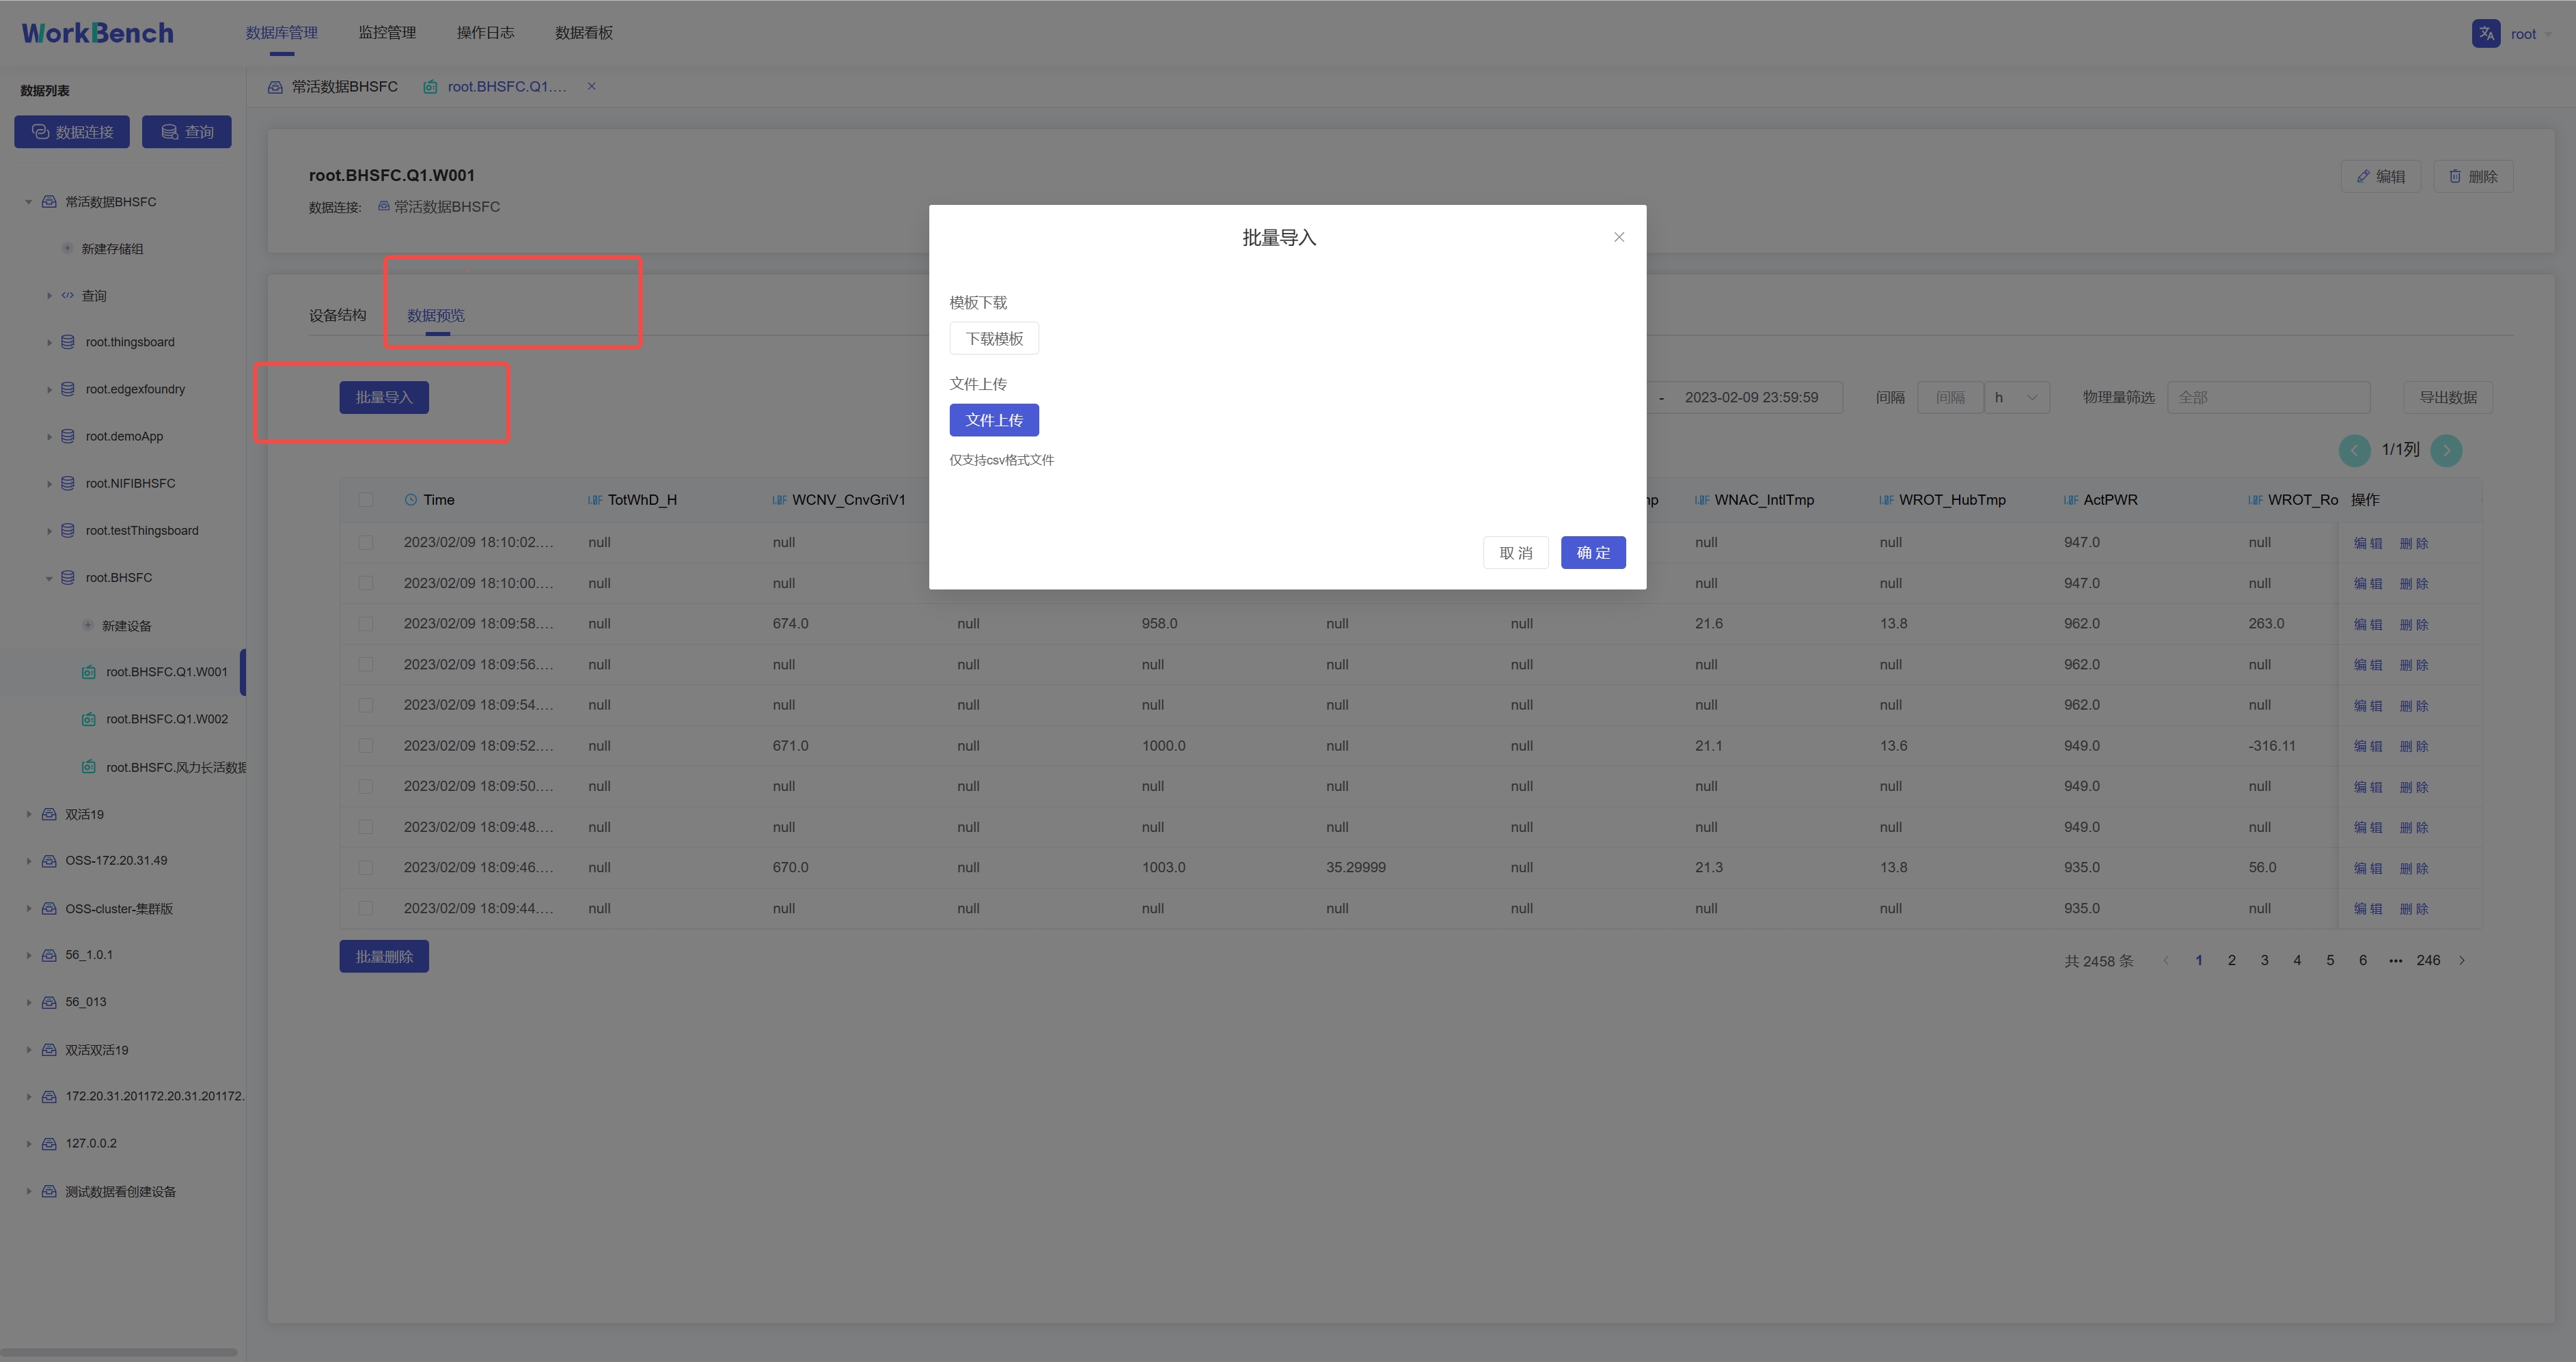
-选择"**数据预览**"-\>"**批量导入**"则可将符合模板要求的CSV文件数据导入,当前支持导入对齐时间序列。
+Select "**Data Preview**"->"**Batch Import**" to import CSV file data that
meets the requirements of the template. Currently, it supports importing
aligned time series.
-**批量导出**
+### Batch Export
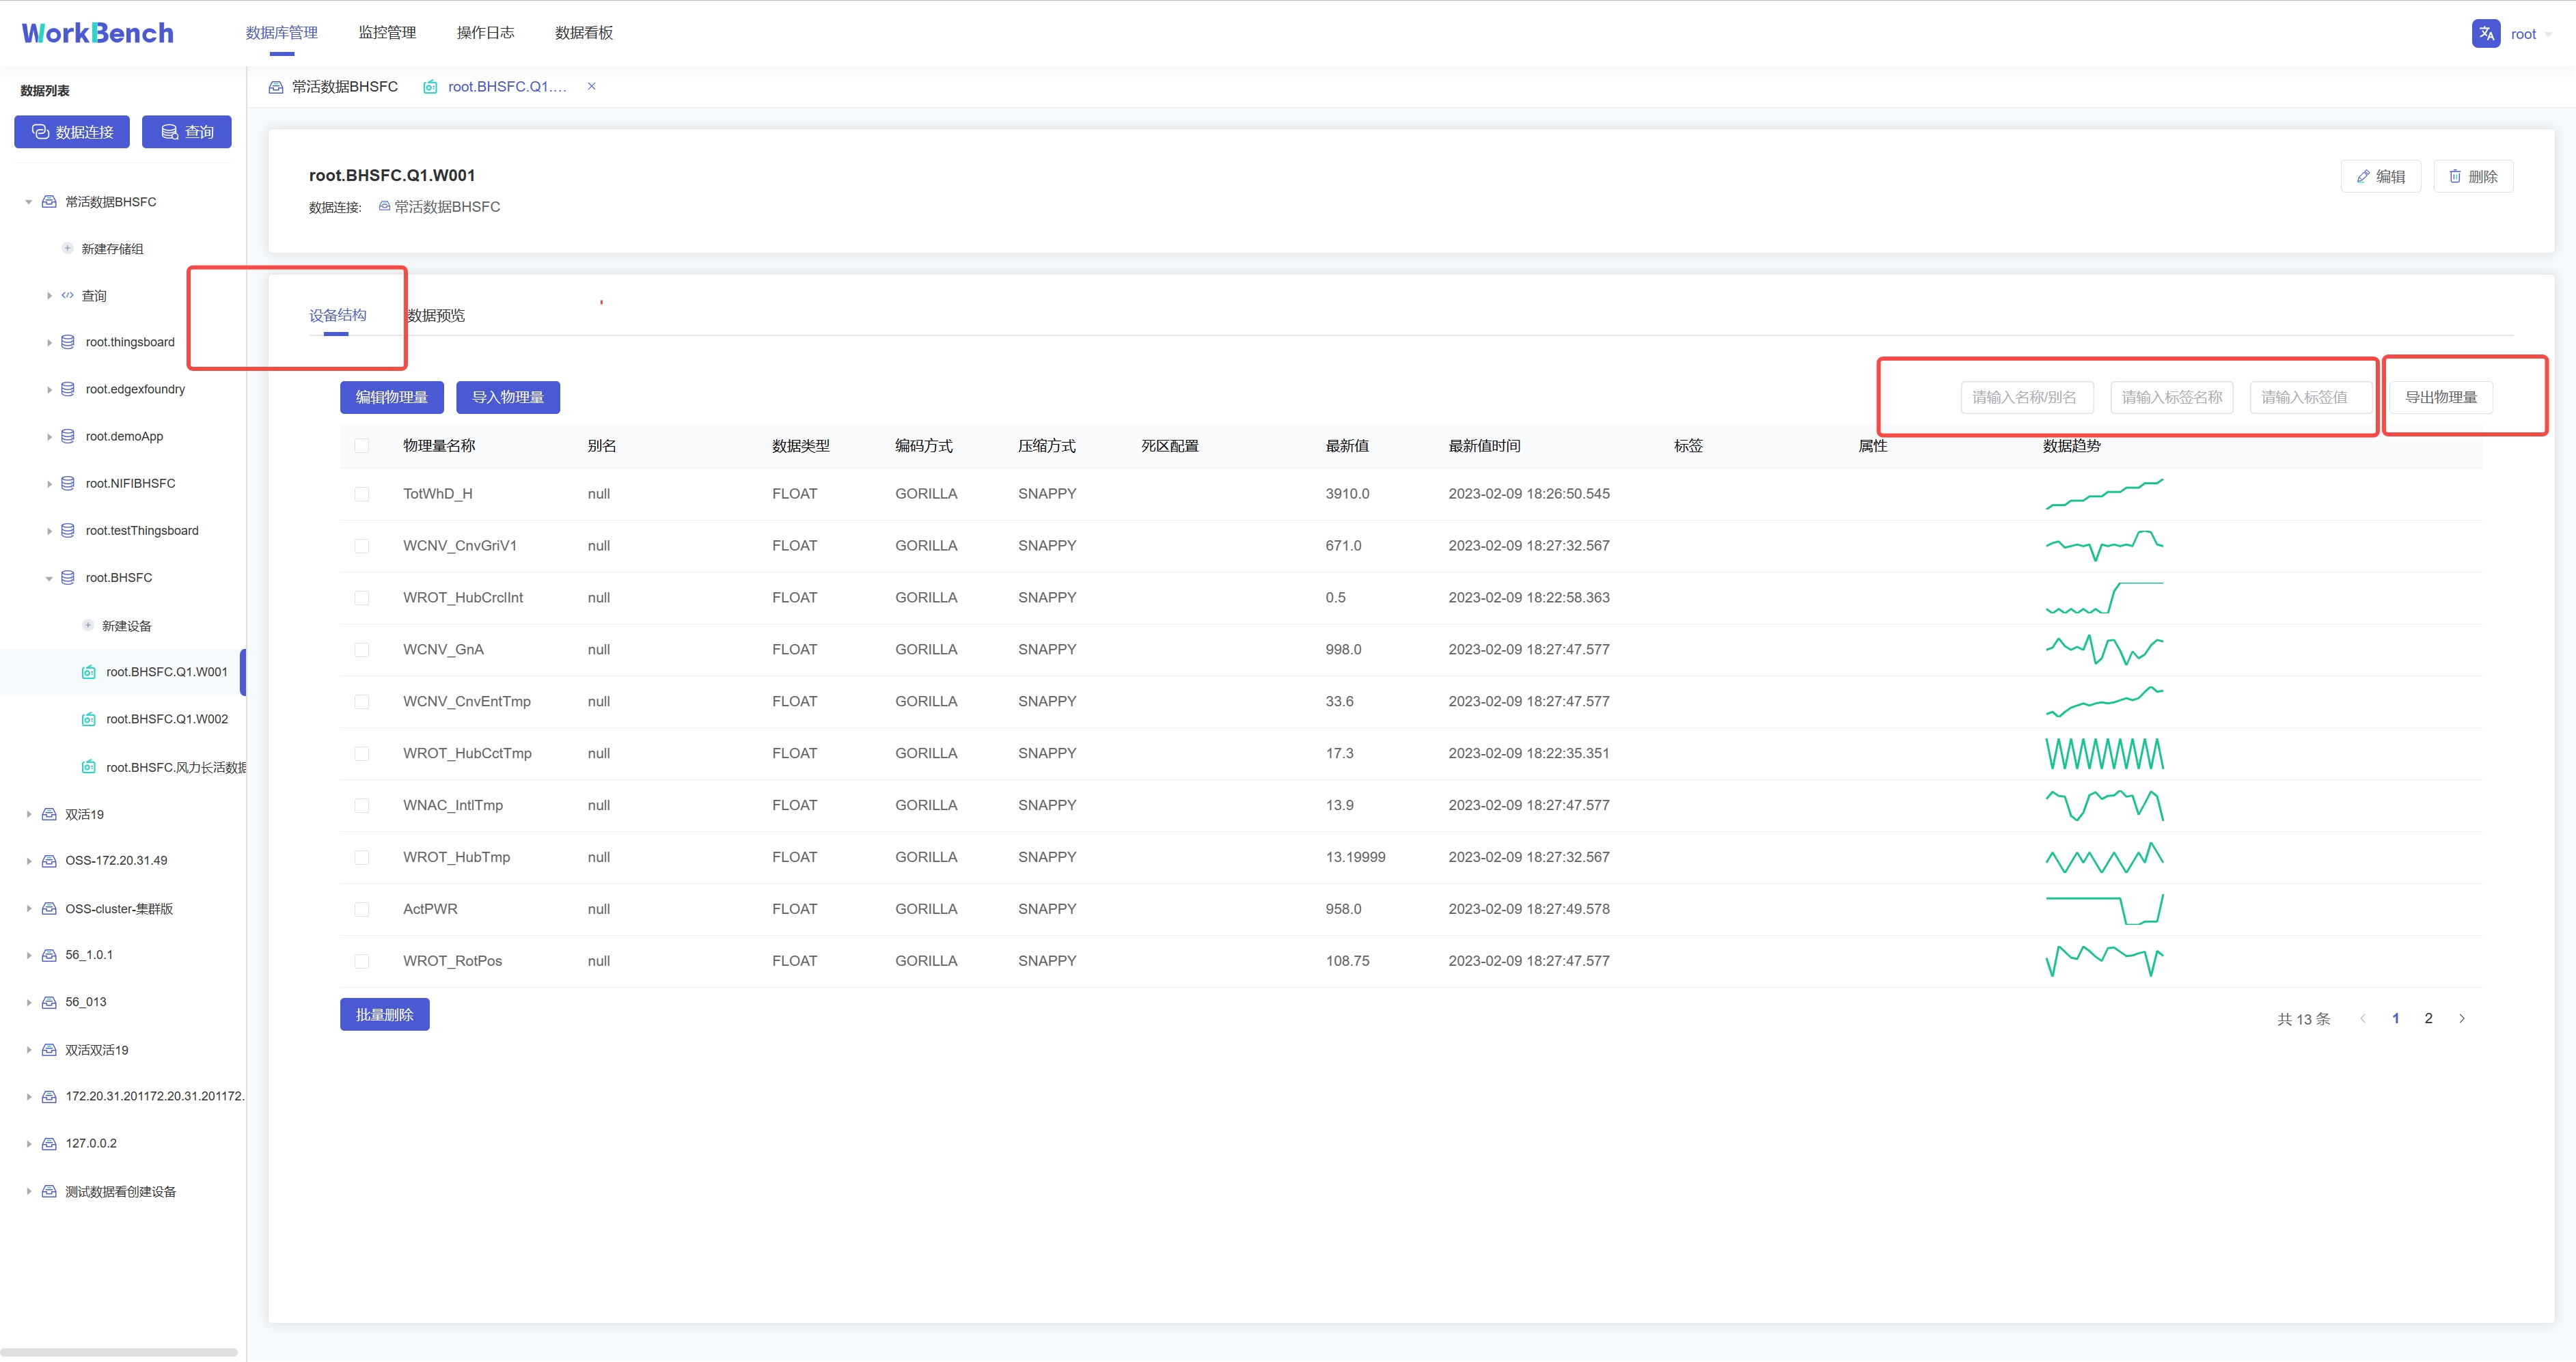
-批量导出功能仅在企业版中支持。在对象窗格中选择要操作的数据库,进入设备节点,选择"**设备结构**"-\>"**导出物理量**"即可批量导出该实体下的物理量元数据。搜索框内可输入名称/别名、标签名称、标签值进行过滤。
+The batch export function is only supported in the Enterprise Edition. Select
the database to be operated in the object pane, enter the device node, and
select "**Device Structure**"-\>"**Export Physical Quantity**" to batch export
the physical quantity metadata under the entity. In the search box, you can
enter name/alias, tag name, and tag value to filter.
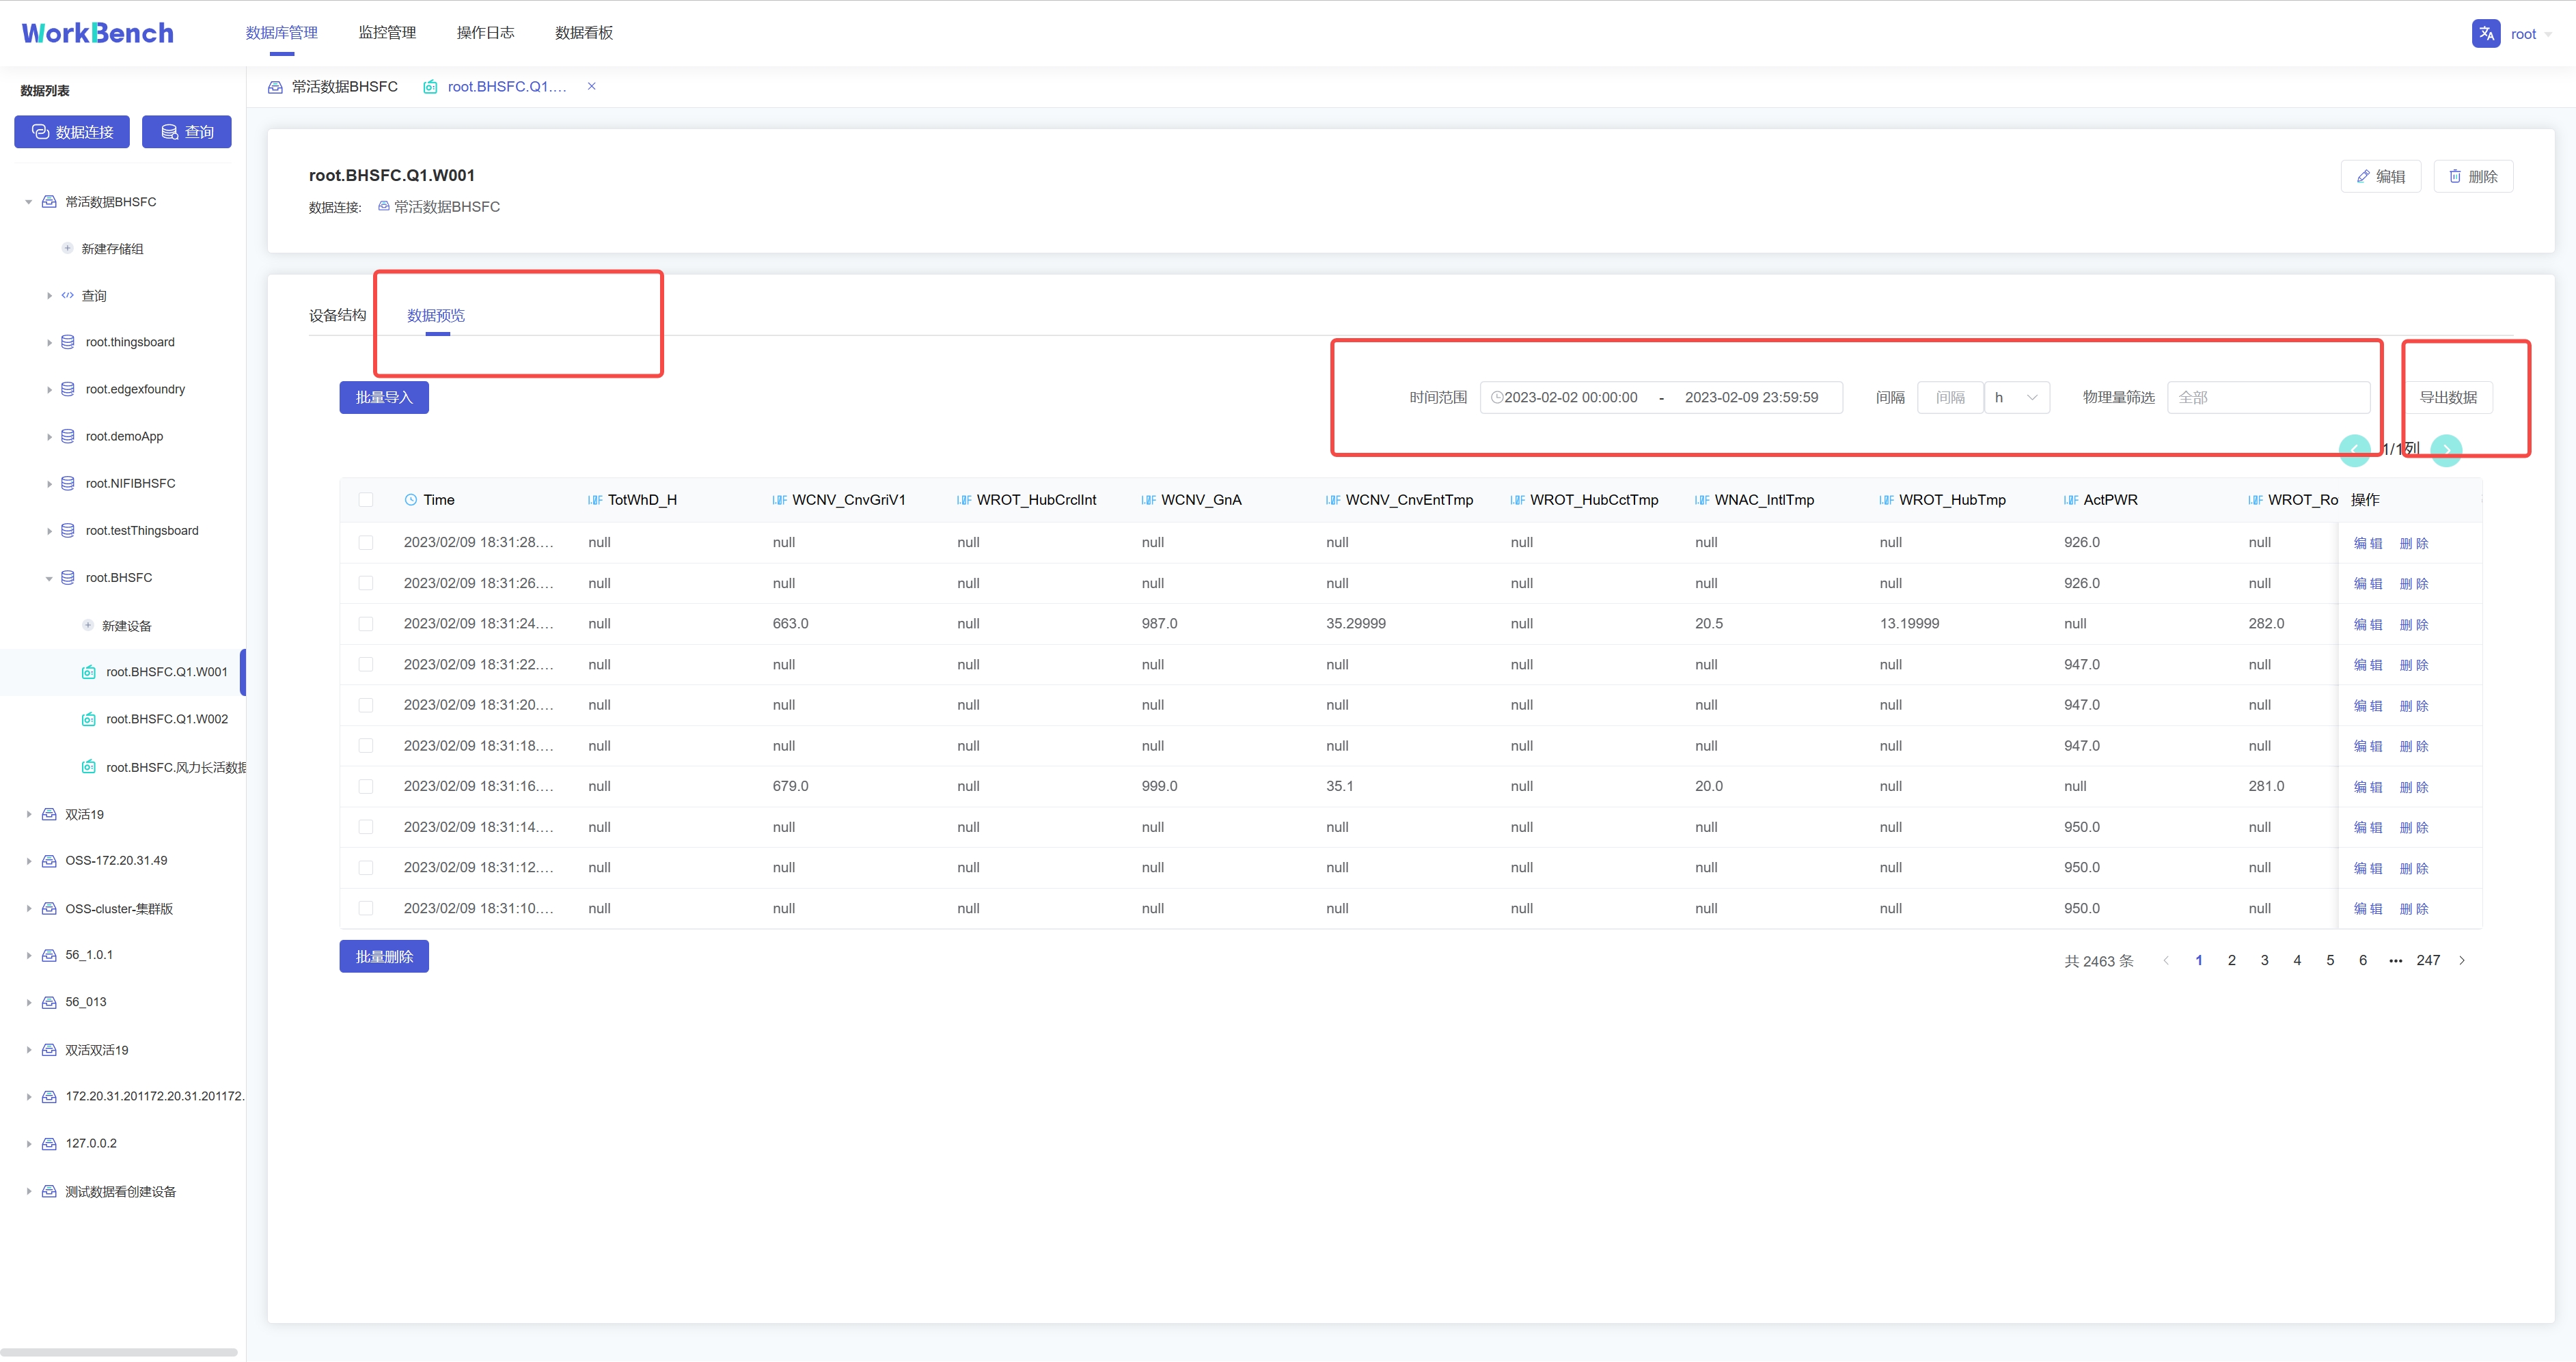
-选择"**数据预览**"-\>"**导出数据**"则可批量导出该实体下的数据。搜索框内可按时间范围、时间间隔和物理量进行过滤。
+Select "**Data Preview**"->"**Export Data**" to export the data under this
entity in batches. The search box can be filtered by time range, time interval
and physical quantity.
-## 数据预览
+## Data Preview
-Workbench提供多层次的数据预览工具。
+Workbench provides multi-level data preview tools.
-**数据模型**
+### Data Model
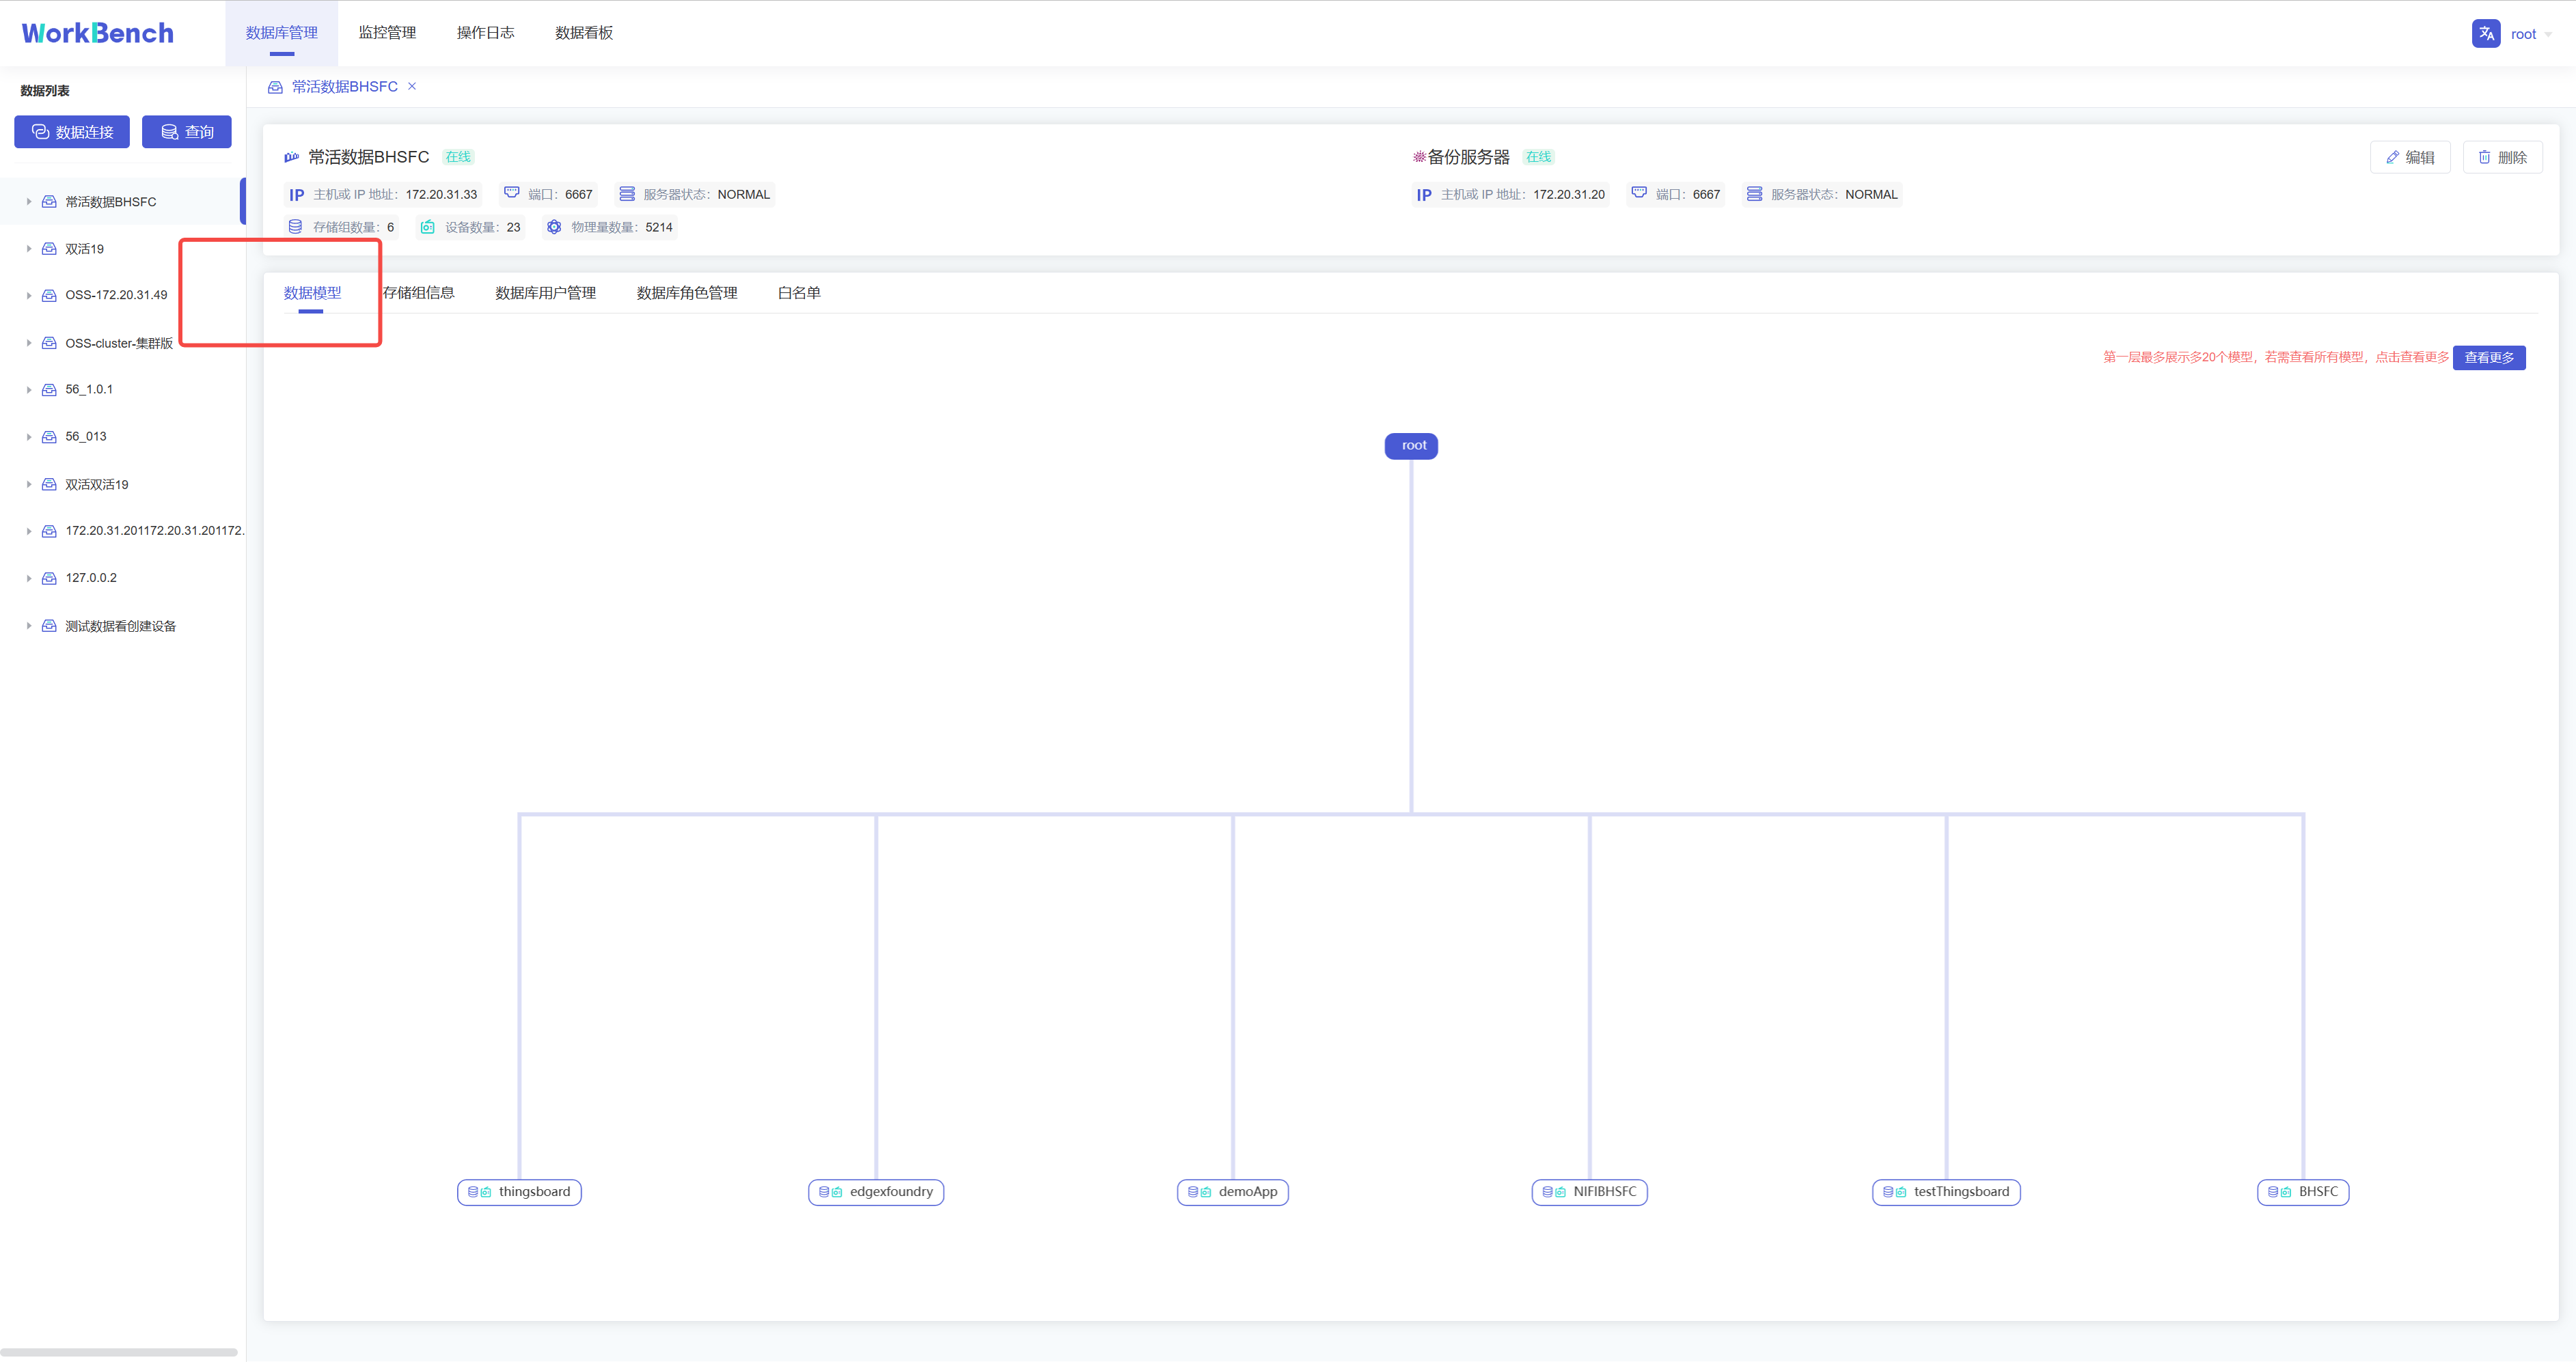
-在对象窗格中选择要预览的数据连接,点击操作列的"**数据模型**"即可预览数据模型,root被定义为LEVEL=0,Workbench中默认显示到LEVEL=1,点击"**查看更多**"可查看更多层级的数据模型信息。"**查看更多**"功能仅在企业版中支持。
+Select the data connection to be previewed in the object pane, click "**Data
Model**" in the operation column to preview the data model, the root is defined
as LEVEL=0, the default display in Workbench is LEVEL=1, click "**View More**"
to view more levels of data model information. The "**View More**" feature is
only supported in the Enterprise Edition.
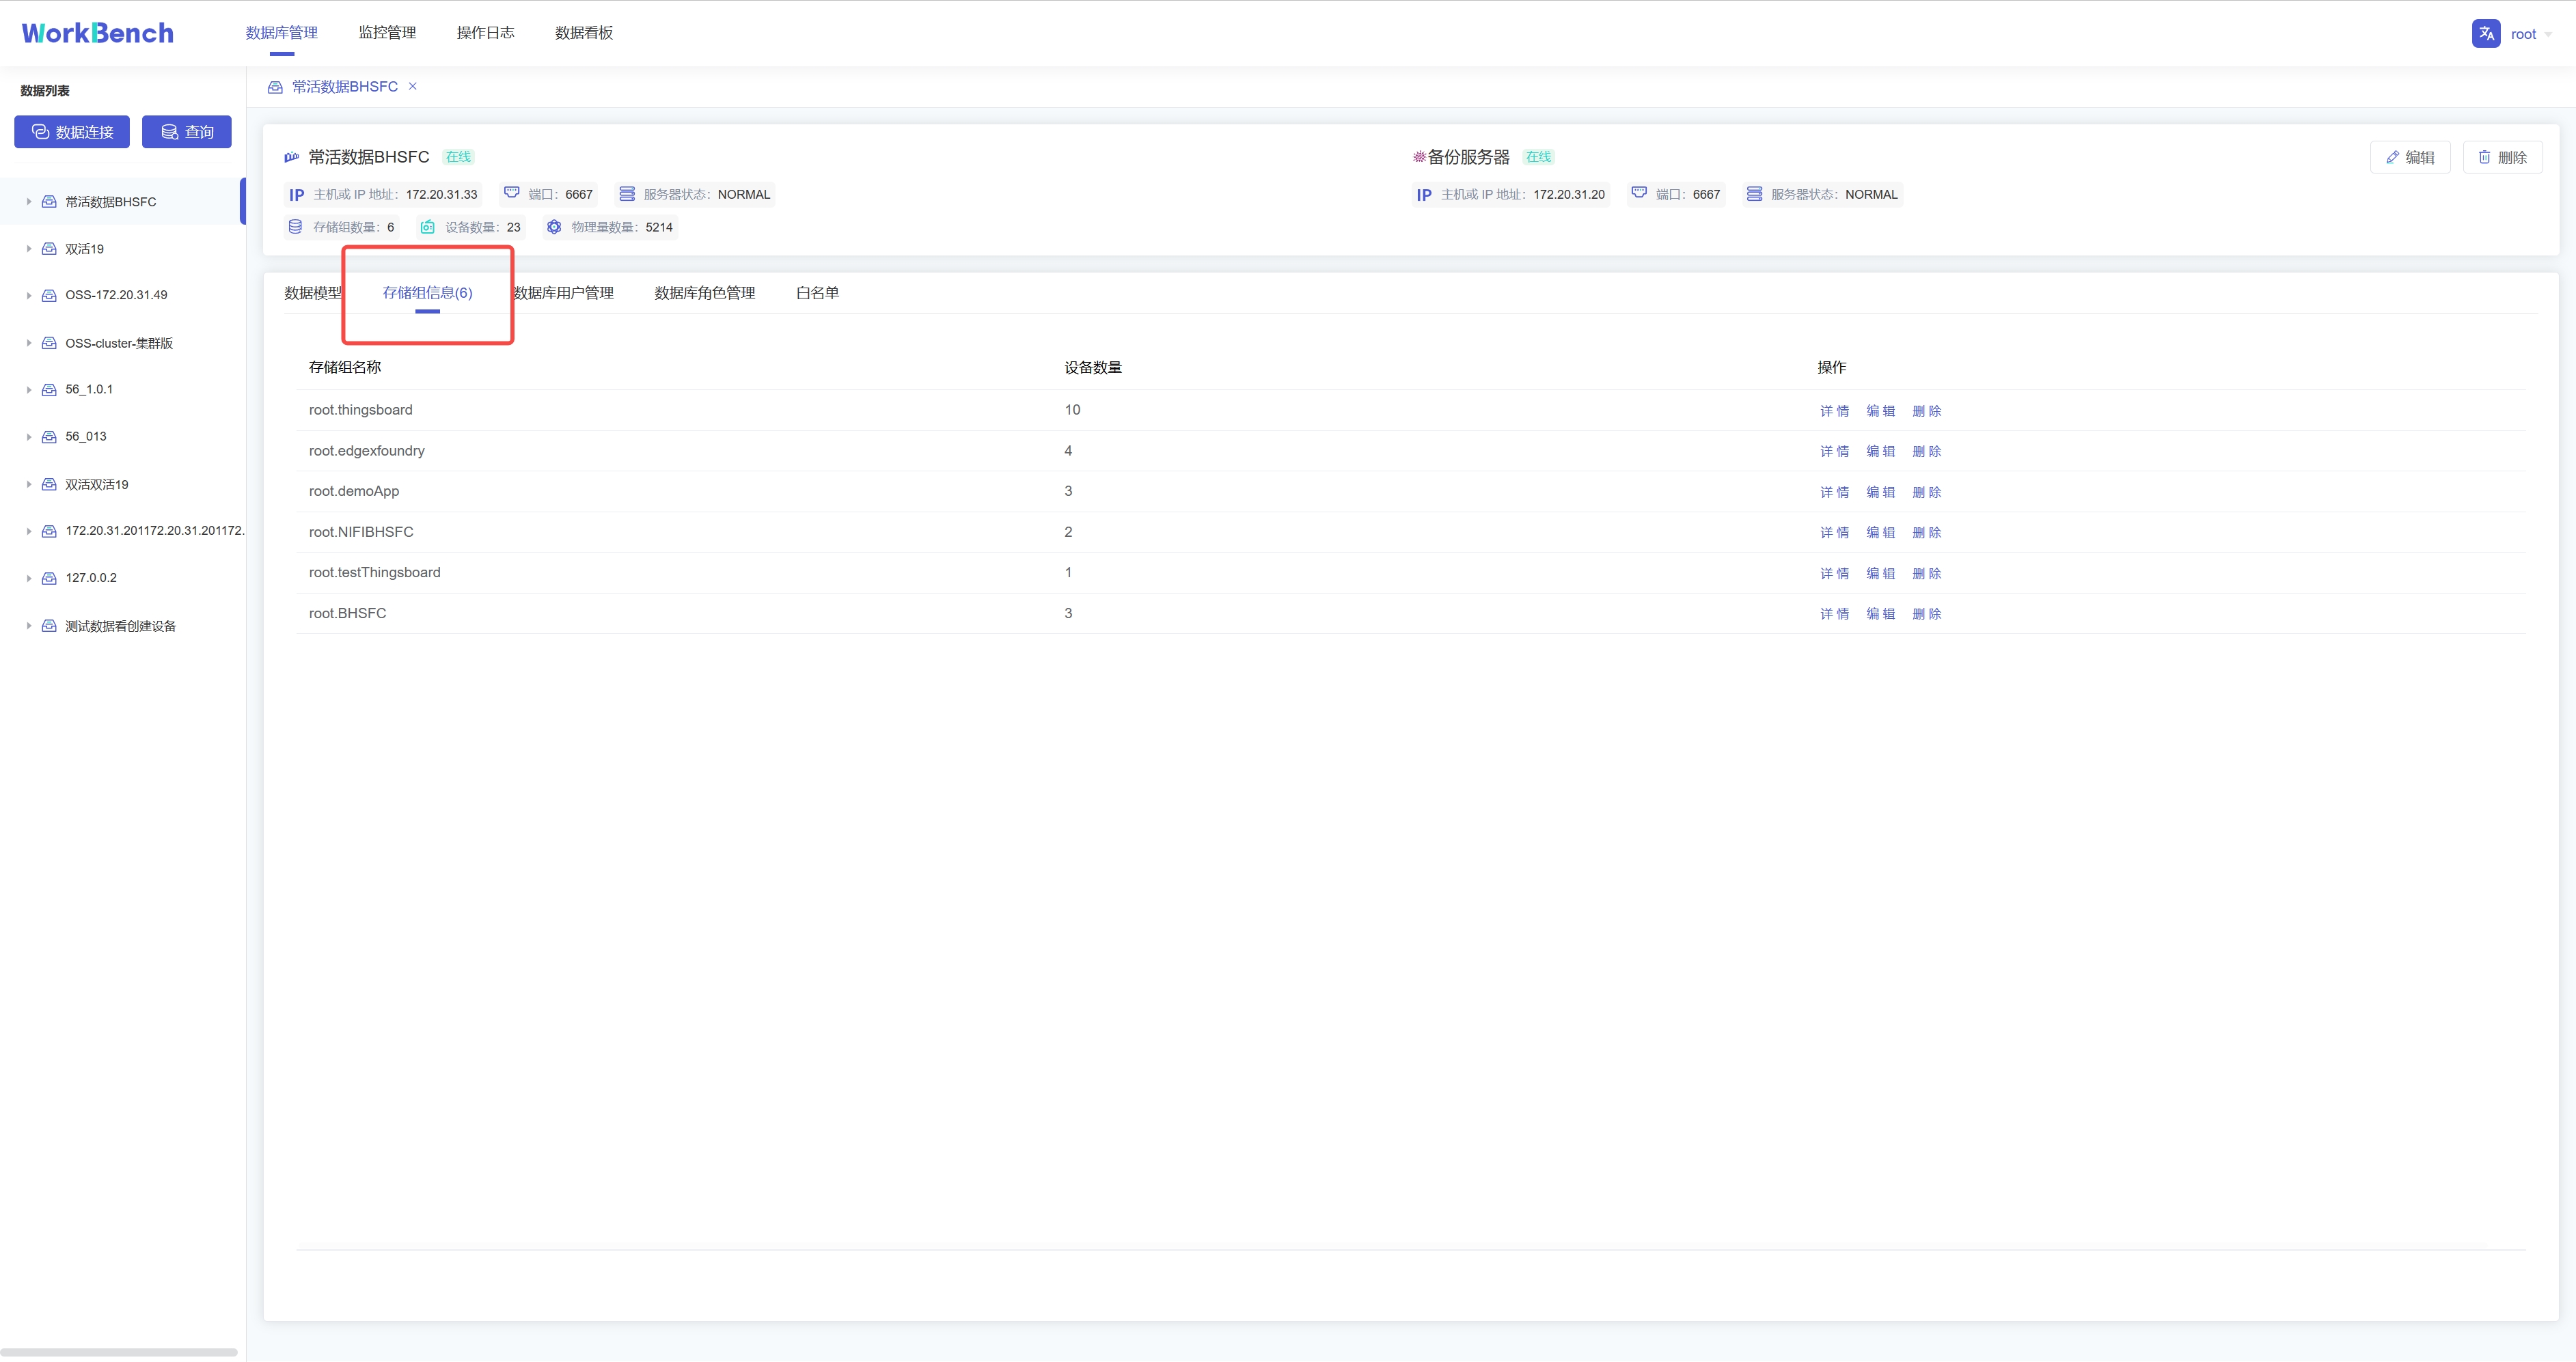
-**存储组信息**
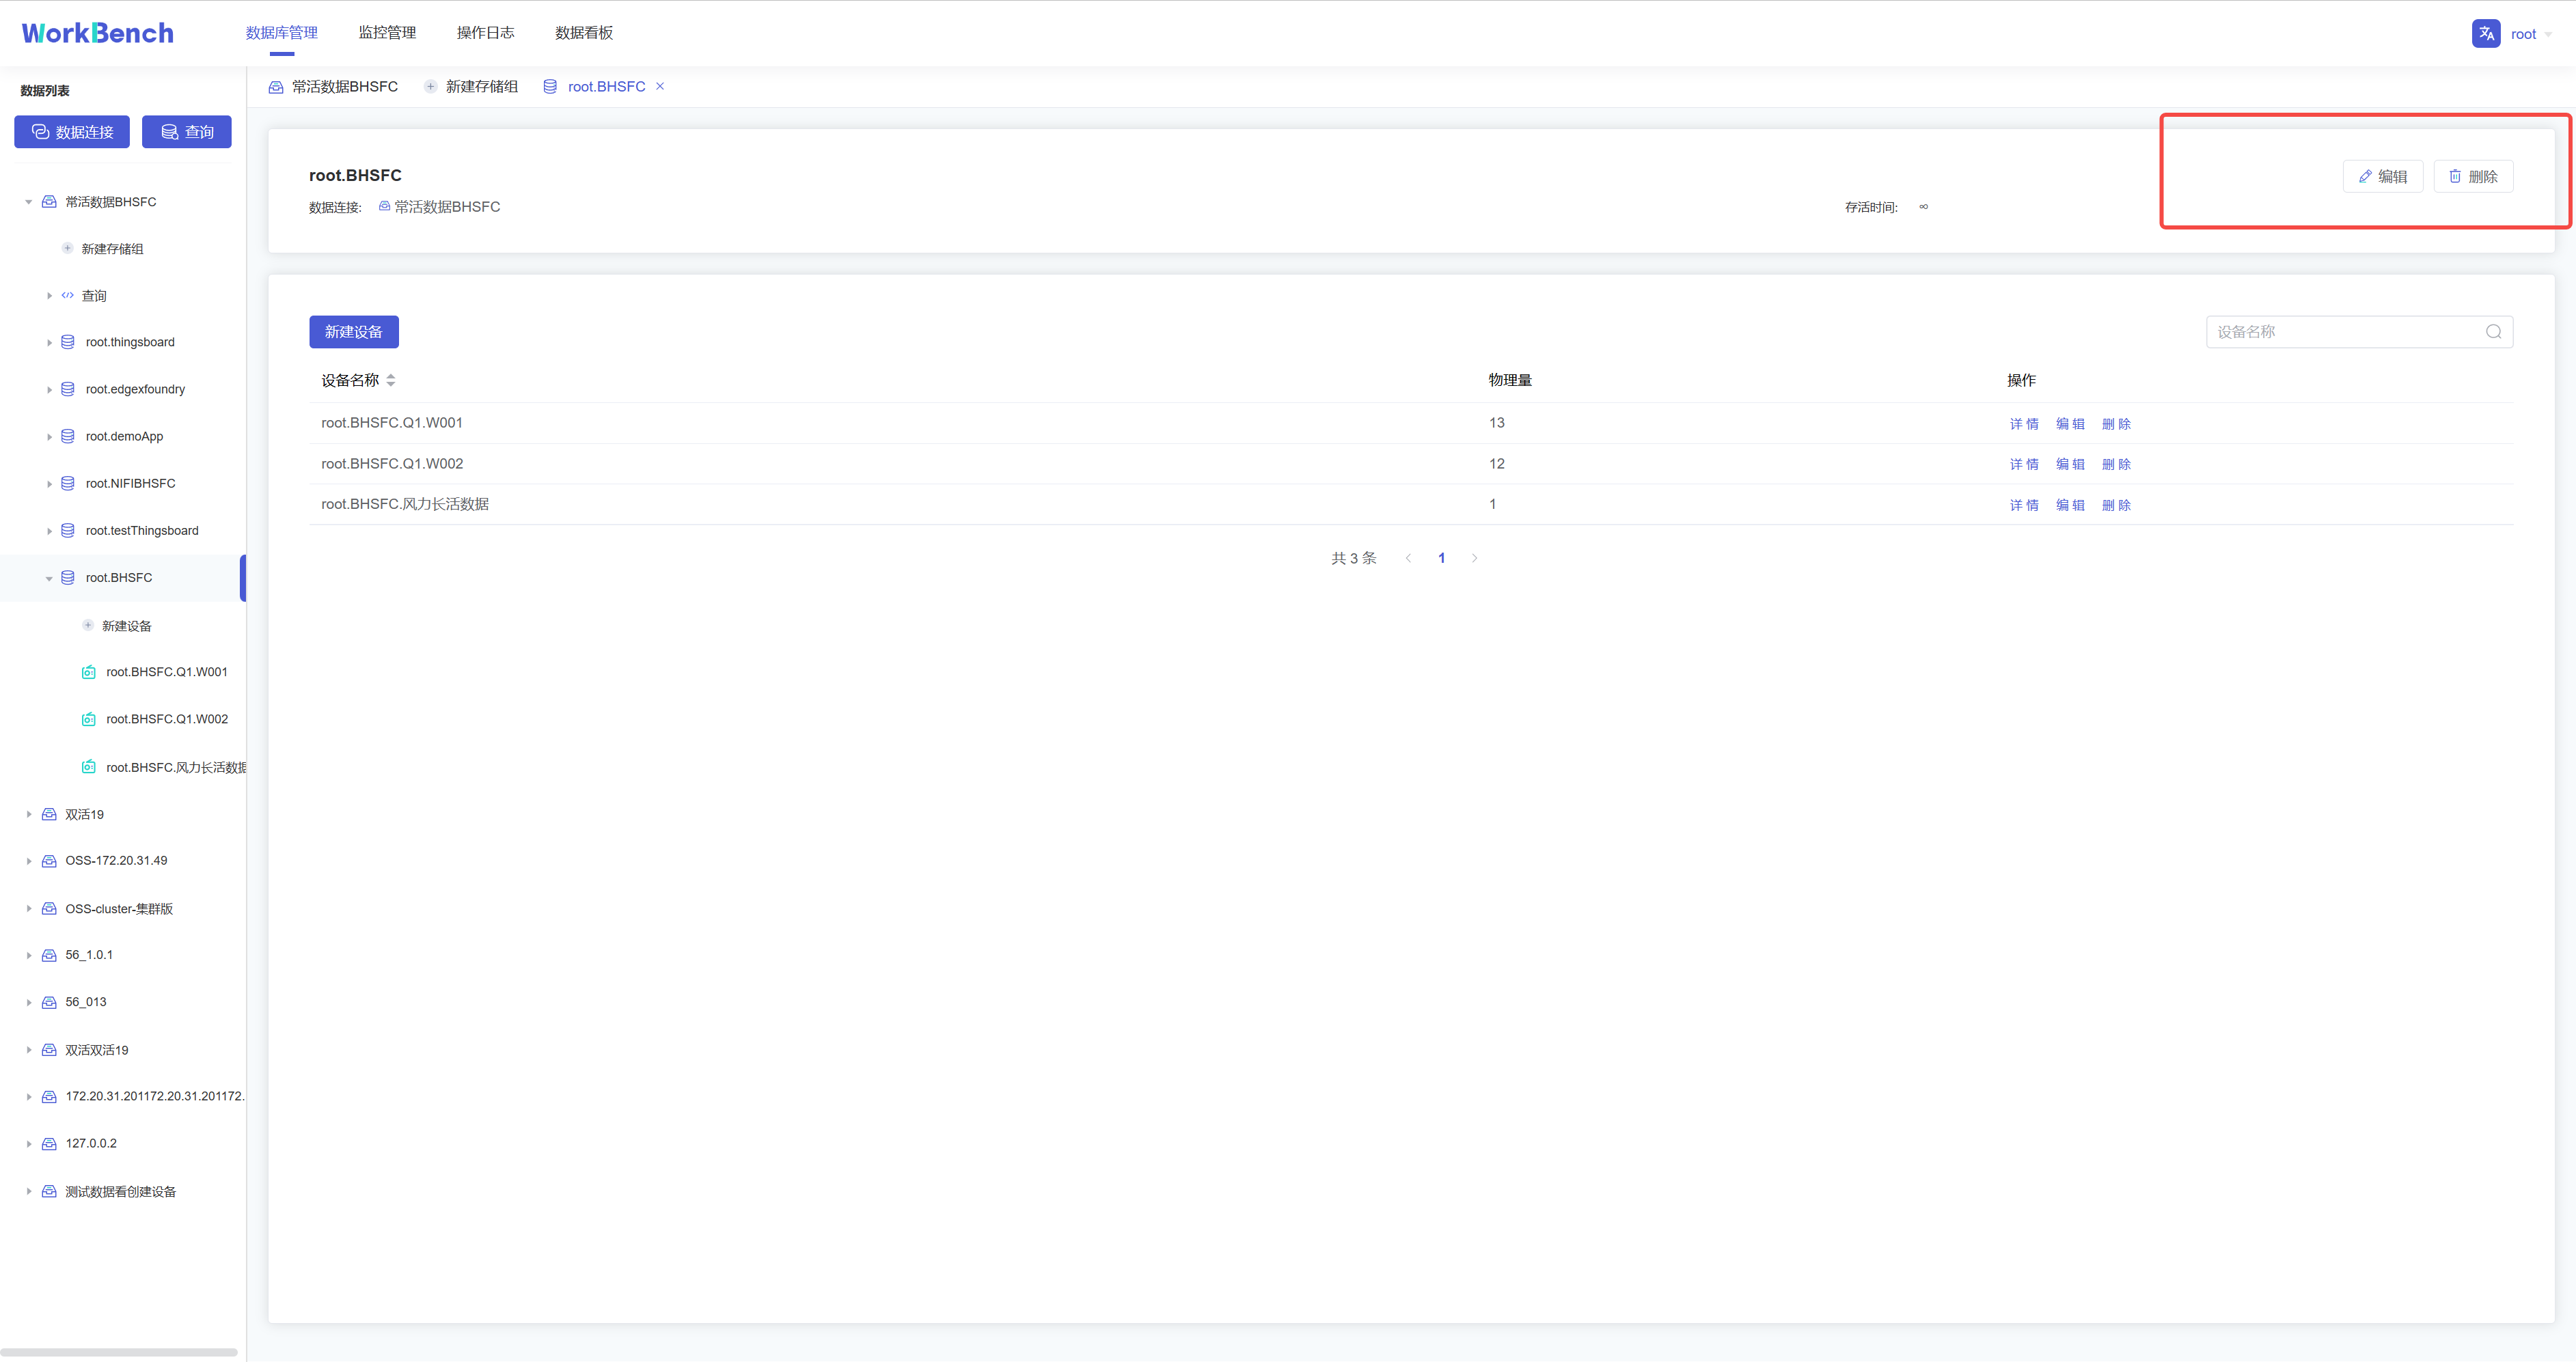
+### Storage Group Information
-点击操作列的"**存储组信息**"即可预览该数据连接的所有存储组信息,点击"**详情**"可查看该存储组下的实体详情,继续点击实体详情可查看物理量详情。点击"**编辑**"可编辑该存储组的TTL信息。
+Click "**Storage Group Information**" in the operation column to preview all
the storage group information of the data connection, click "**Details**" to
view the entity details under the storage group, and continue to click entity
details to view the physical quantity details. Click "**Edit**" to edit the TTL
information of the storage group.
-## 查询
+## Query
-Workbench提供强大的查询工具,可直接编辑查询文本,保存查询,用于简化查询行任务。
+Workbench provides a powerful query tool that can directly edit the query text
and save the query, simplifying the task of querying rows.
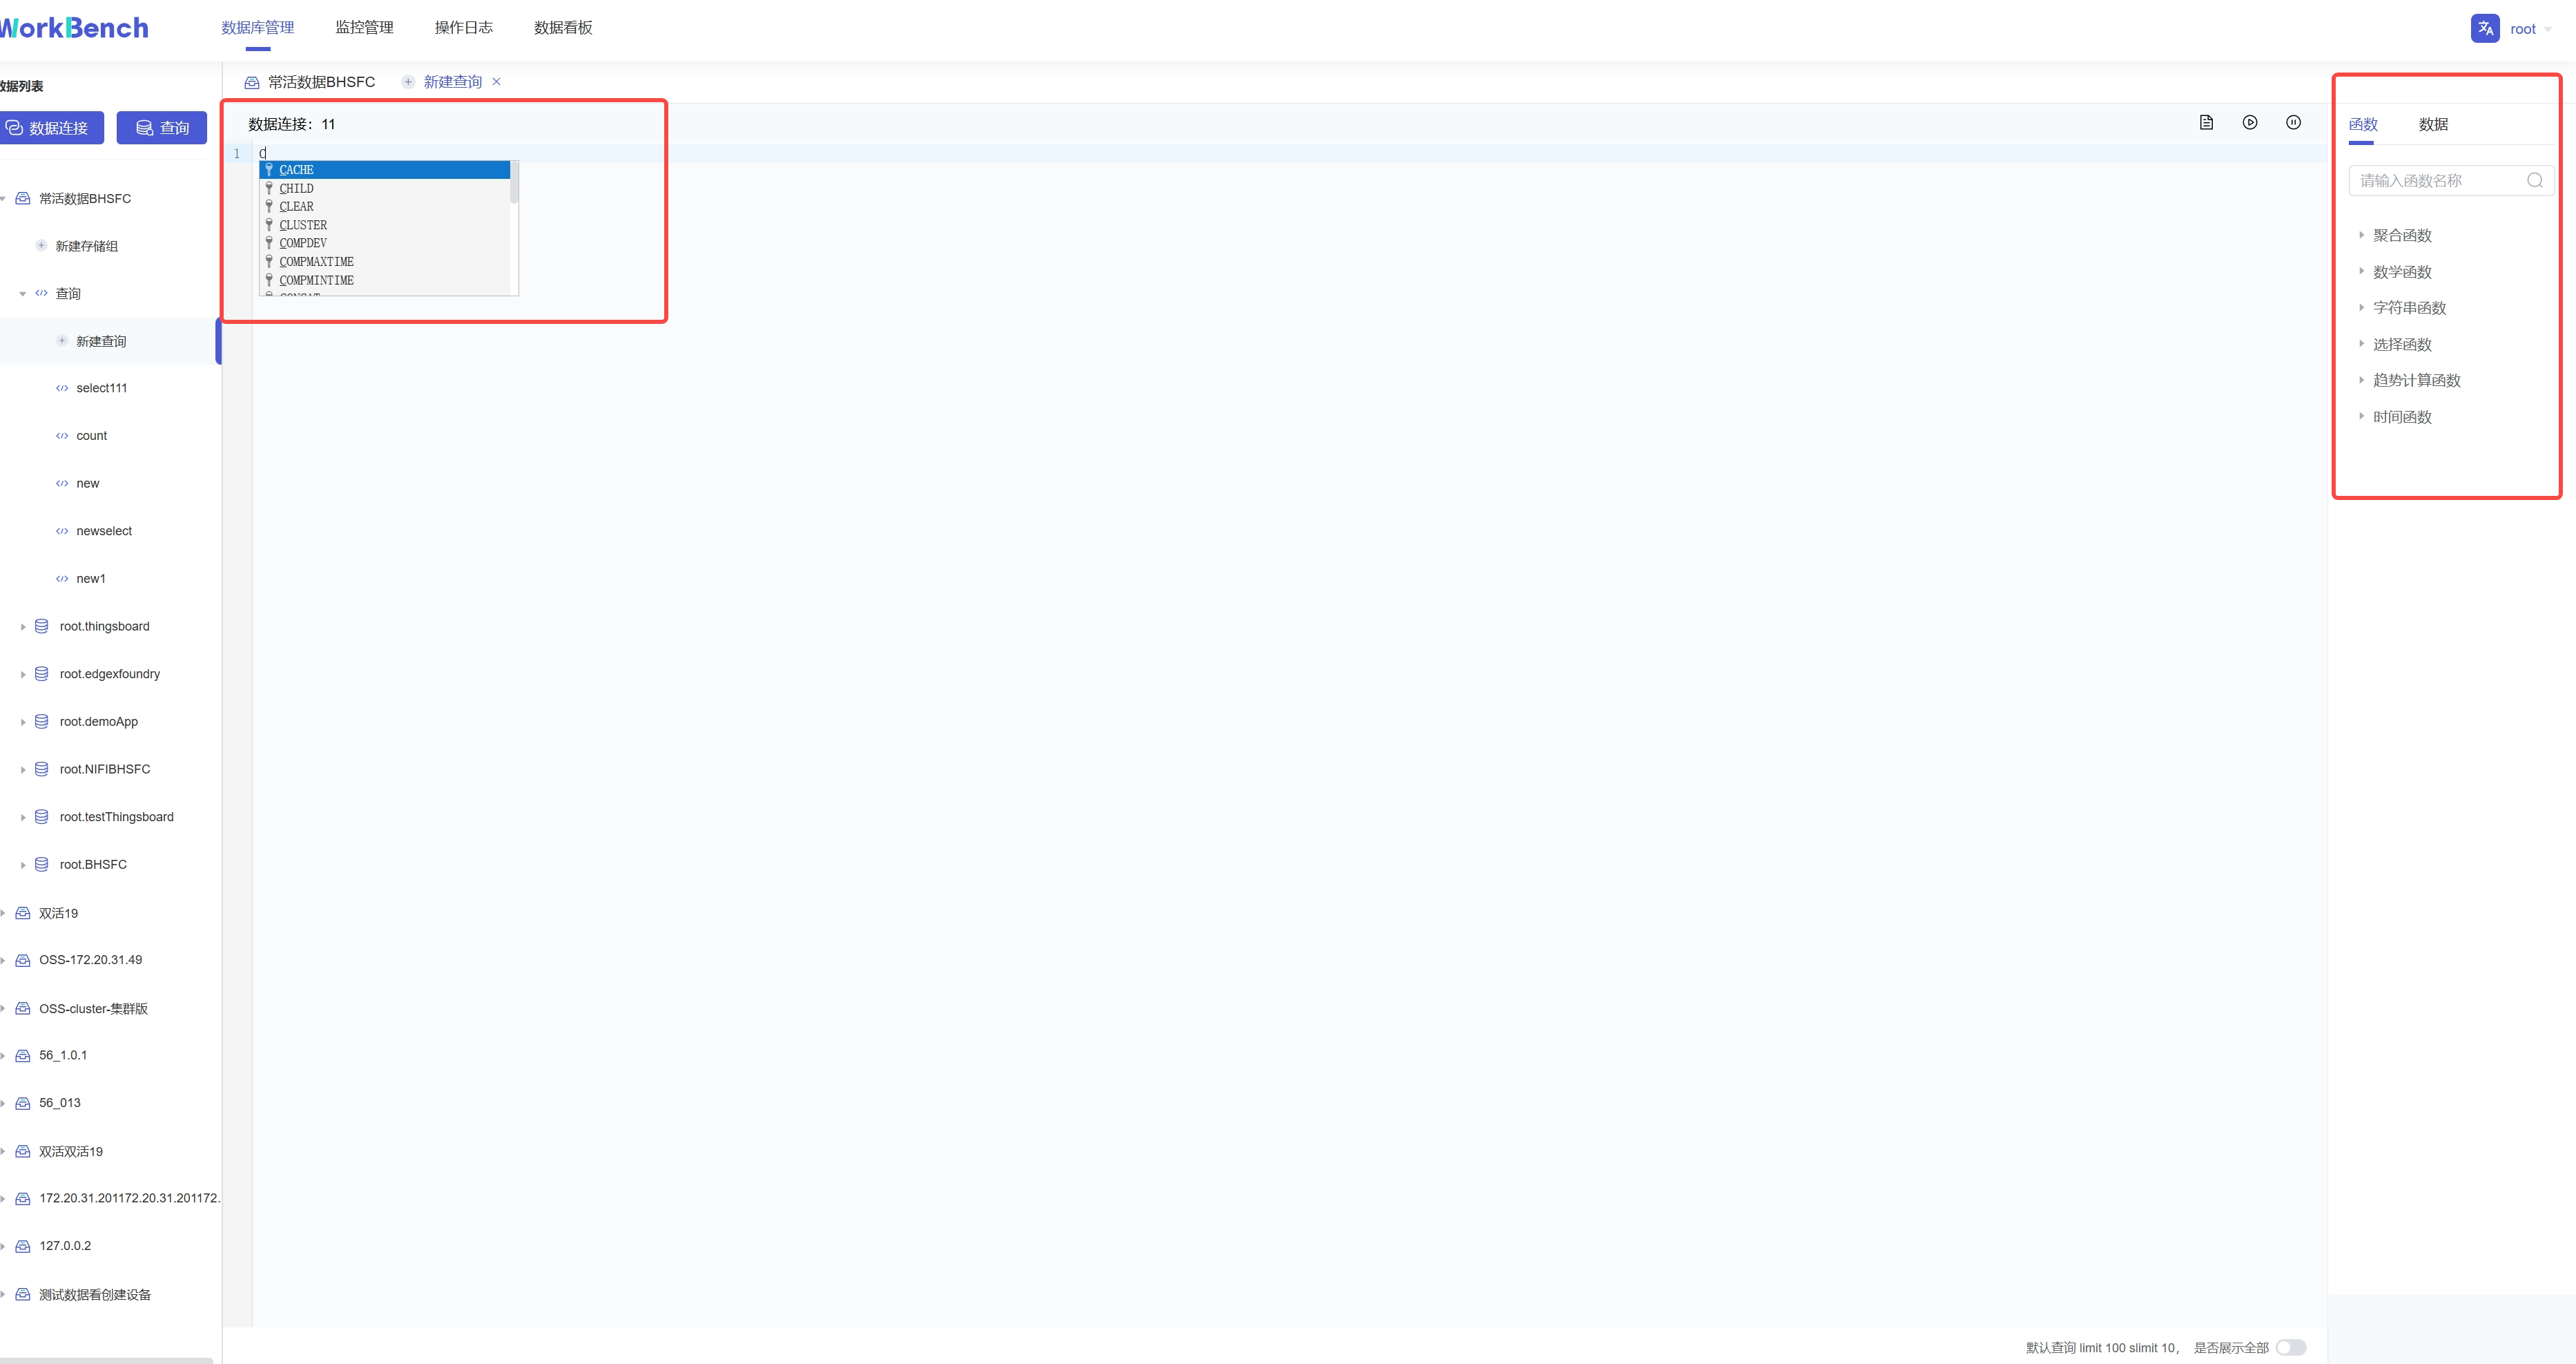
-**新建查询**
+### Create a Query
-点击"**连接操作栏**"的"**查询**",选择要进行操作的数据连接,即可进入查询编辑器。
+Click "**Query**" in "**Connection Operation Bar**", select the data
connection to be operated, and then enter the query editor.

-在查询编辑器界面可输入SQL语句,提示框会提示符合条件的关键字。右侧可按要求选择函数或数据进行计算。
+You can enter SQL statements on the query editor interface, and the prompt box
will prompt keywords that meet the conditions. On the right side, functions or
data can be selected for calculation as required.
{width="5.90625in"
height="3.125in"}
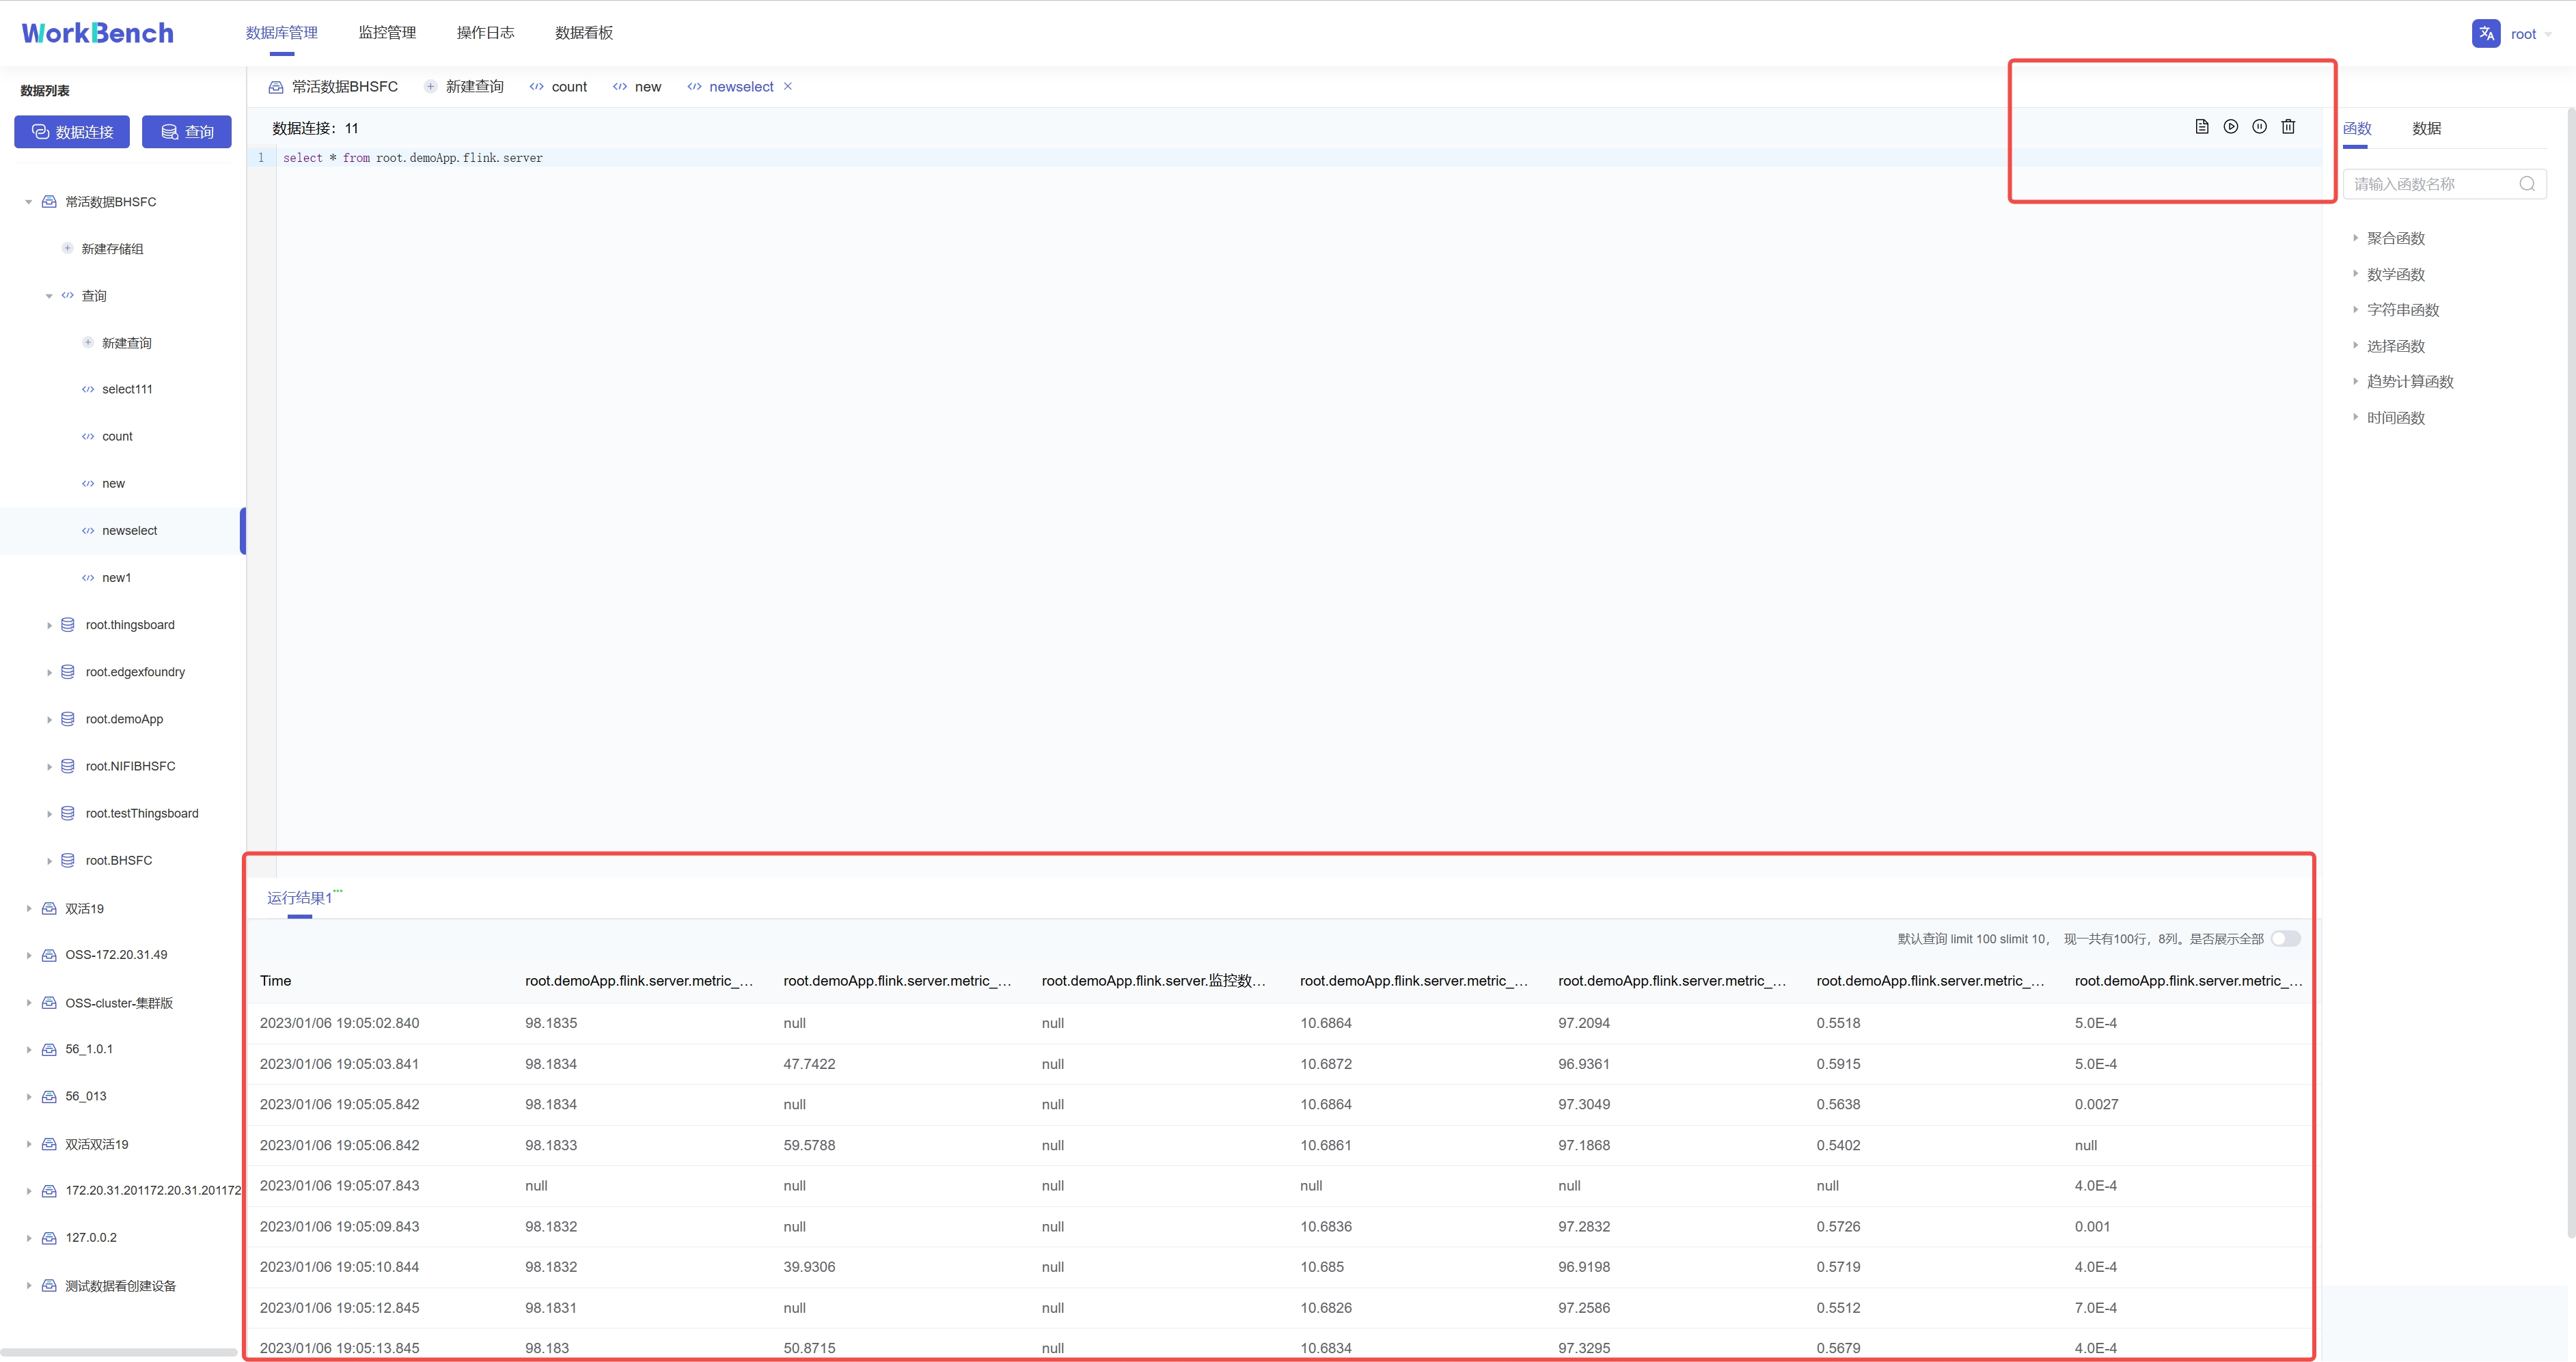
-输入SQL语句后,点击右上角可选择操作,分别是"保存"、"运行"、"暂停"和"删除"。运行结果显示10行每页,默认限制返回结果100行,也可选择取消限制全部展示。
+After entering the SQL statement, click the upper right corner to select
operations, namely "Save", "Run", "Pause" and "Delete". The running results
display 10 lines per page, and the default limit is 100 lines of returned
results, and you can also choose to cancel the limit to display all.
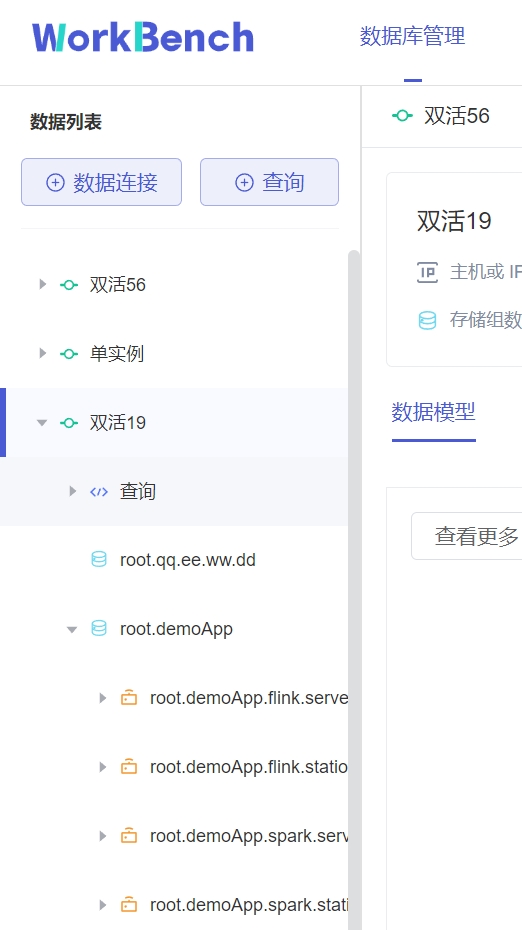
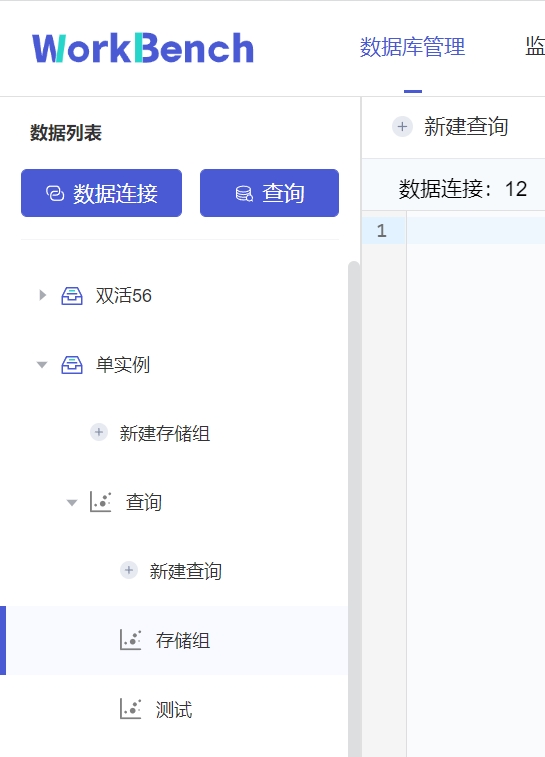
-**查看查询**
+### View Query
-已保存的连接可在对象窗格中该数据连接下的"**查询**"下查看。
+A saved connection can be viewed under **Query** under the data connection in
the object pane.
-## 集群管理
+## Cluster Management
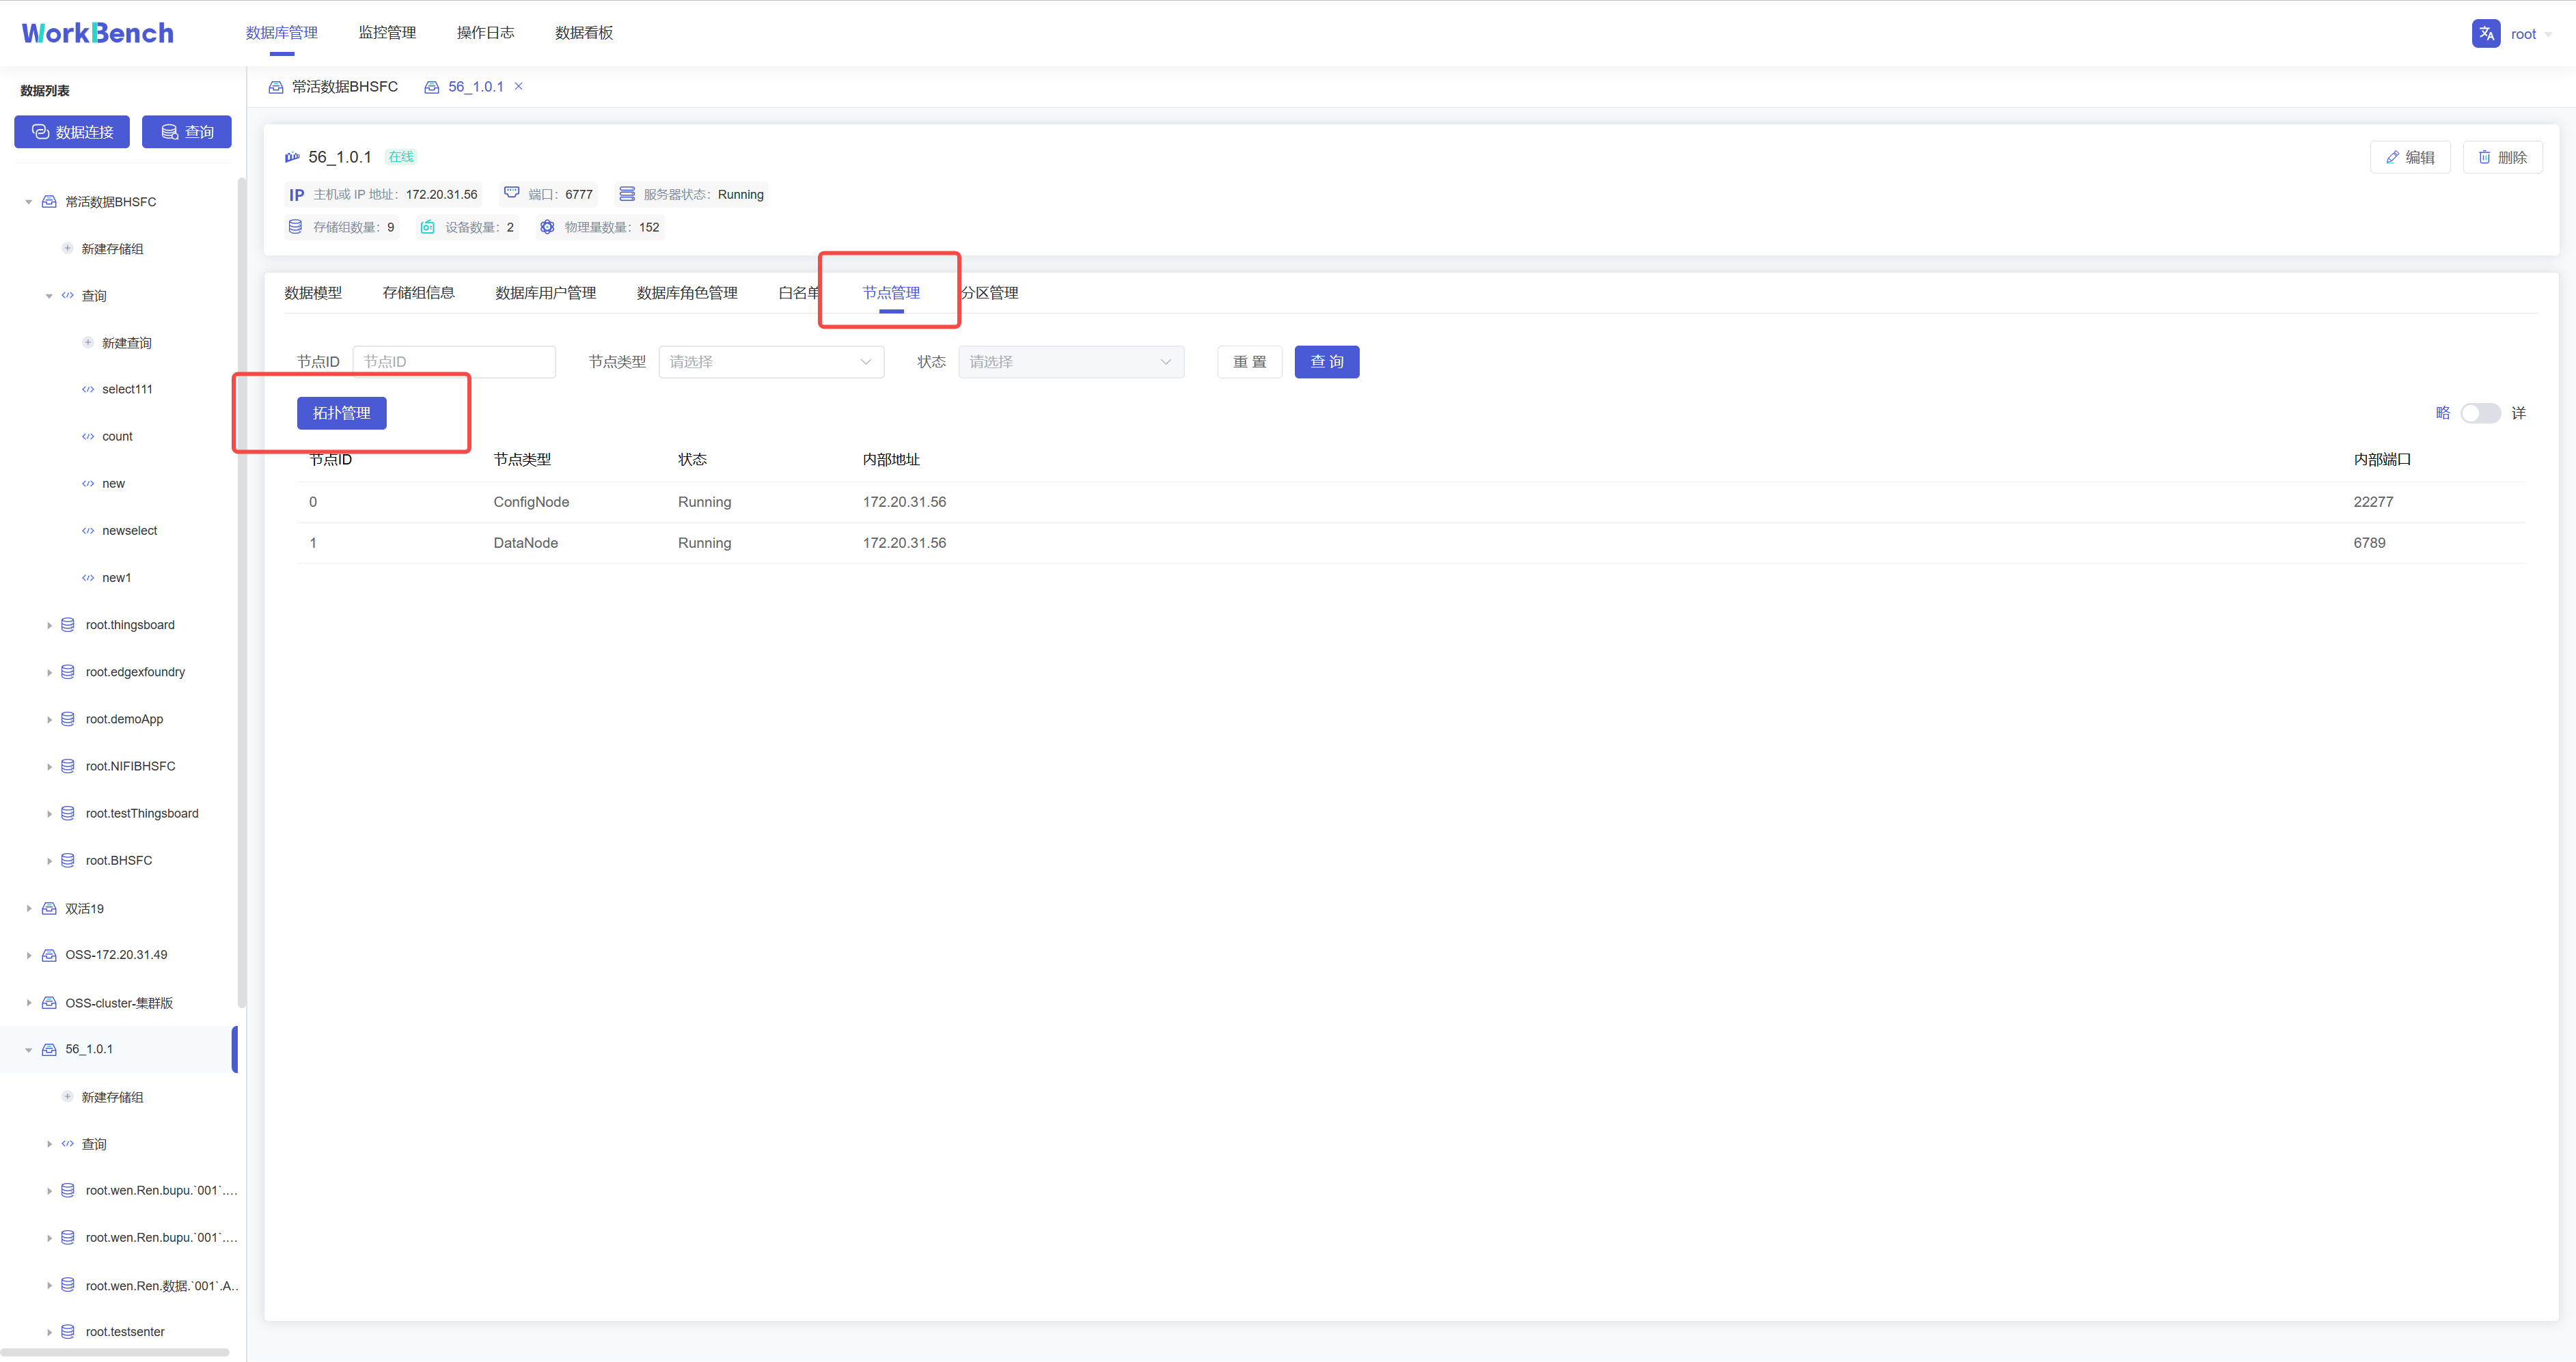
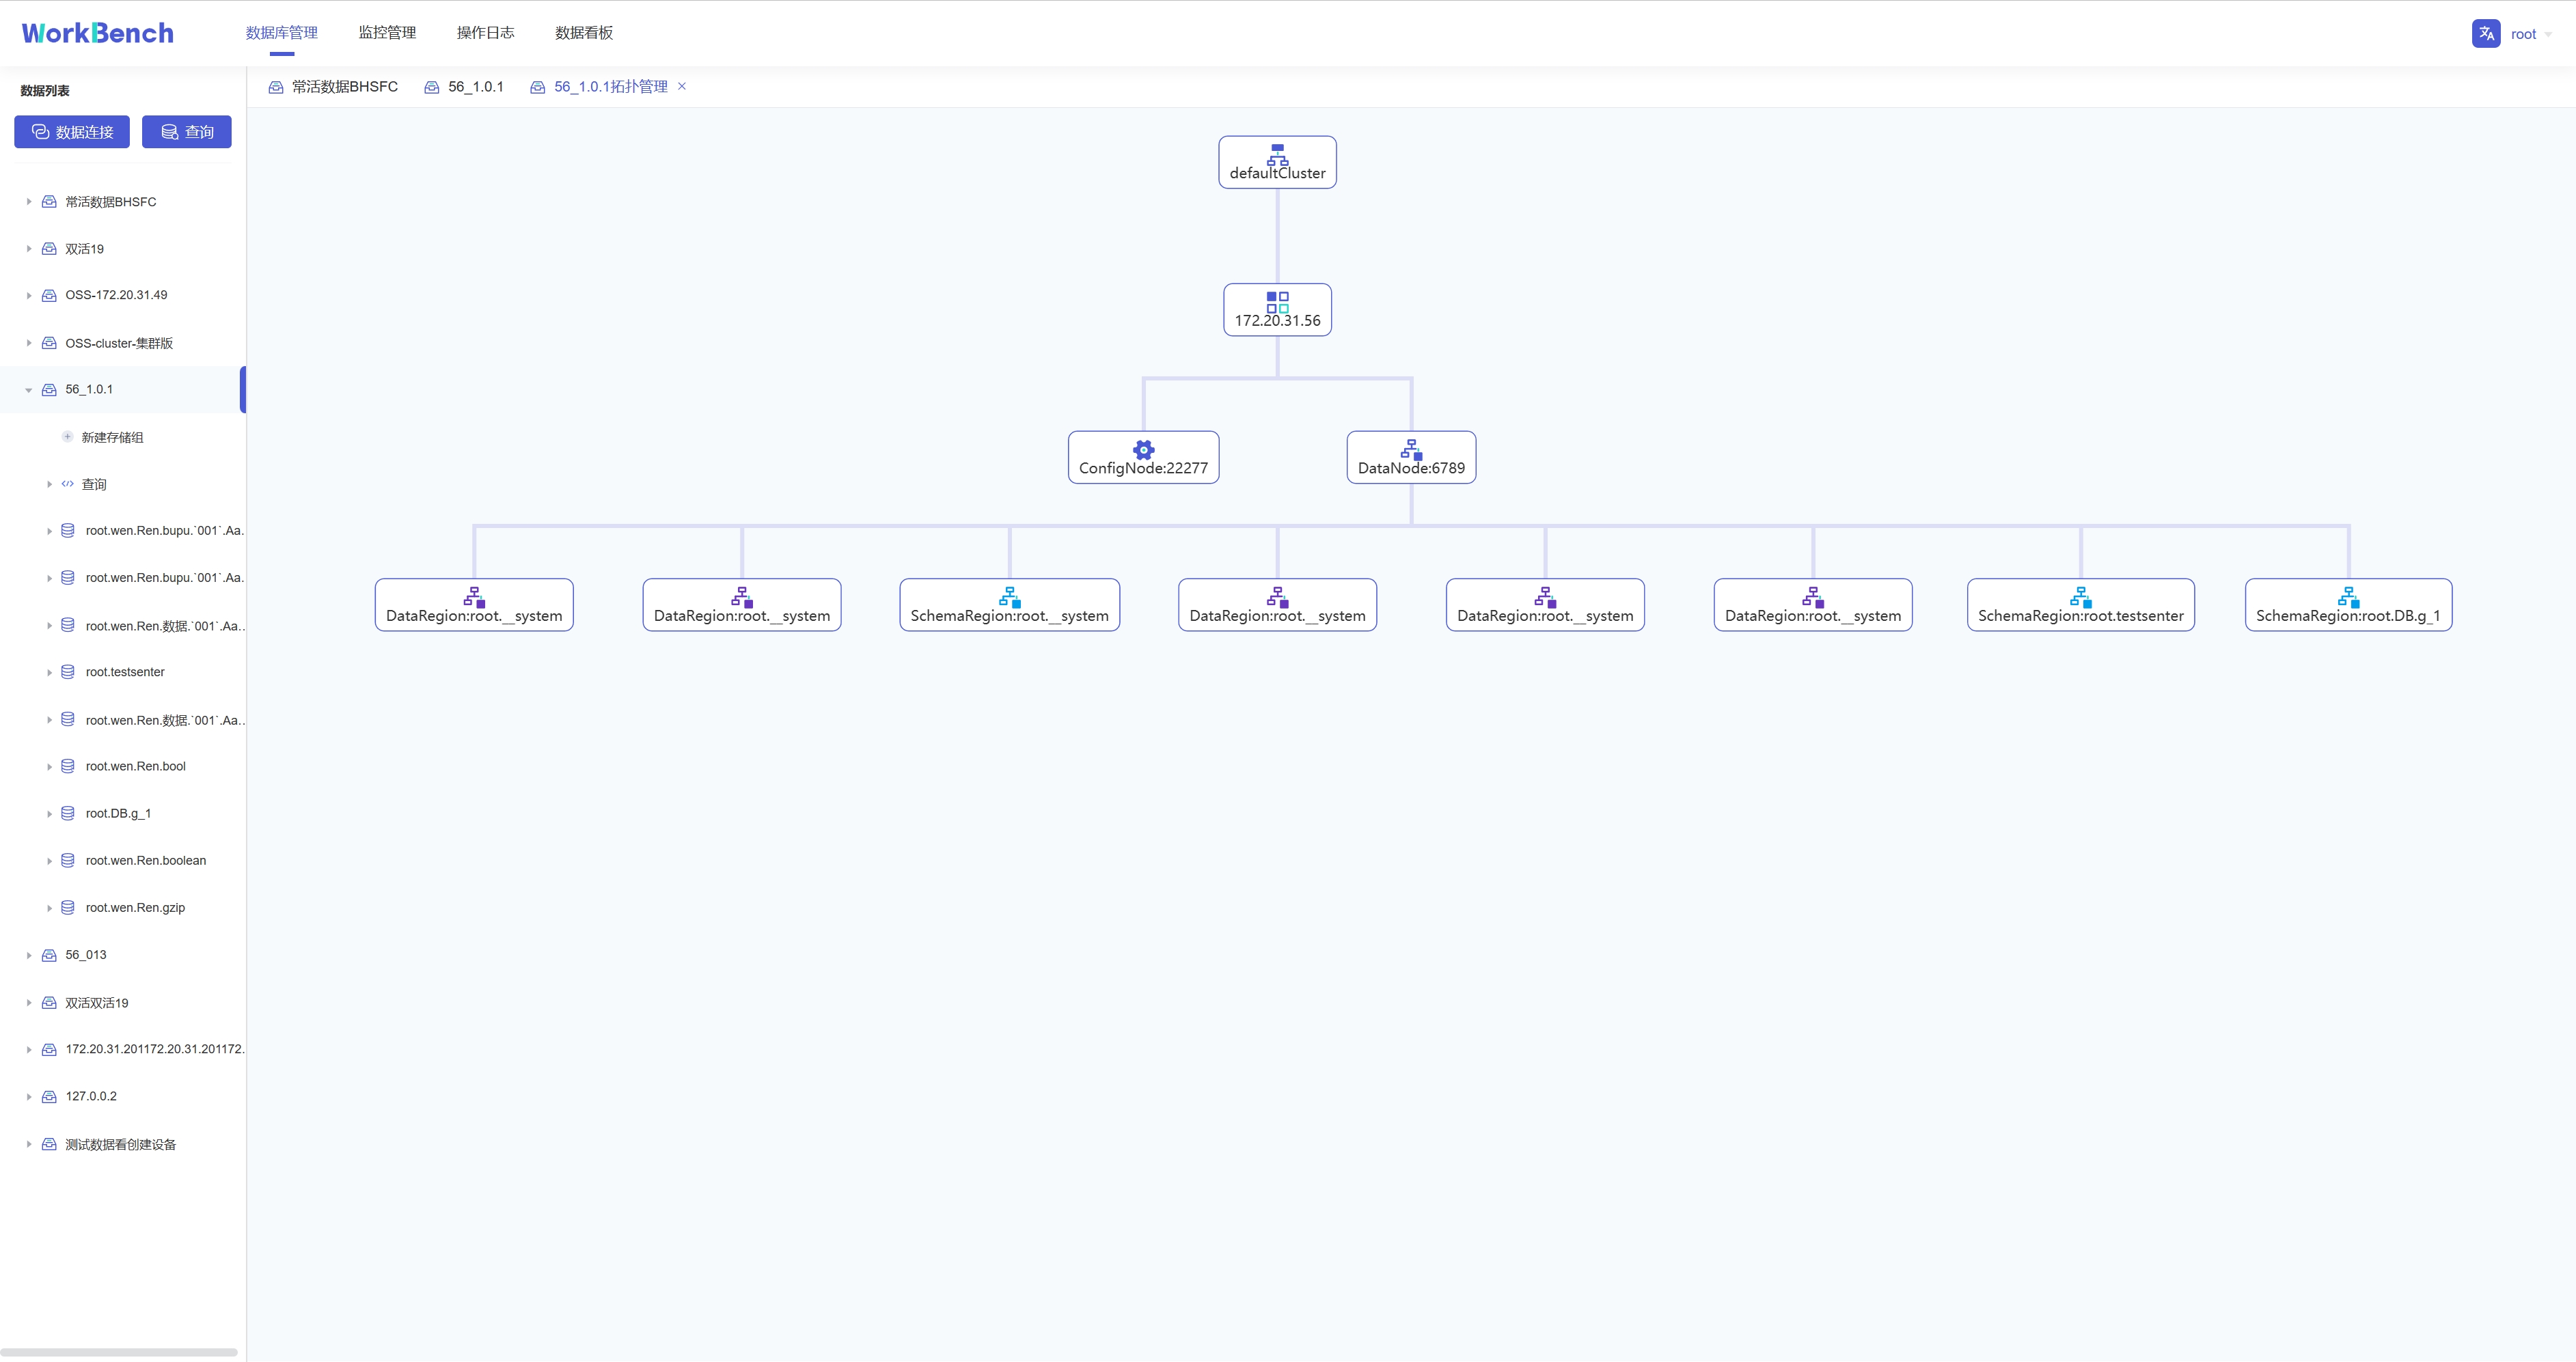
-**拓扑管理**
+### Topology Management
-Workbench提供对集群拓扑图的查看。选择"**数据库管理**"-\>"**节点管理**"\>"**拓扑管理**"可以查看拓扑图。"拓扑管理"功能仅在企业版中支持。
+Workbench provides a view of the cluster topology. Select "**Database
Management**"-\>"**Node Management**"\>"**Topology Management**" to view the
topology map. The "Topology Management" function is only supported in the
Enterprise Edition.
-拓扑图显示节点IP、节点类型及端口。
+The topology map shows the node IP, node type and port.
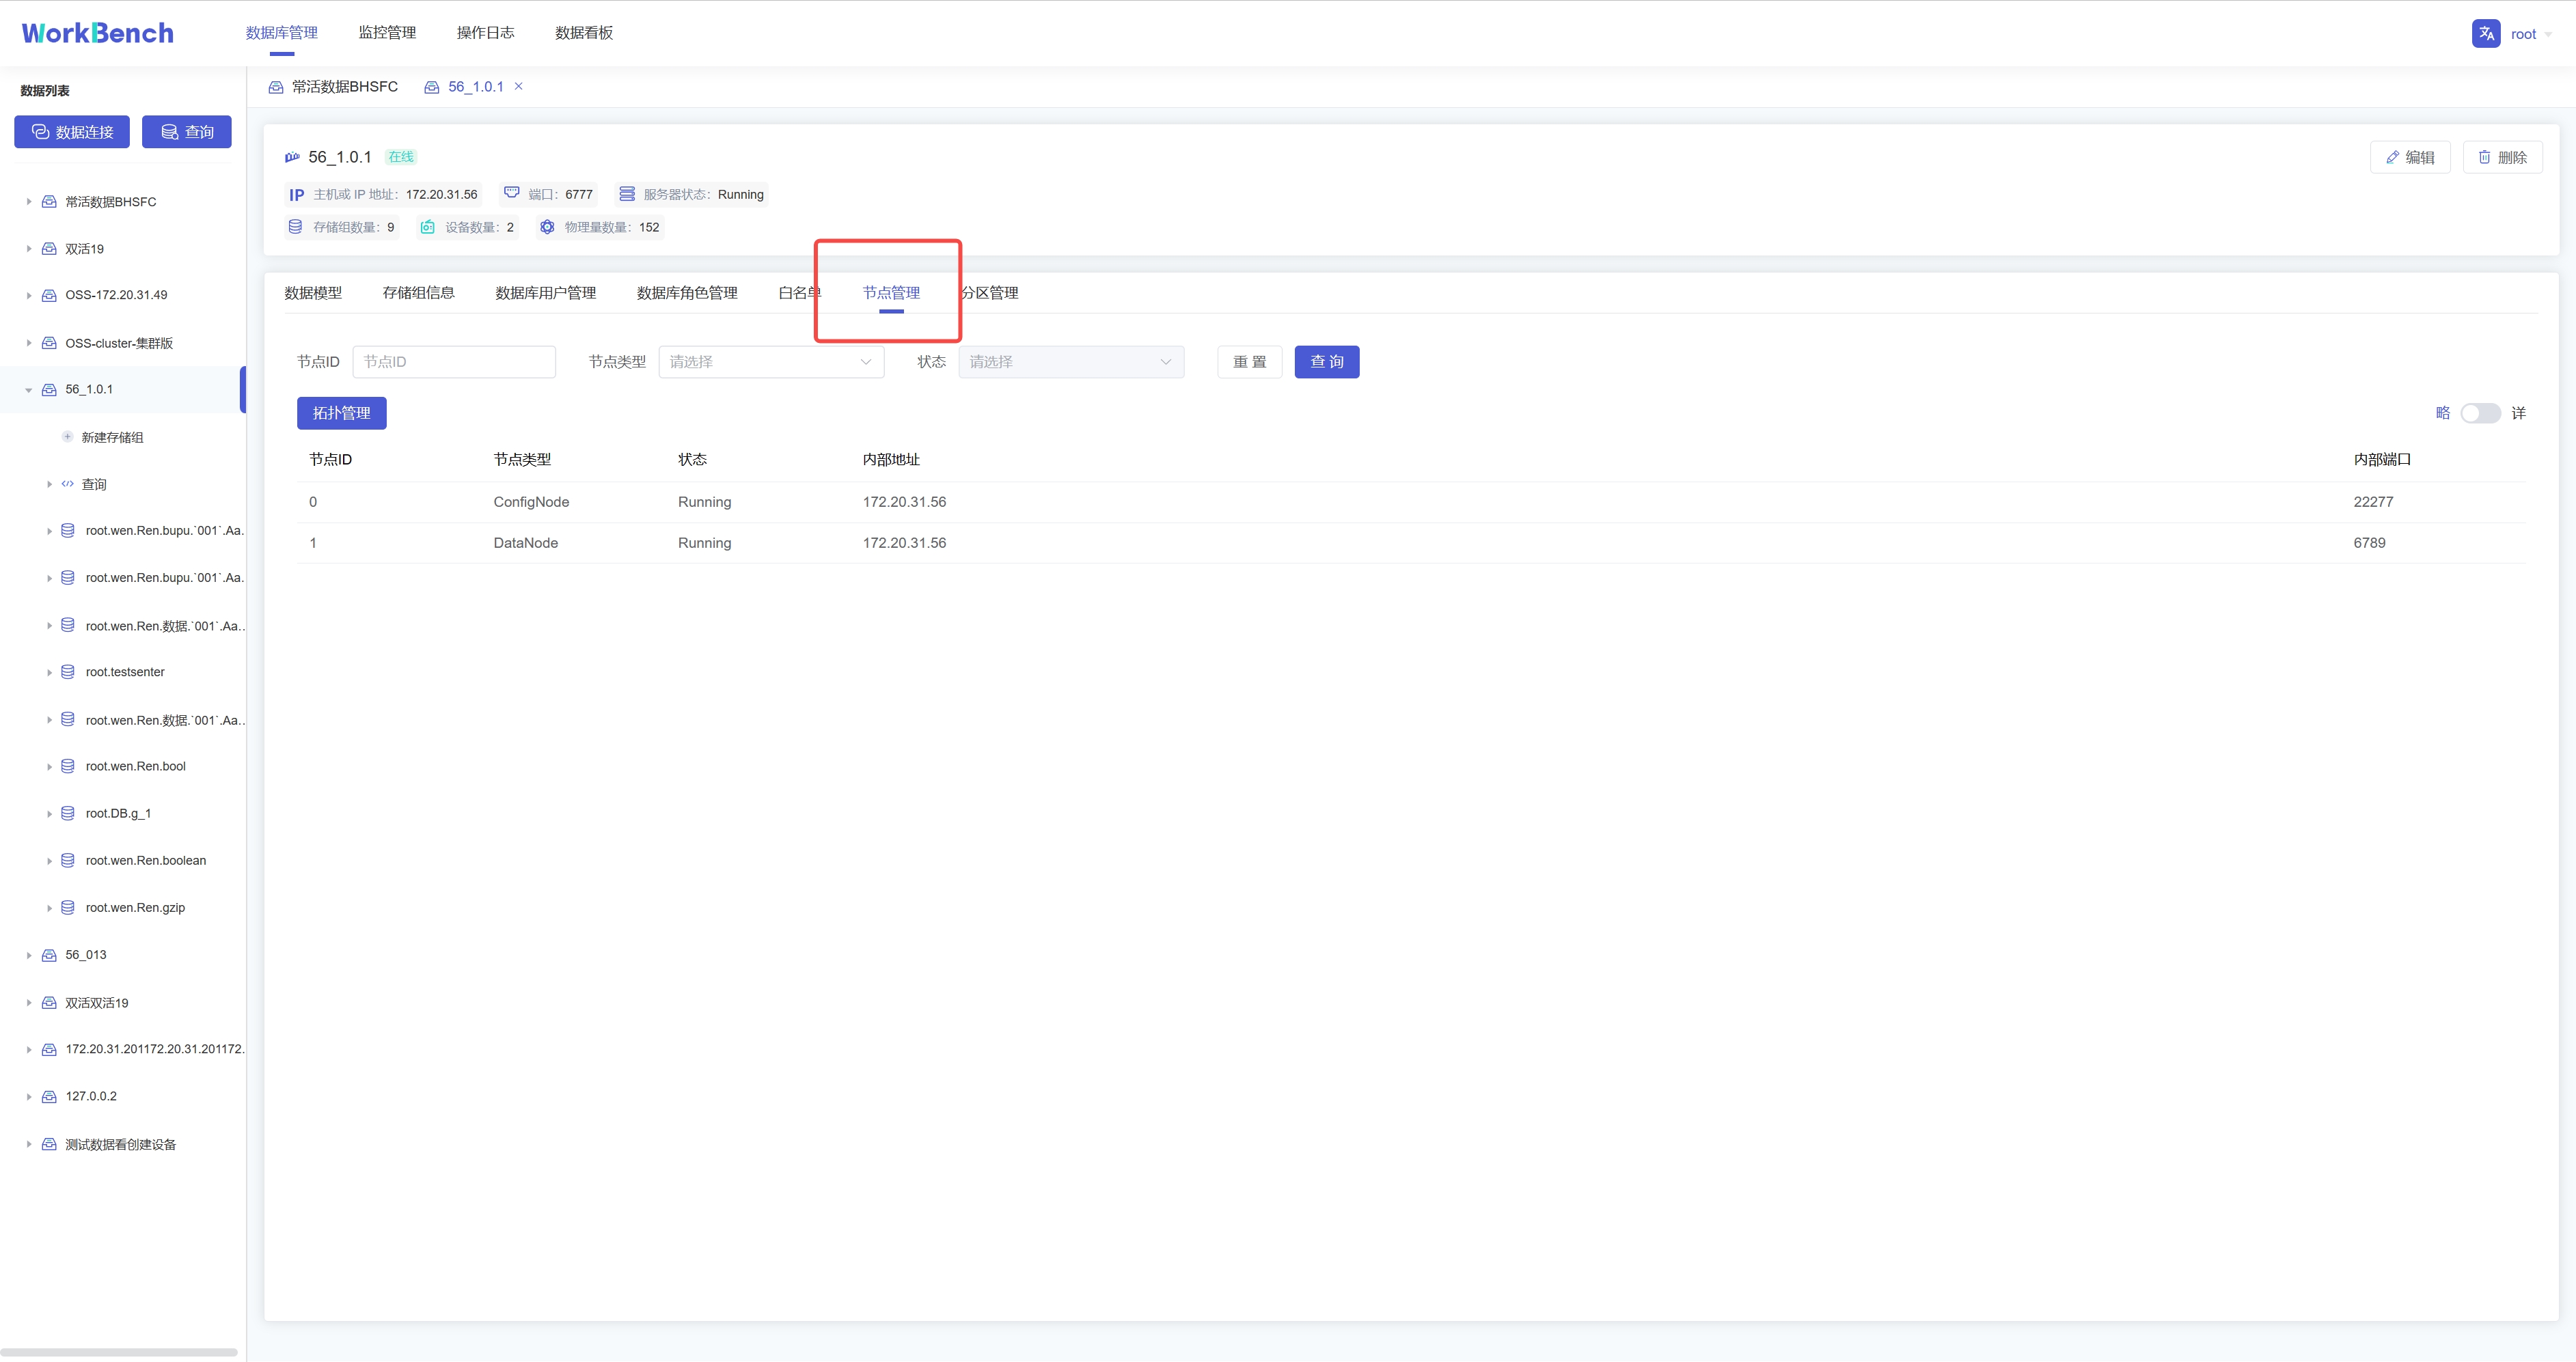
-**节点管理**
+### Node Management
-Workbench提供对集群节点的管理。选择"**数据库管理**"-\>"**节点管理**"可以查看节点状态。可按节点ID或节点类型进行查询。
+Workbench provides management of cluster nodes. Select "**Database
Management**"-\>"**Node Management**" to view the node status. You can query by
node ID or node type.
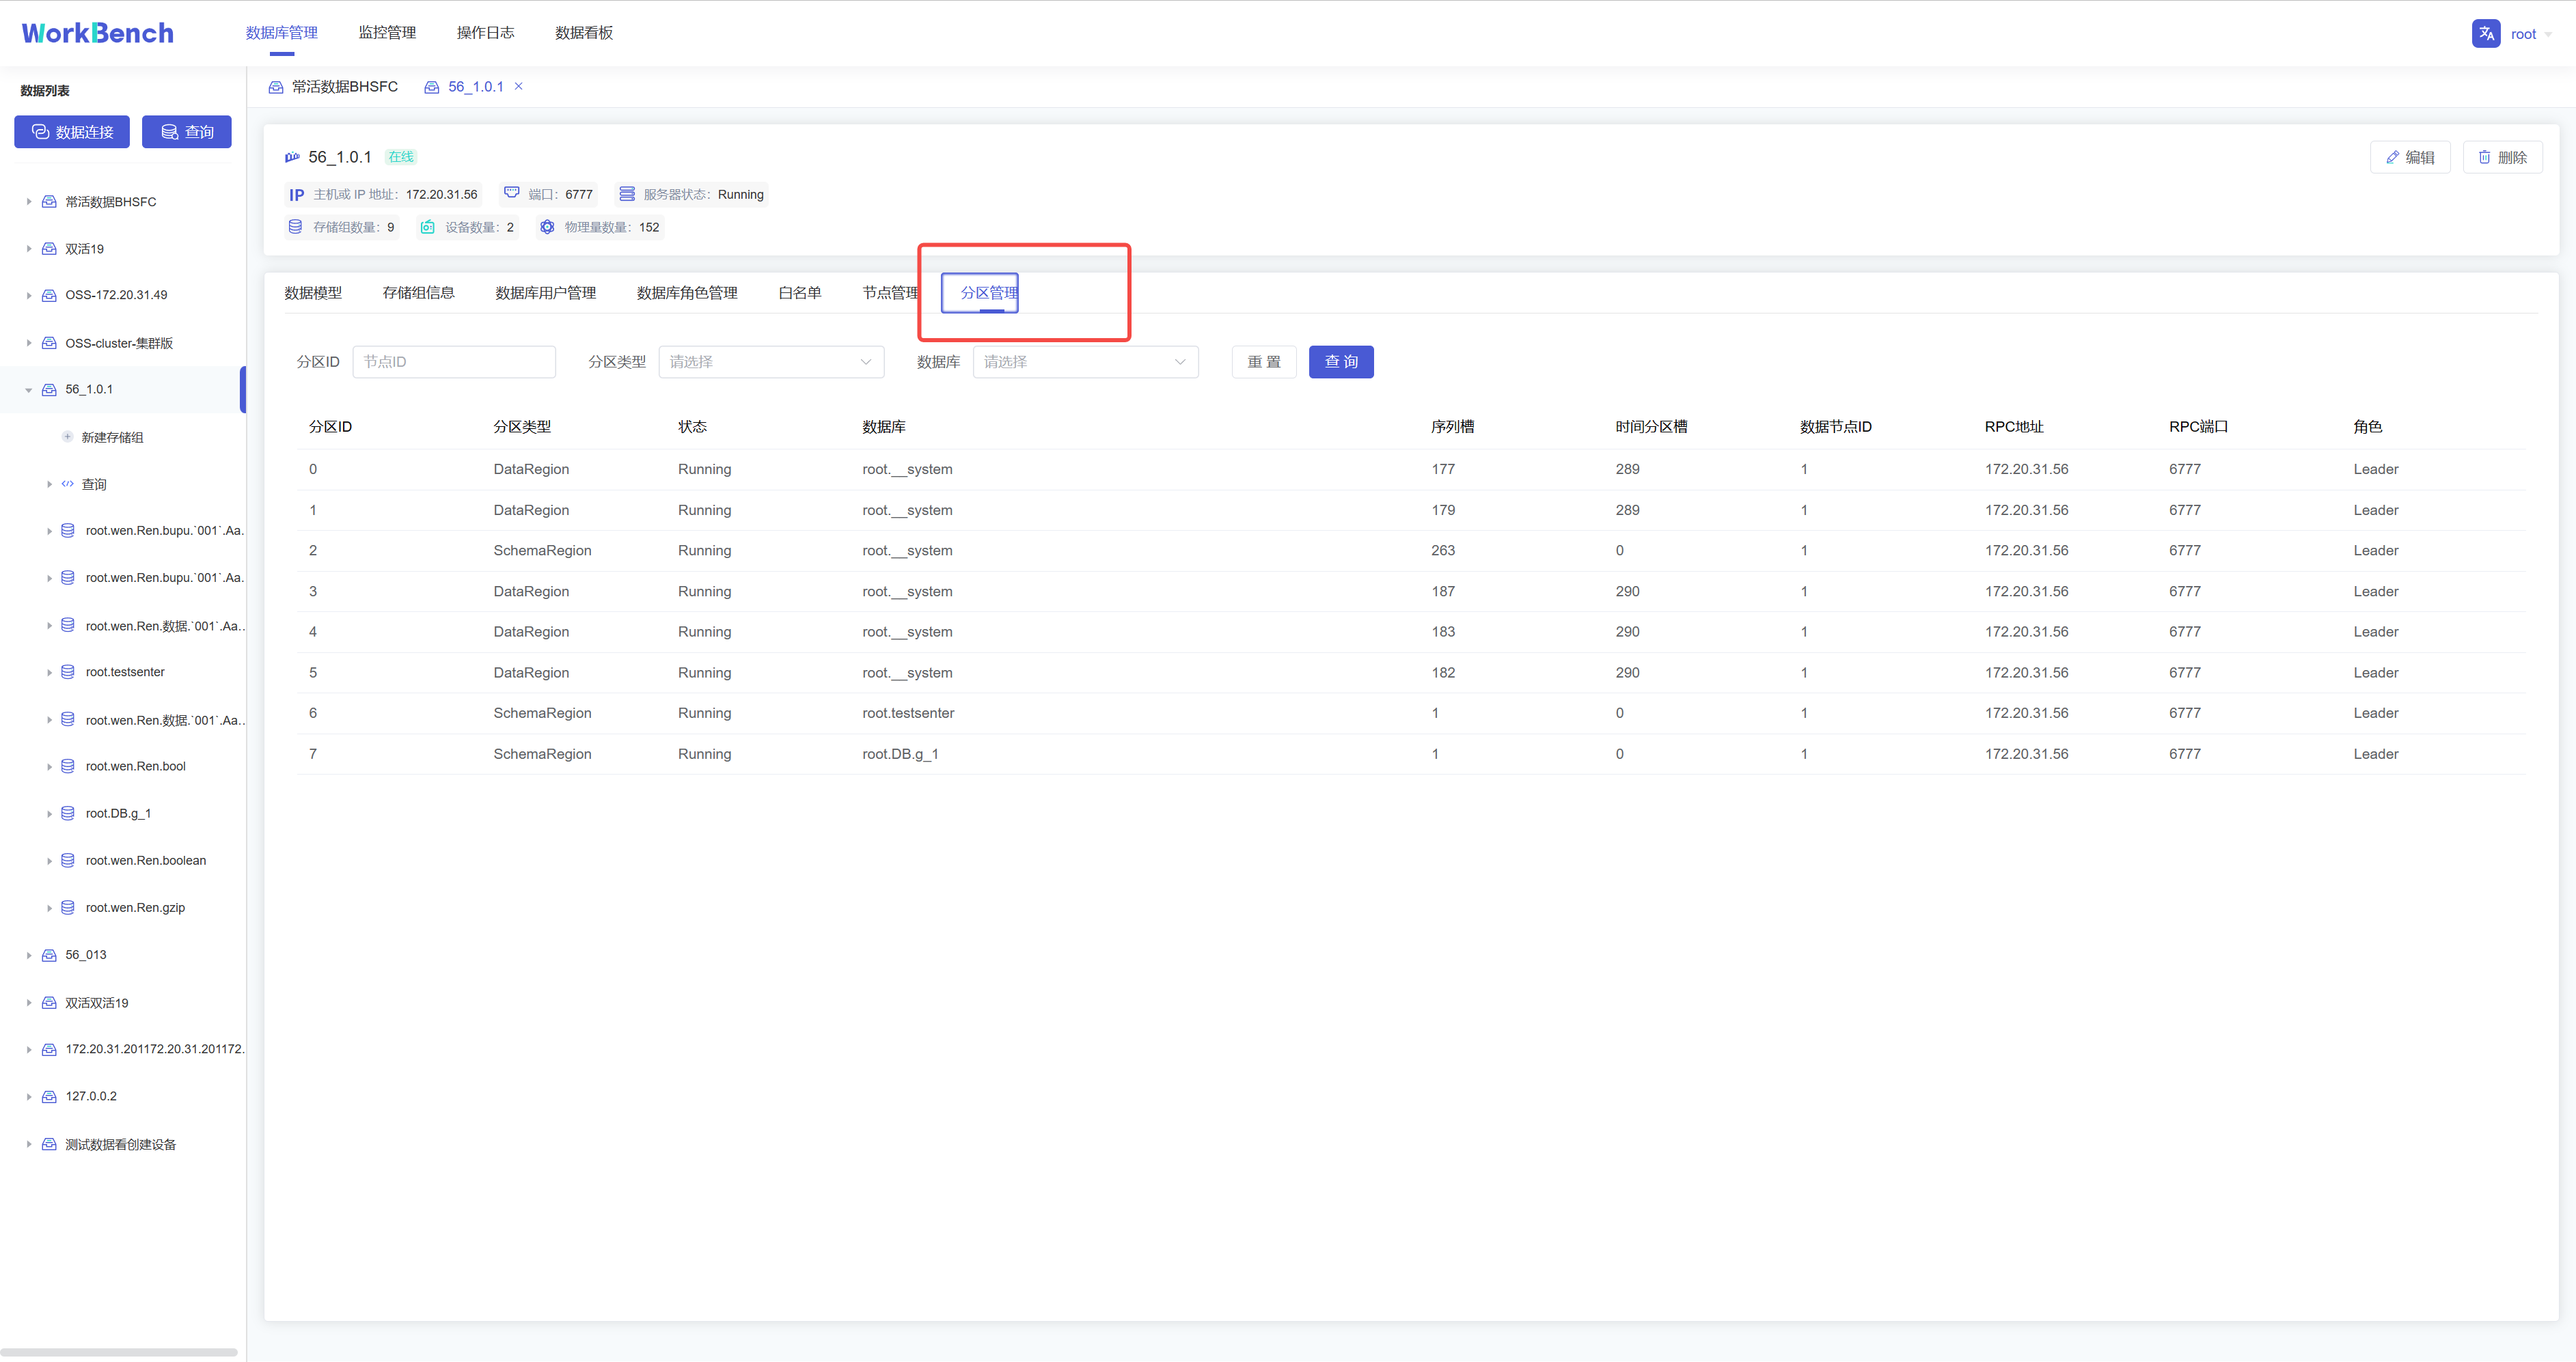
-**分区管理**
+### Partition Management
-Workbench提供对集群分区的管理。选择"**数据库管理**"-\>"**分区管理**"可以查看分区状态。可按分区ID或分区类型进行查询。
+Workbench provides management of cluster partitions. Select "**Database
Management**"->"**Partition Management**" to check the partition status. You
can query by partition ID or partition type.
-## 存储组管理
+## Storage Group Management
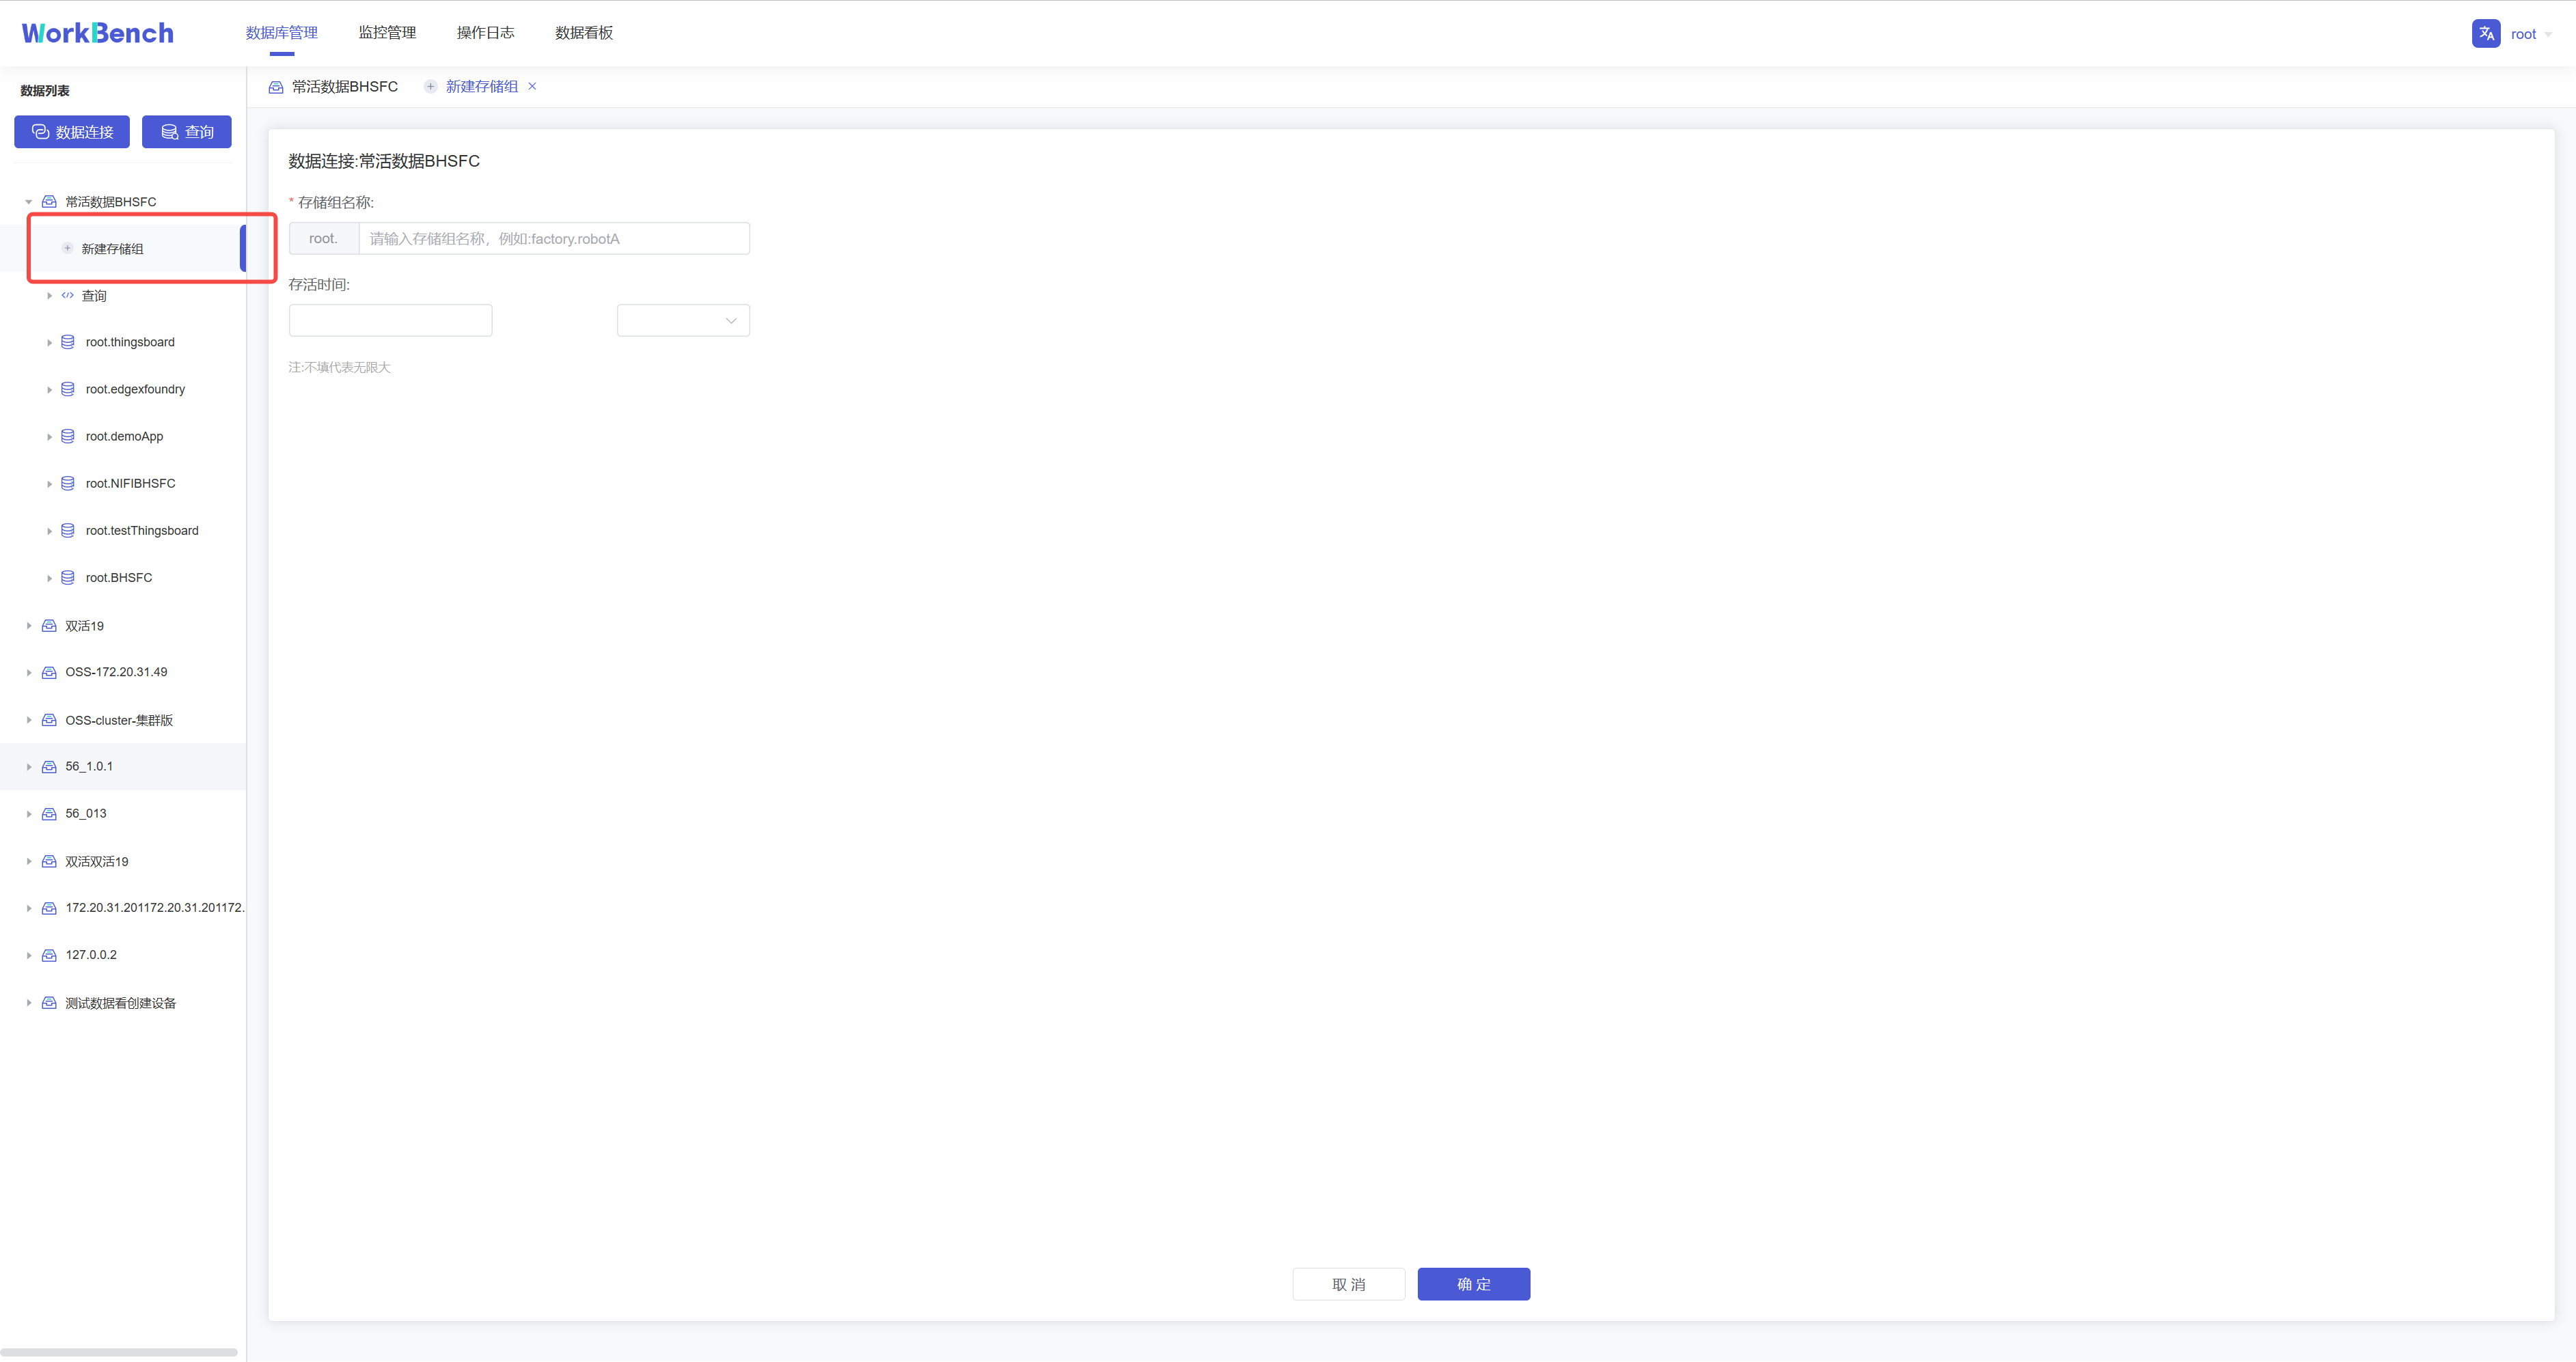
-**新增存储组**
+### Create a Storage Group
-在对象窗格中选择要操作的数据库对象,点击"**新建存储组**"即可创建存储组,存储组名称为必填,存储组名称为必填,正常情况下只能输入字母、数字、下划线以及UNICODE
-中文字符如果包含特殊字符,请使用反引号。存活时间选填。
+Select the database object to be operated in the object pane, and click "**New
Storage Group**" to create a storage group. The storage group name is required,
and the storage group name is required. Under normal circumstances, only
letters, Numbers, underscores, and UNICODE are allowed. If Chinese characters
contain special characters, please use backticks. Survival time is optional.
-**删除存储组**
+### Delete Storage Groups
-在对象窗格中选择要操作的存储组,在操作列中选择"**编辑**"可修改存储组存活时间,选择"**删除**"可删除存储组。
+Select the storage group to be operated in the object pane, select "**Edit**"
in the operation column to modify the survival time of the storage group, and
select "**Delete**" to delete the storage group.
-## 设备及物理量管理
+## Equipment and Physical Quantity Management
-**新建物理量**
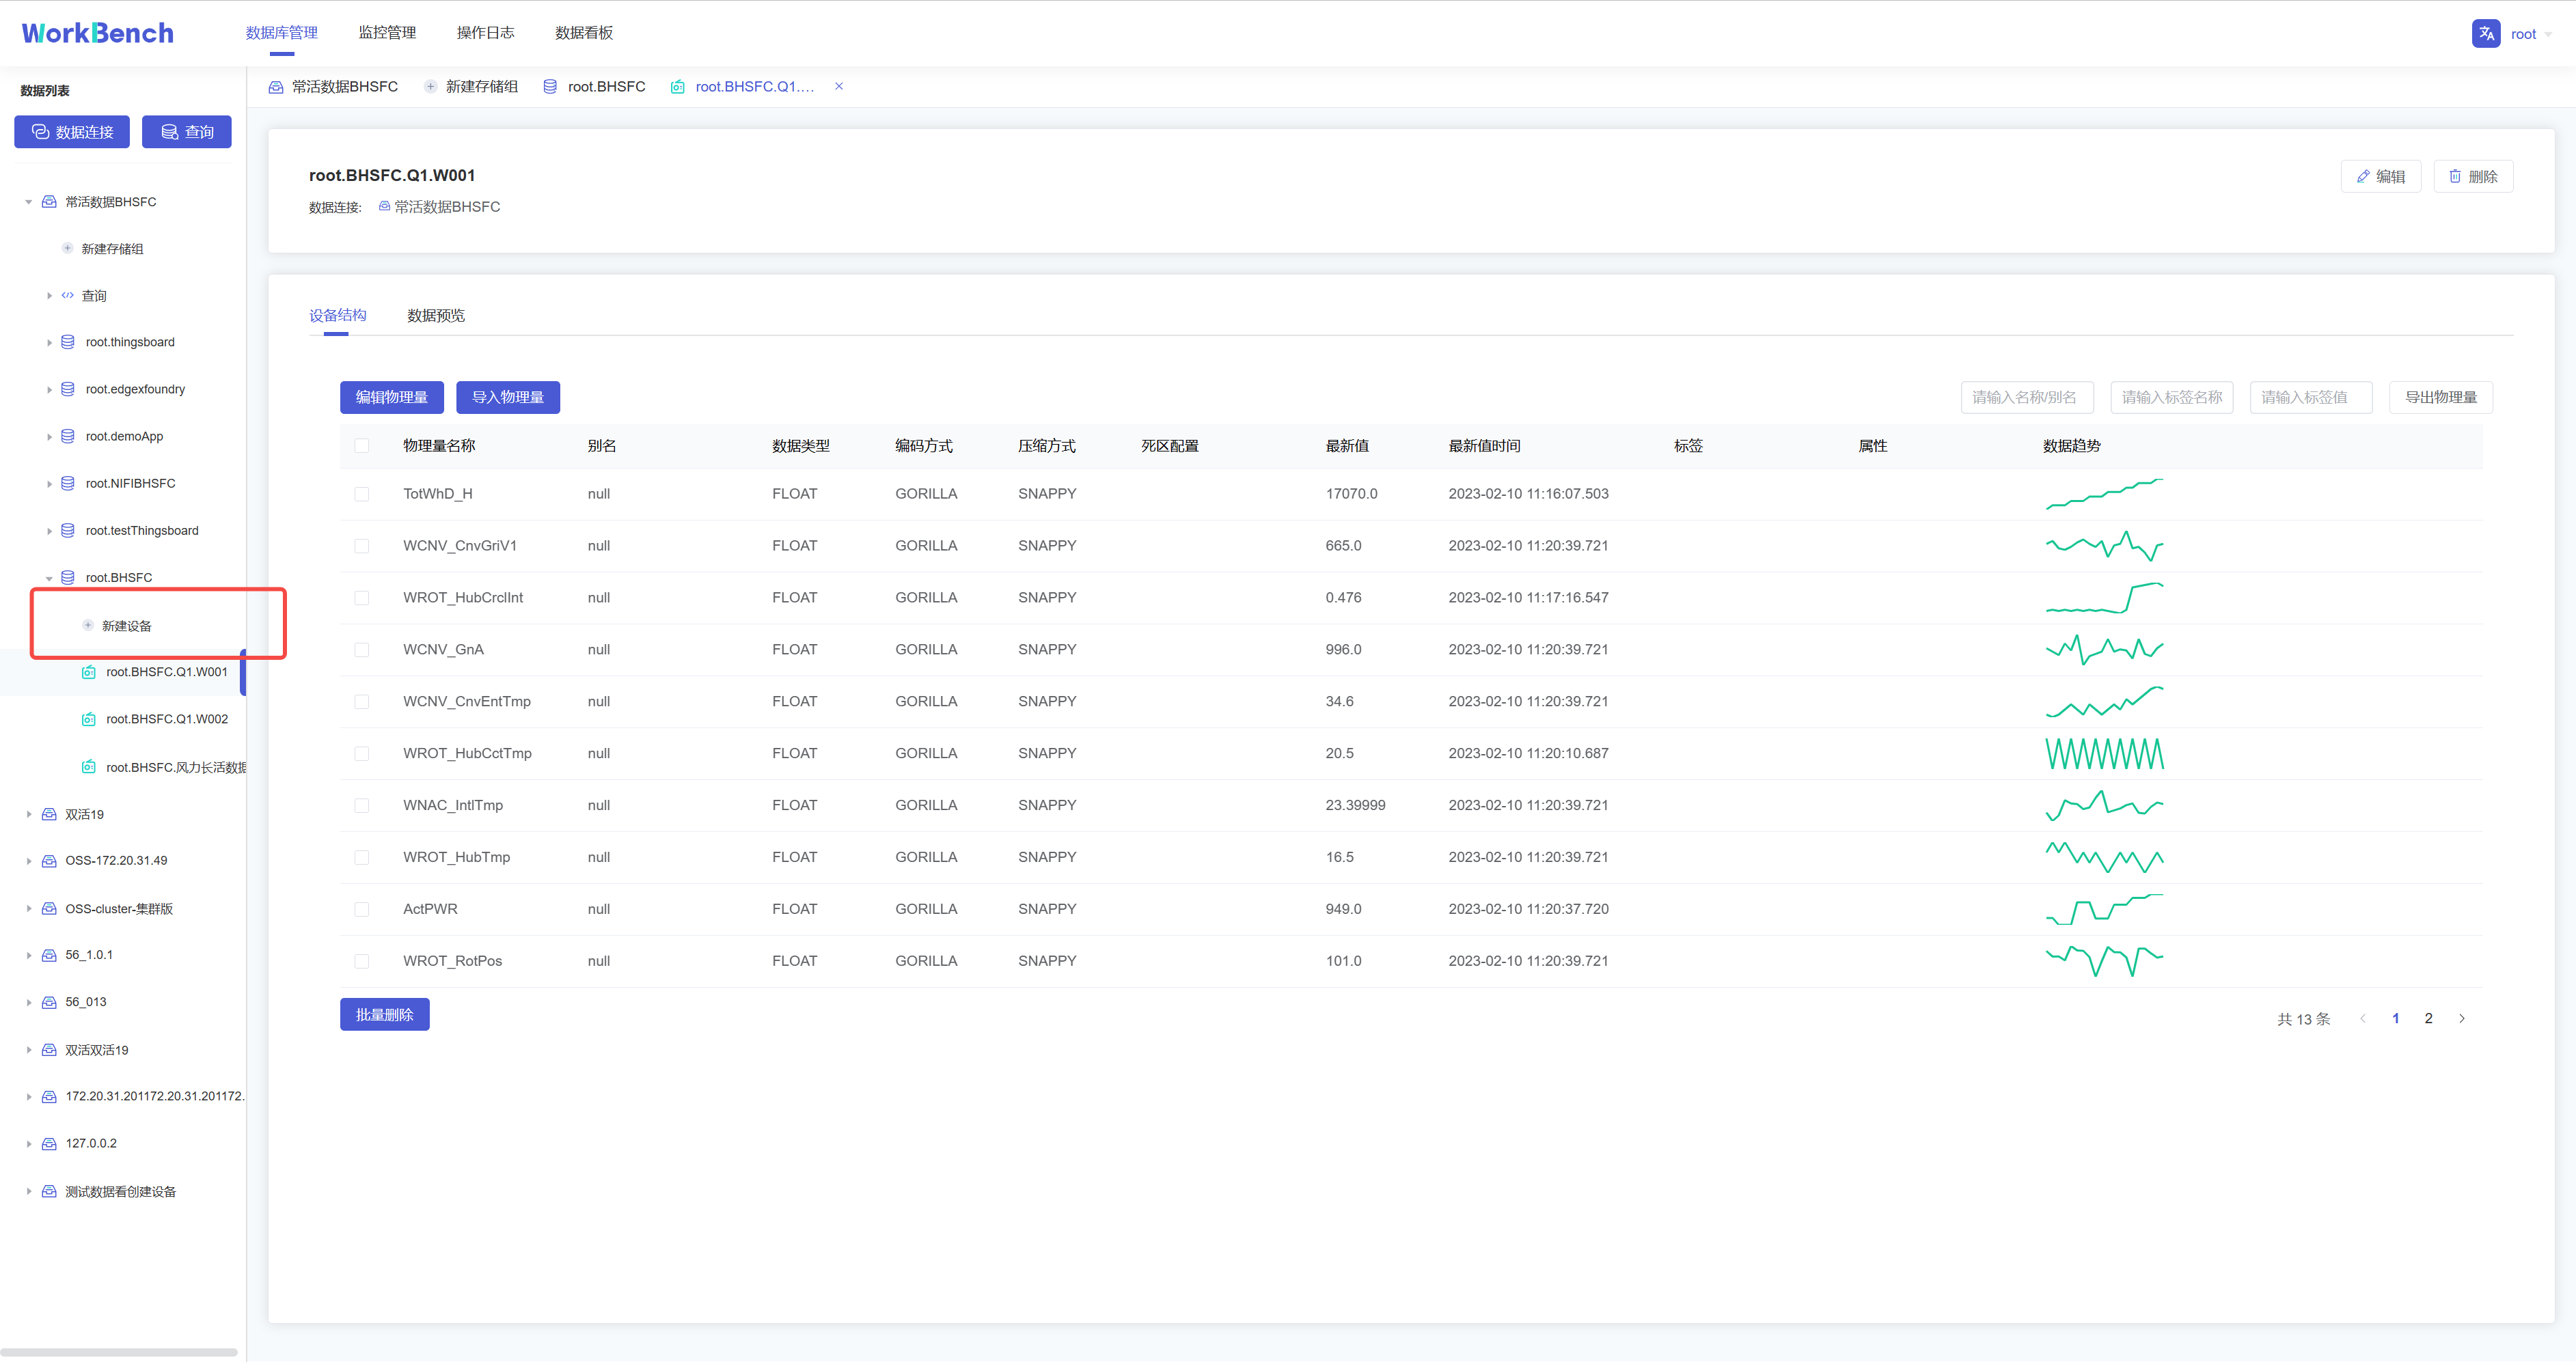
+### Create Physical Quantities
-在对象窗格中选择要操作的存储组,点击"**新建设备**",按要求填写信息则可创建该存储组下的物理量。物理量名称名称为必填,正常情况下只能输入字母、数字、下划线以及UNICODE
-中文字符如果包含特殊字符,请使用反引号。
+Select the storage group to be operated in the object pane, click "**New
Device**", and fill in the information as required to create the physical
quantity under the storage group. The name of the physical quantity is
required. Under normal circumstances, only letters, numbers, underscores and
UNICODE are allowed. If Chinese characters contain special characters, please
use backticks.
-**数据趋势预览**
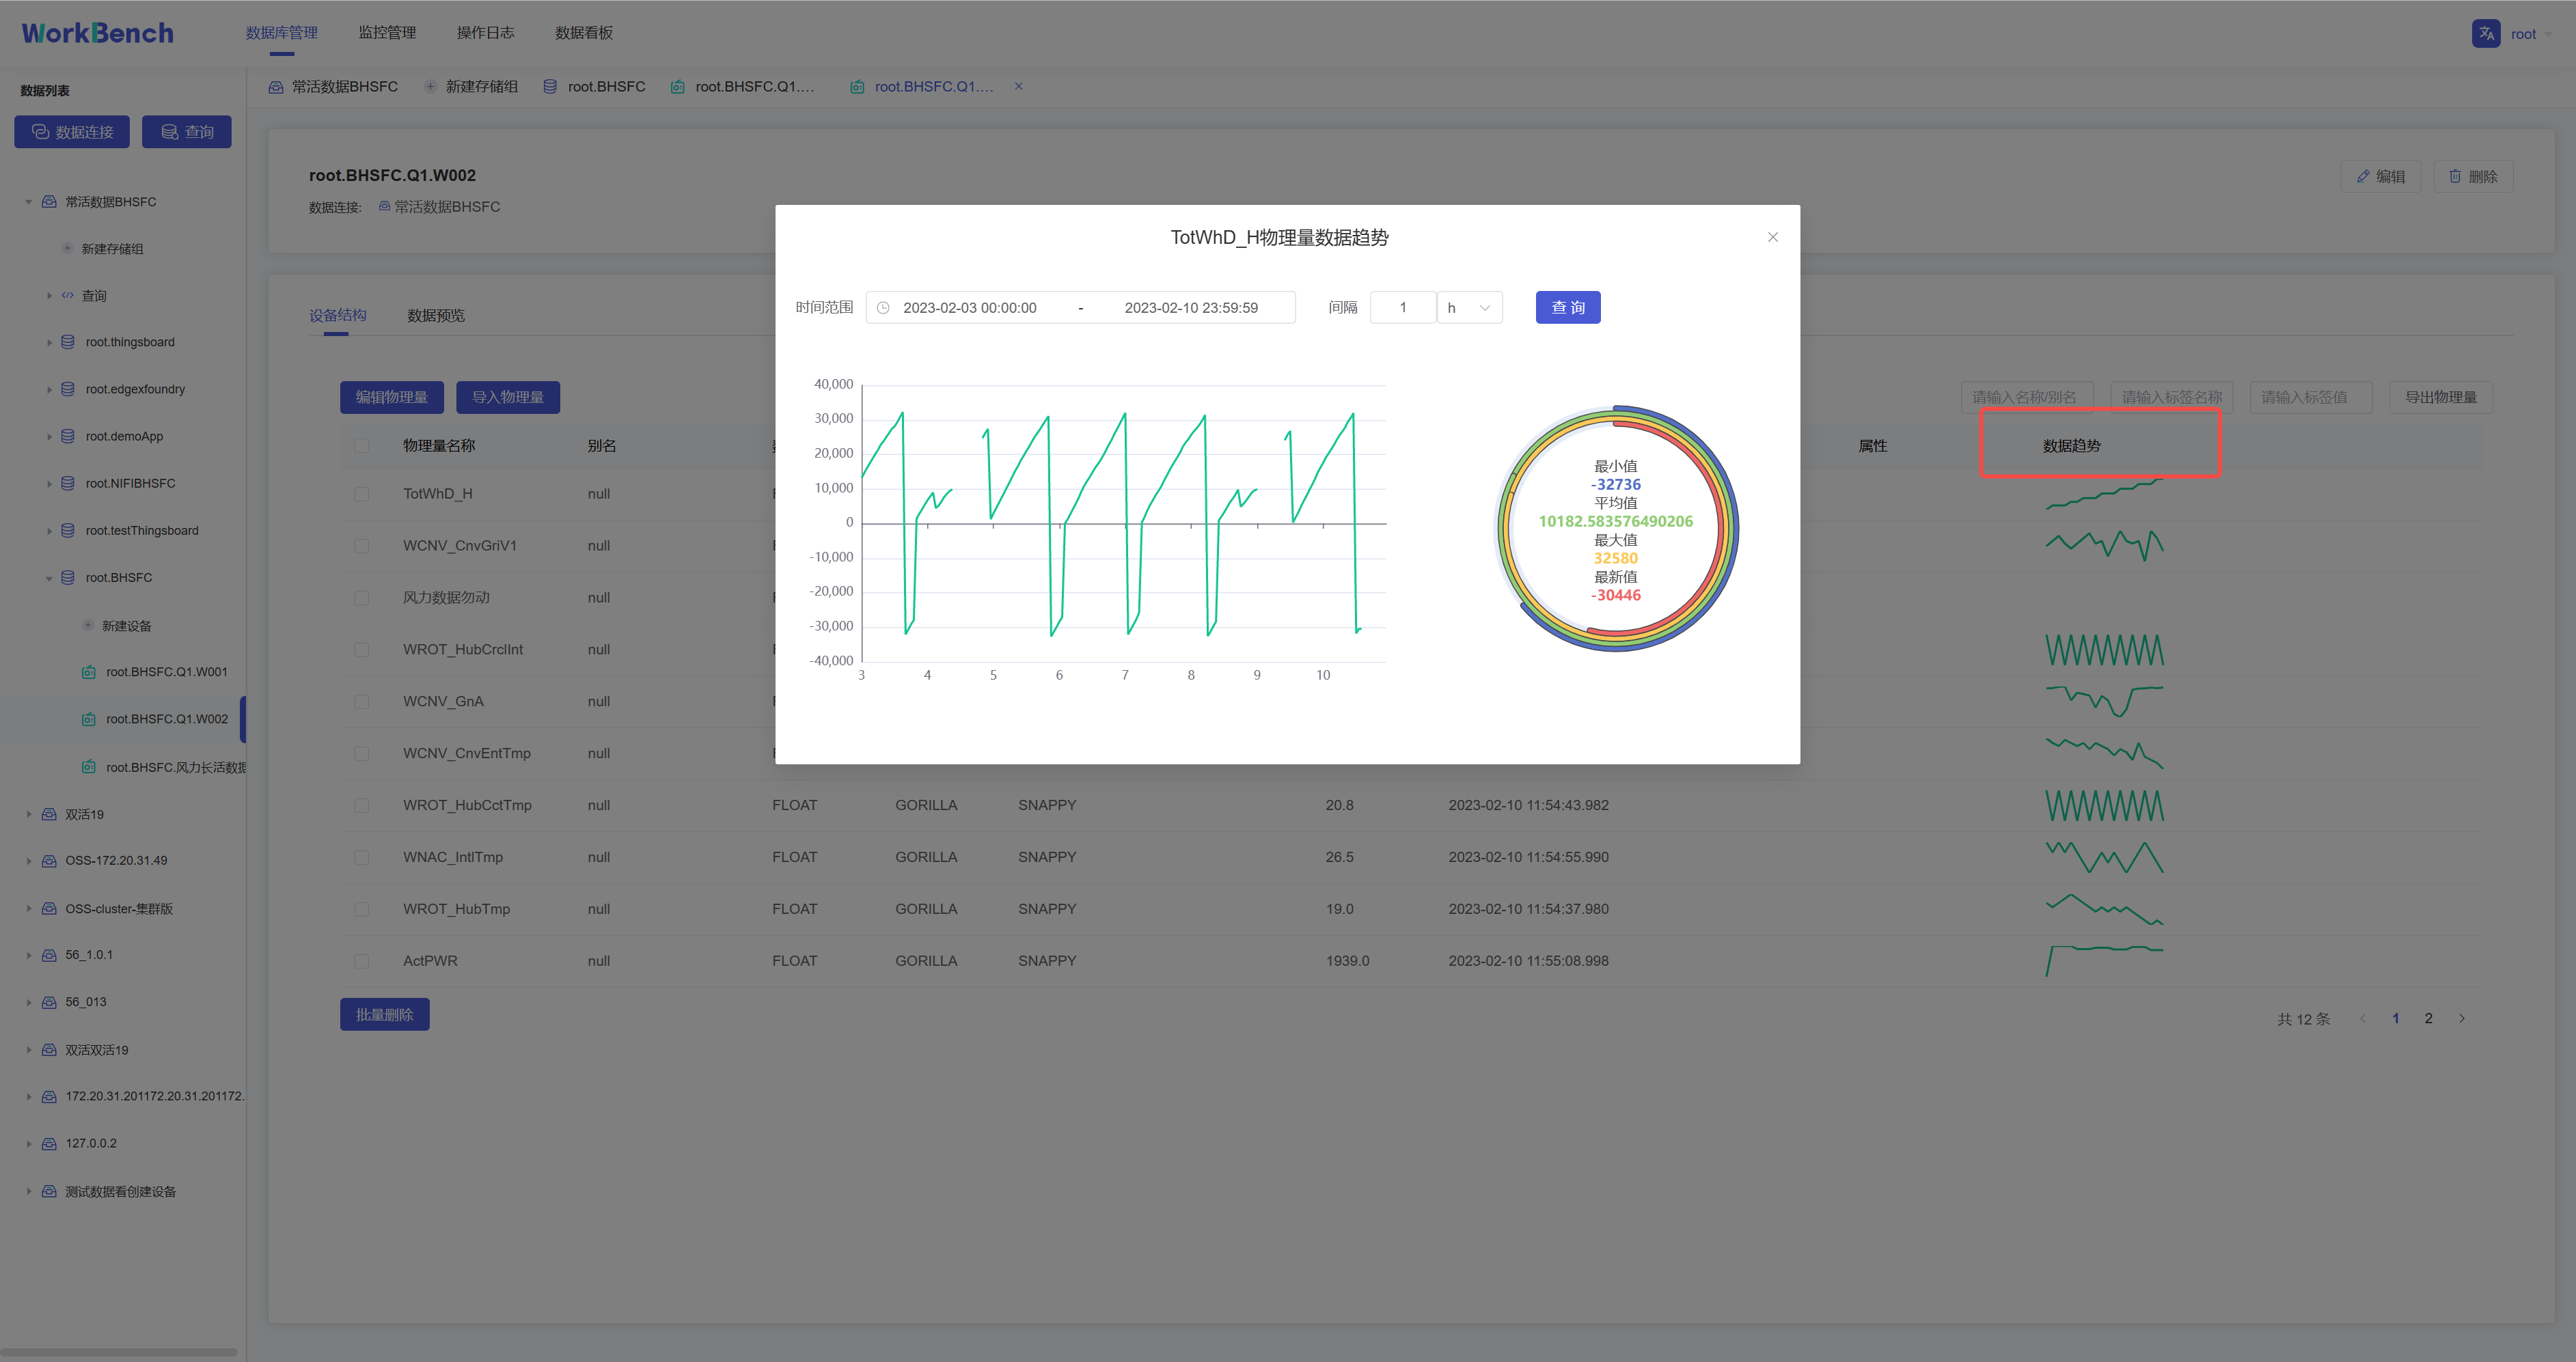
+### Data Trend Preview
-"数据趋势"功能仅在企业版中支持。在对象窗格中选定存储组,"**数据趋势**"显示该存储组下的物理量趋势图表,单击图表显示详细信息,可选定时间范围查询该区间内的数据,并显示最小值等数据
+The "Data Trending" feature is only supported in the Enterprise Edition.
Select a storage group in the object pane, "**Data Trend**" displays the
physical quantity trend chart under the storage group, click the chart to
display detailed information, you can select the time range to query the data
in this interval, and display the minimum data such as value.
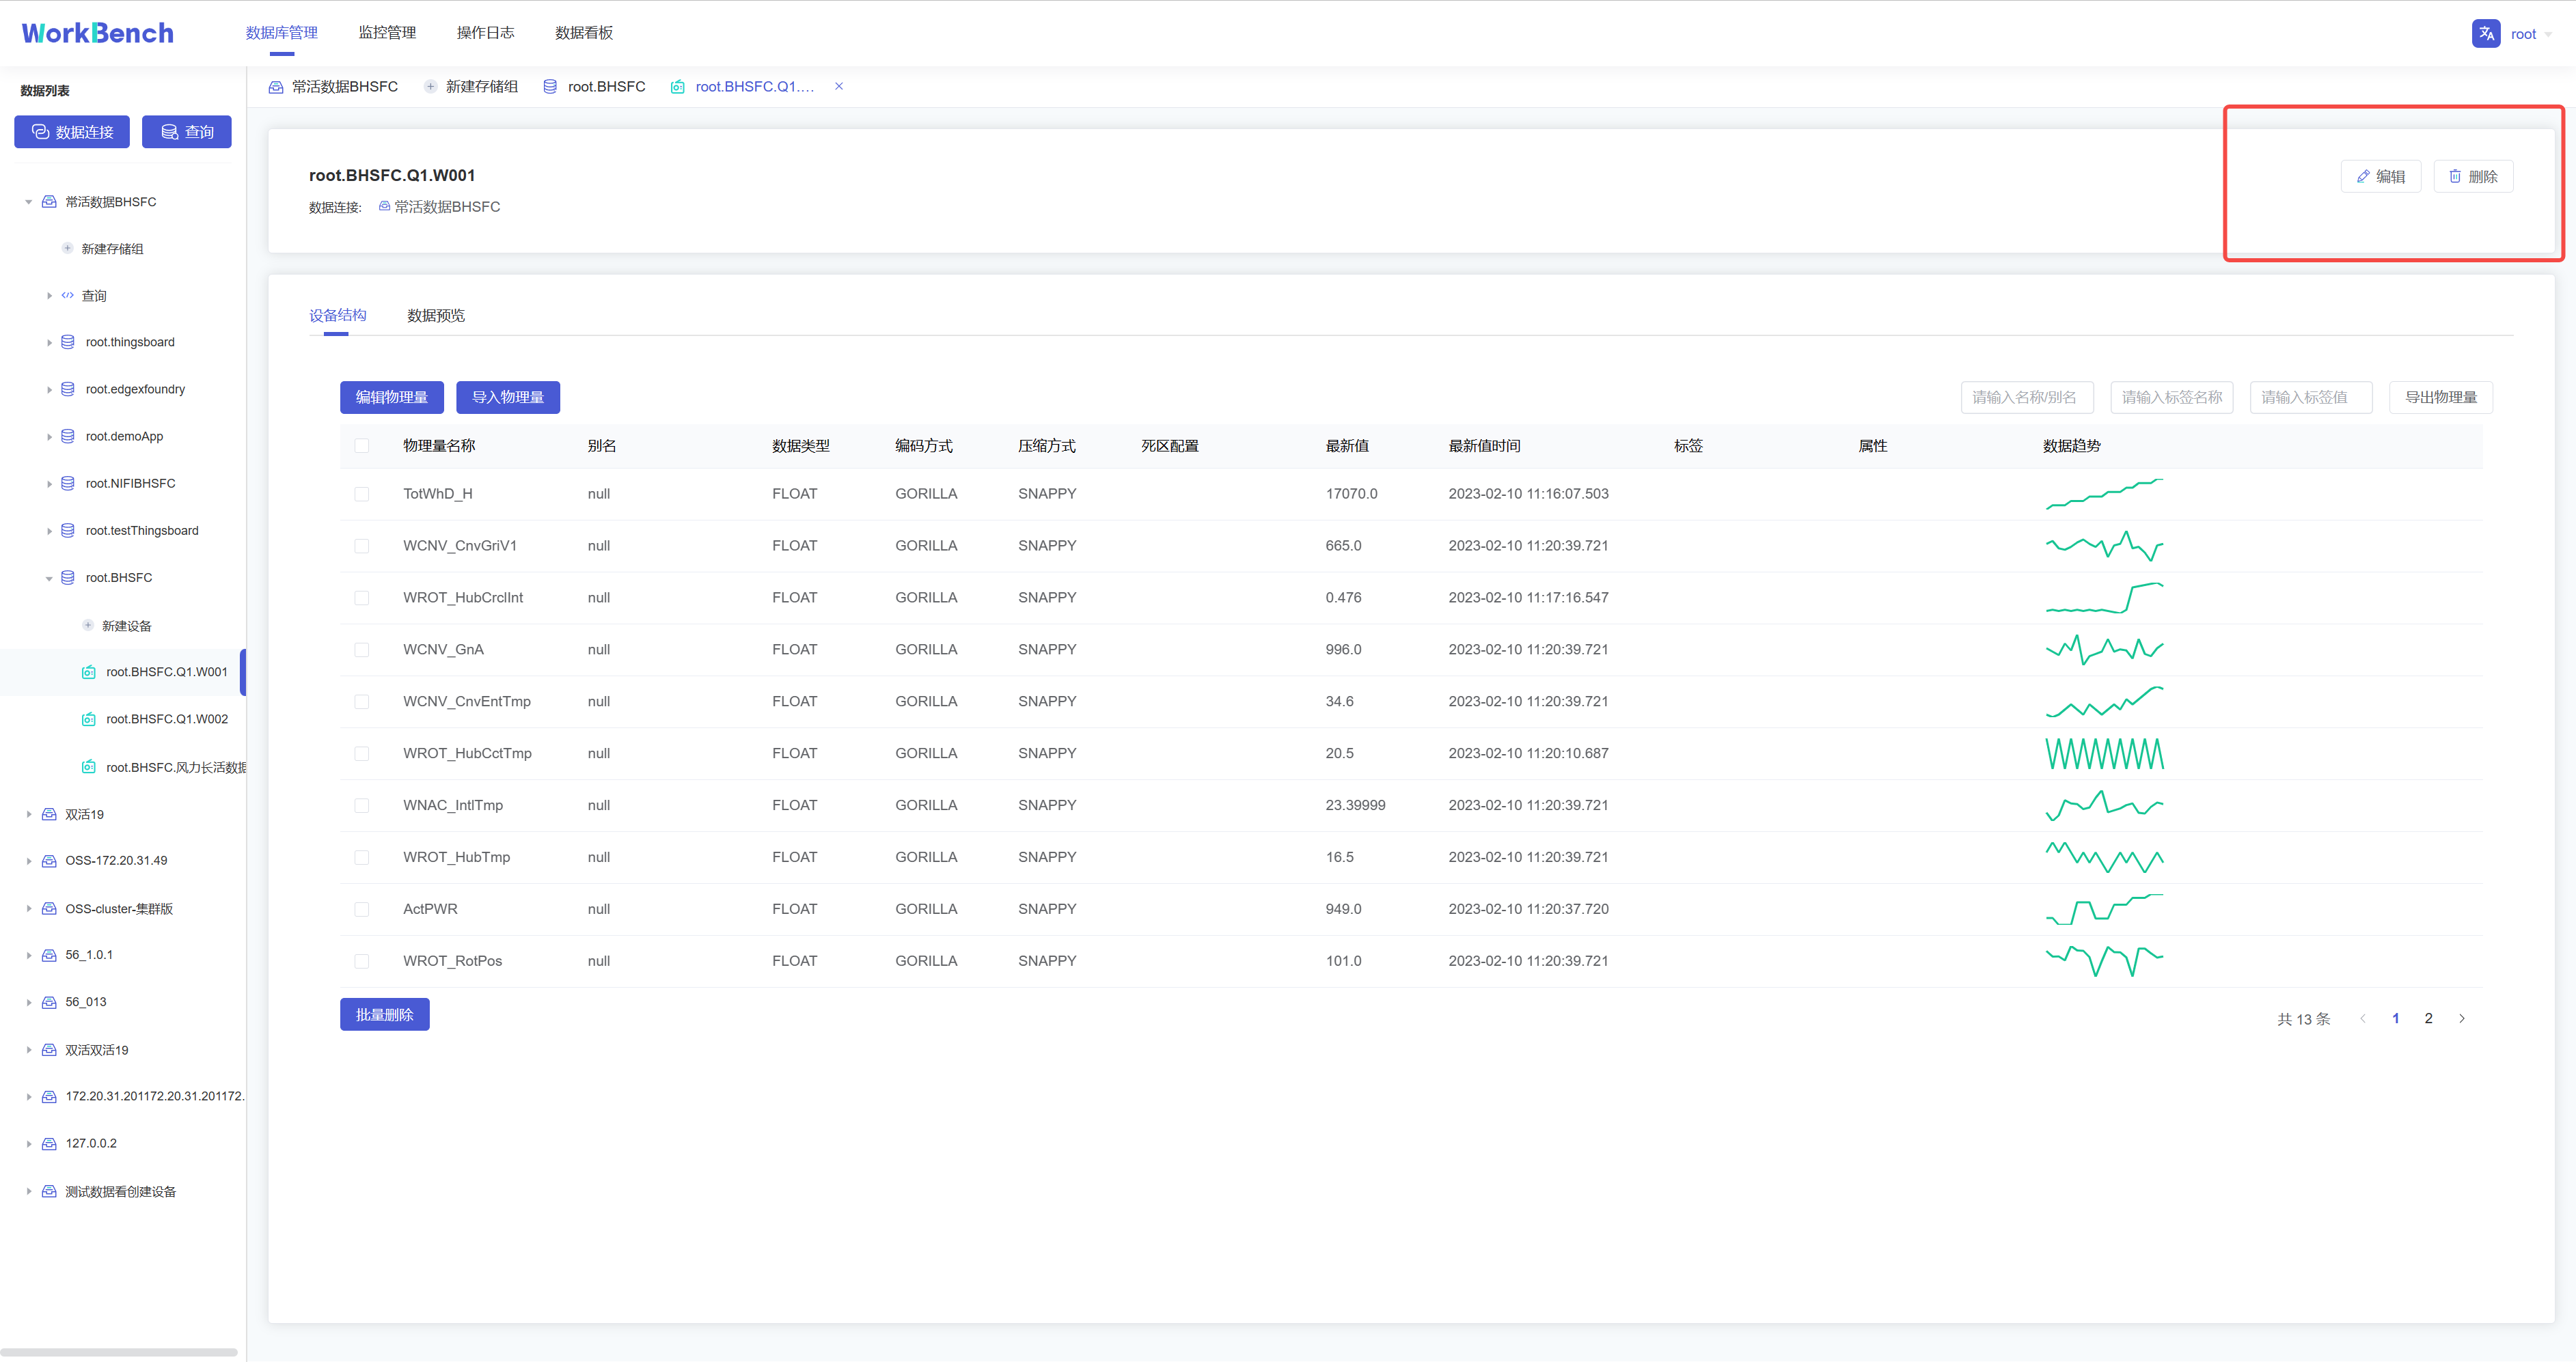
-**修改、删除物理量**
+### Modify and Delete Physical Quantities
-在对象窗格中选择要操作的设备
-,点击右侧的"**编辑**"可修改该设备下的物理量信息(别名、标签和属性)。点击"**删除**"则可删除该设备。
+Select the device to be operated in the object pane, and click "**Edit**" on
the right to modify the physical quantity information (alias, label and
attribute) under the device. Click "**Delete**" to delete the device.
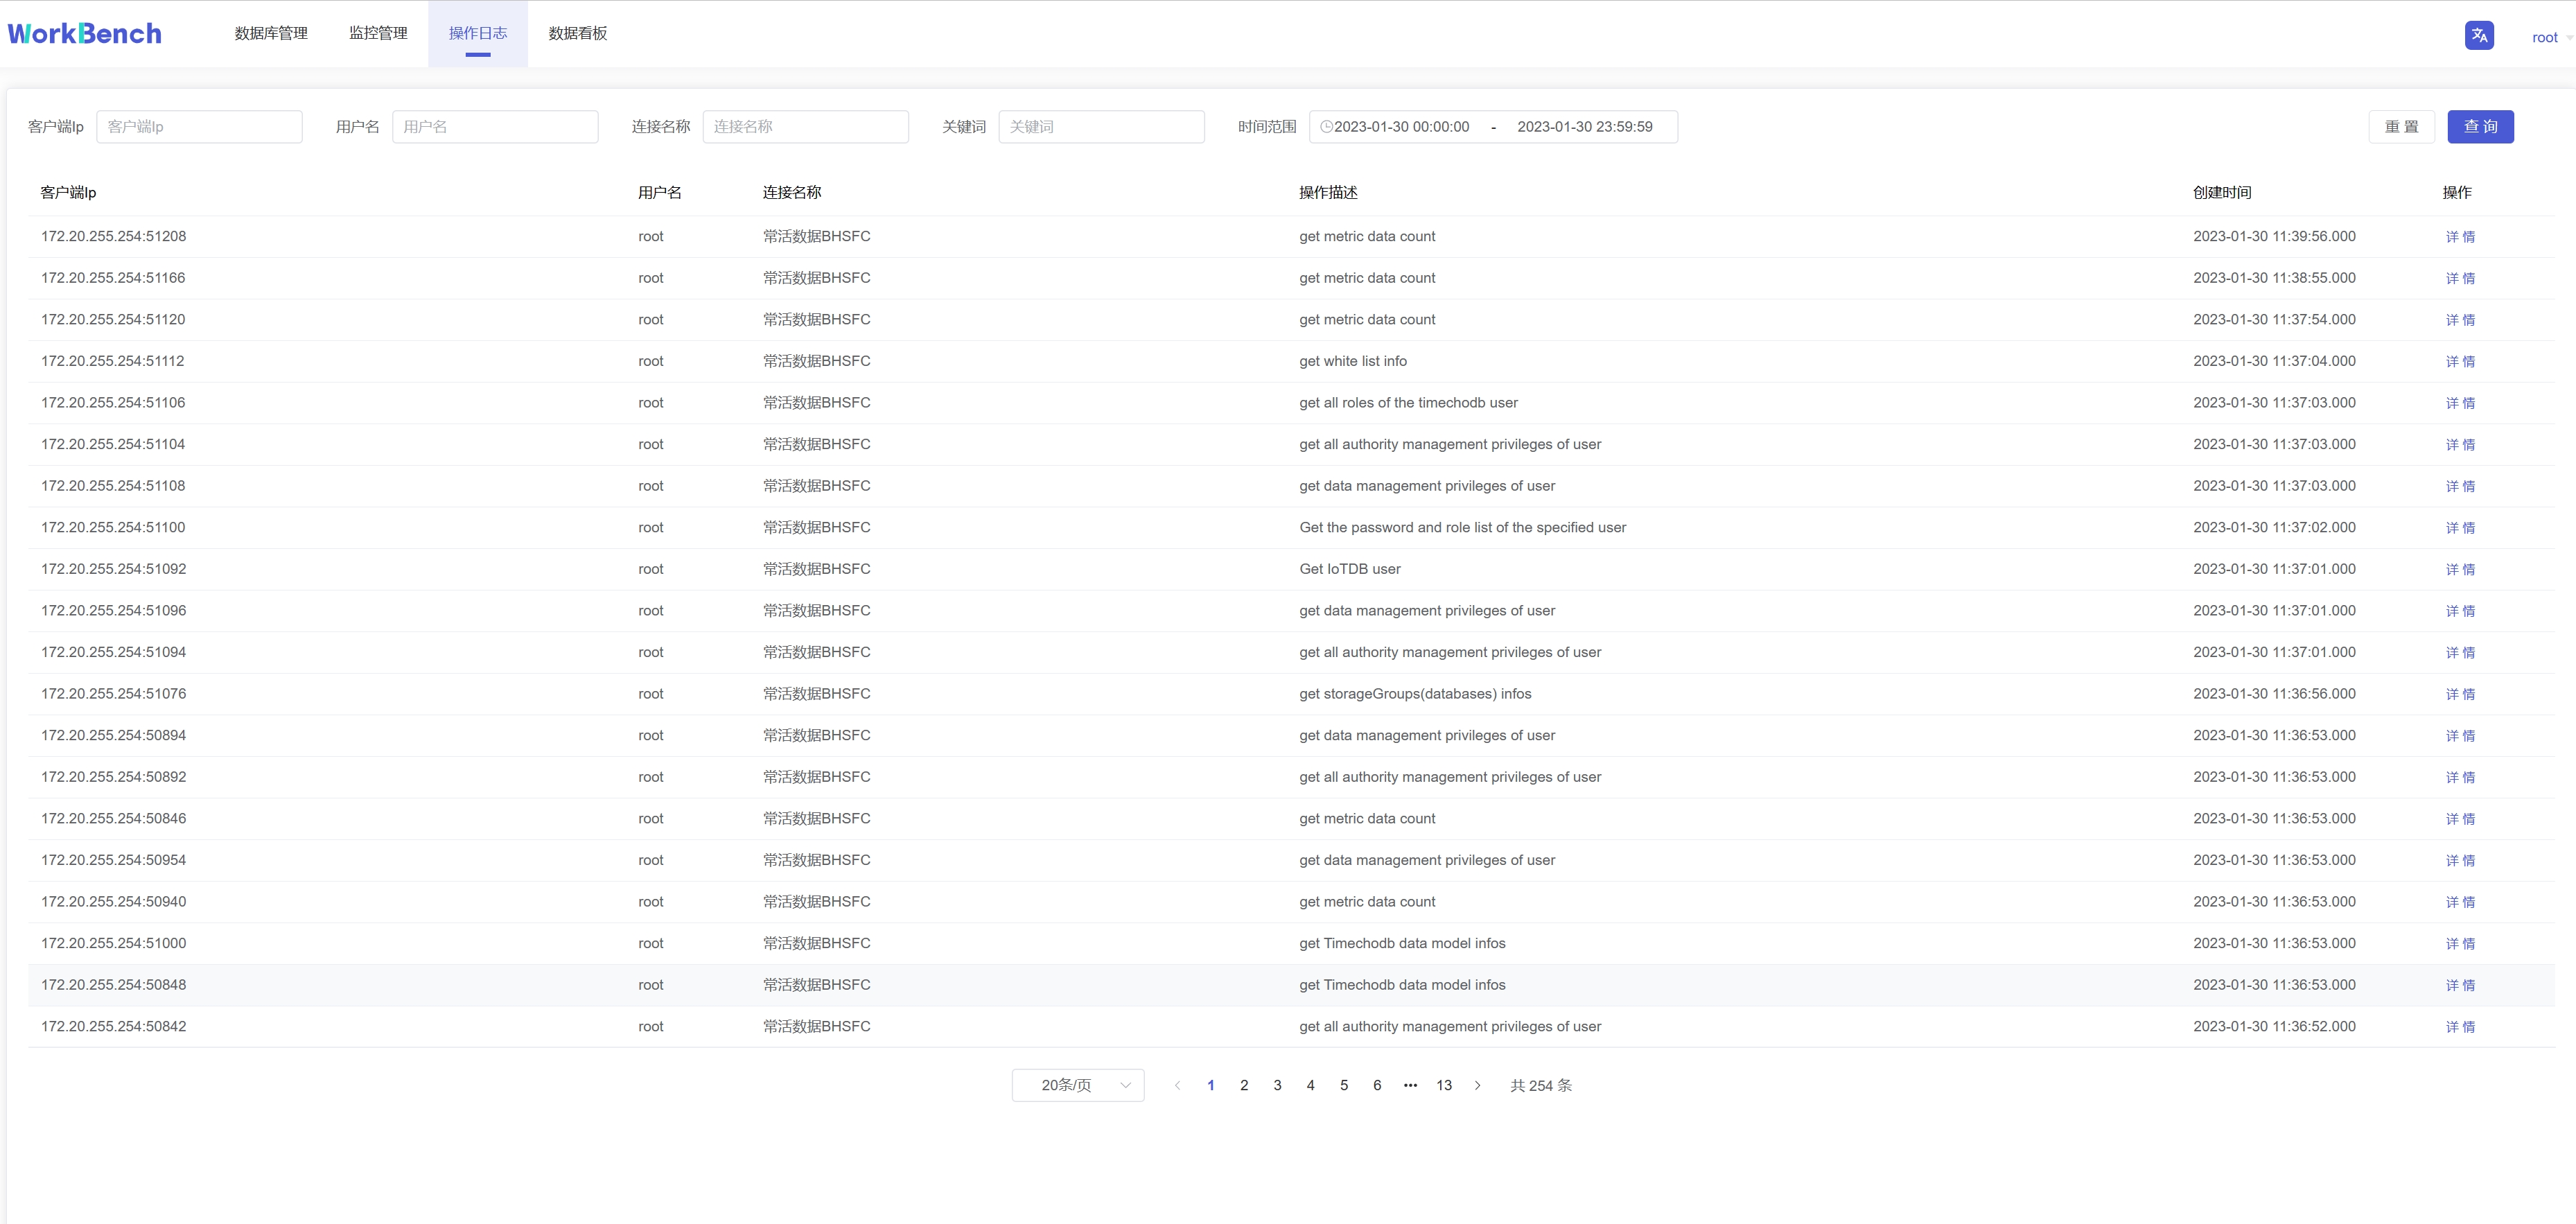
-## 操作日志
+## Operation Log
-"操作日志"提供所有在Workbench上进行的操作记录,可按IP、用户、数据连接、关键词和时间范围进行筛选。
+"Operation Log" provides all operation records on Workbench, which can be
filtered by IP, user, data connection, keyword and time range.
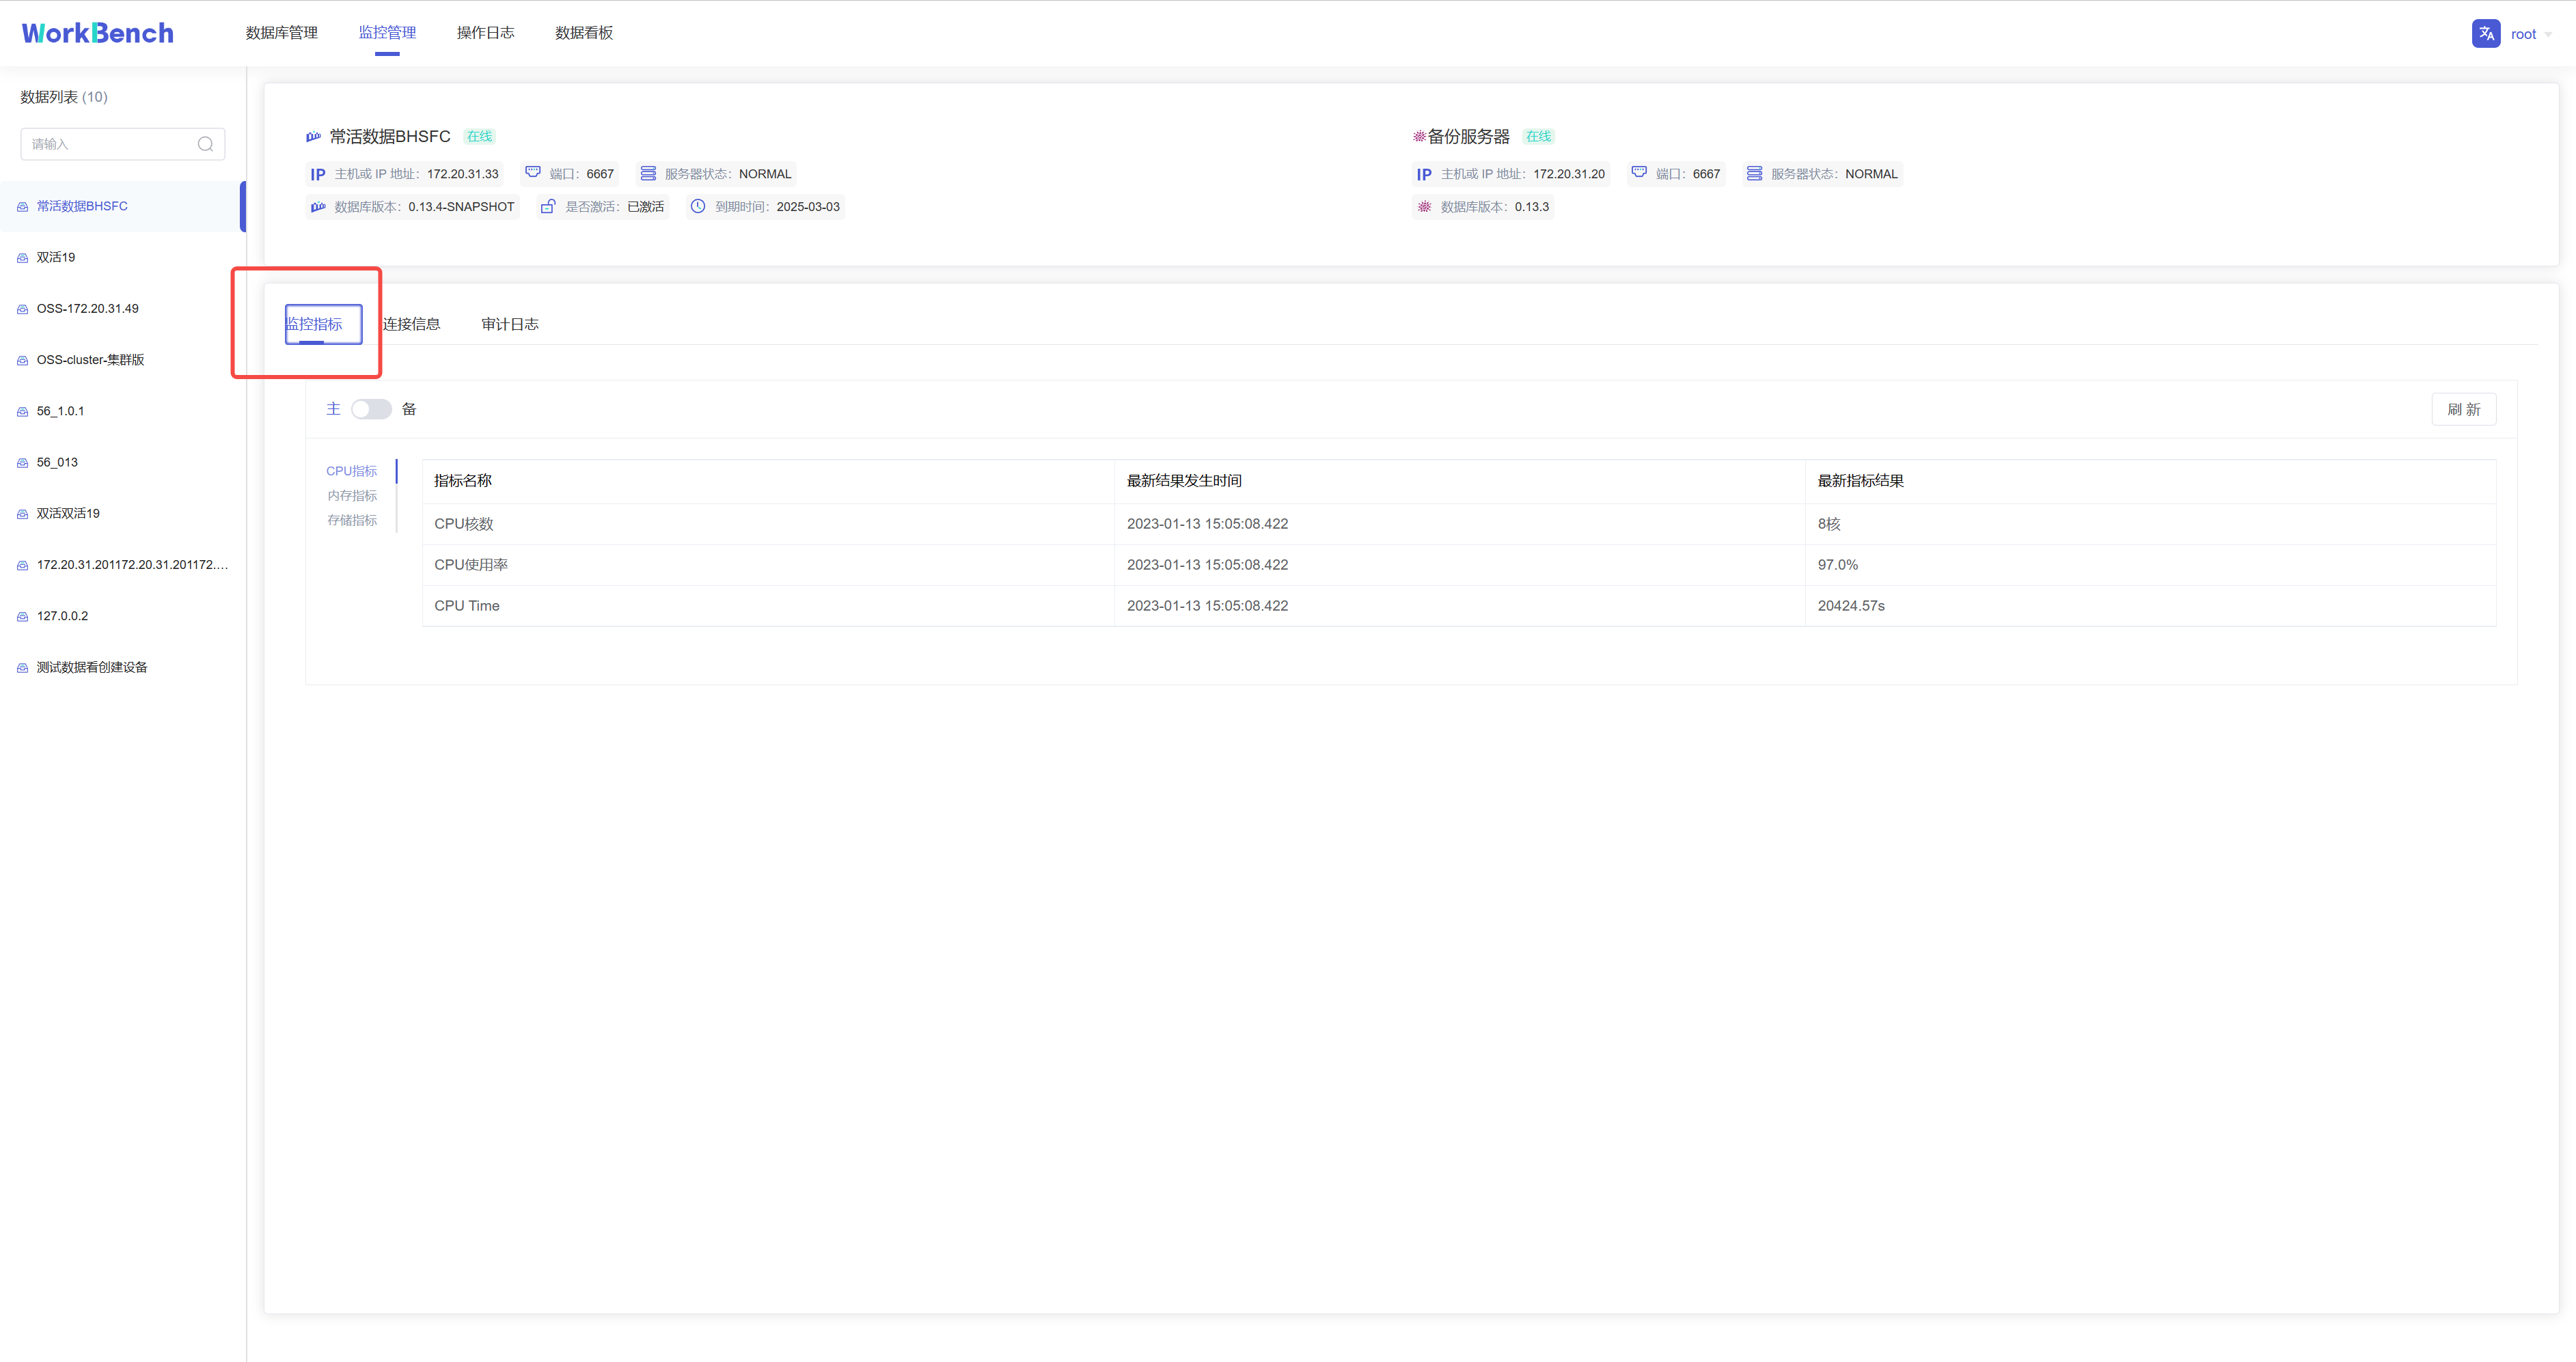
-## 监控管理
+## Monitoring Management
-Workbench提供"**监控管理**"提供来查看已选择的服务器监控属性。从导航栏选择"**监控管理**"并选择你想要的监控类型。可选"**监控指标**","**连接信息**","**审计日志**"。
+Workbench provides "**Monitoring Management**" to view the selected server
monitoring properties. Select "**Monitoring Management**" from the navigation
bar and select the type of monitoring you want. Optional "**Monitoring
Indicators**", "**Connection Information**", "**Audit Log**".
-**监控指标**
+### Monitoring Metrics
-监控指标可供查看CPU指标、内存指标和存储指标的最新信息。
+Monitoring metrics can be used to view the latest information on CPU
indicators, memory indicators, and storage indicators.
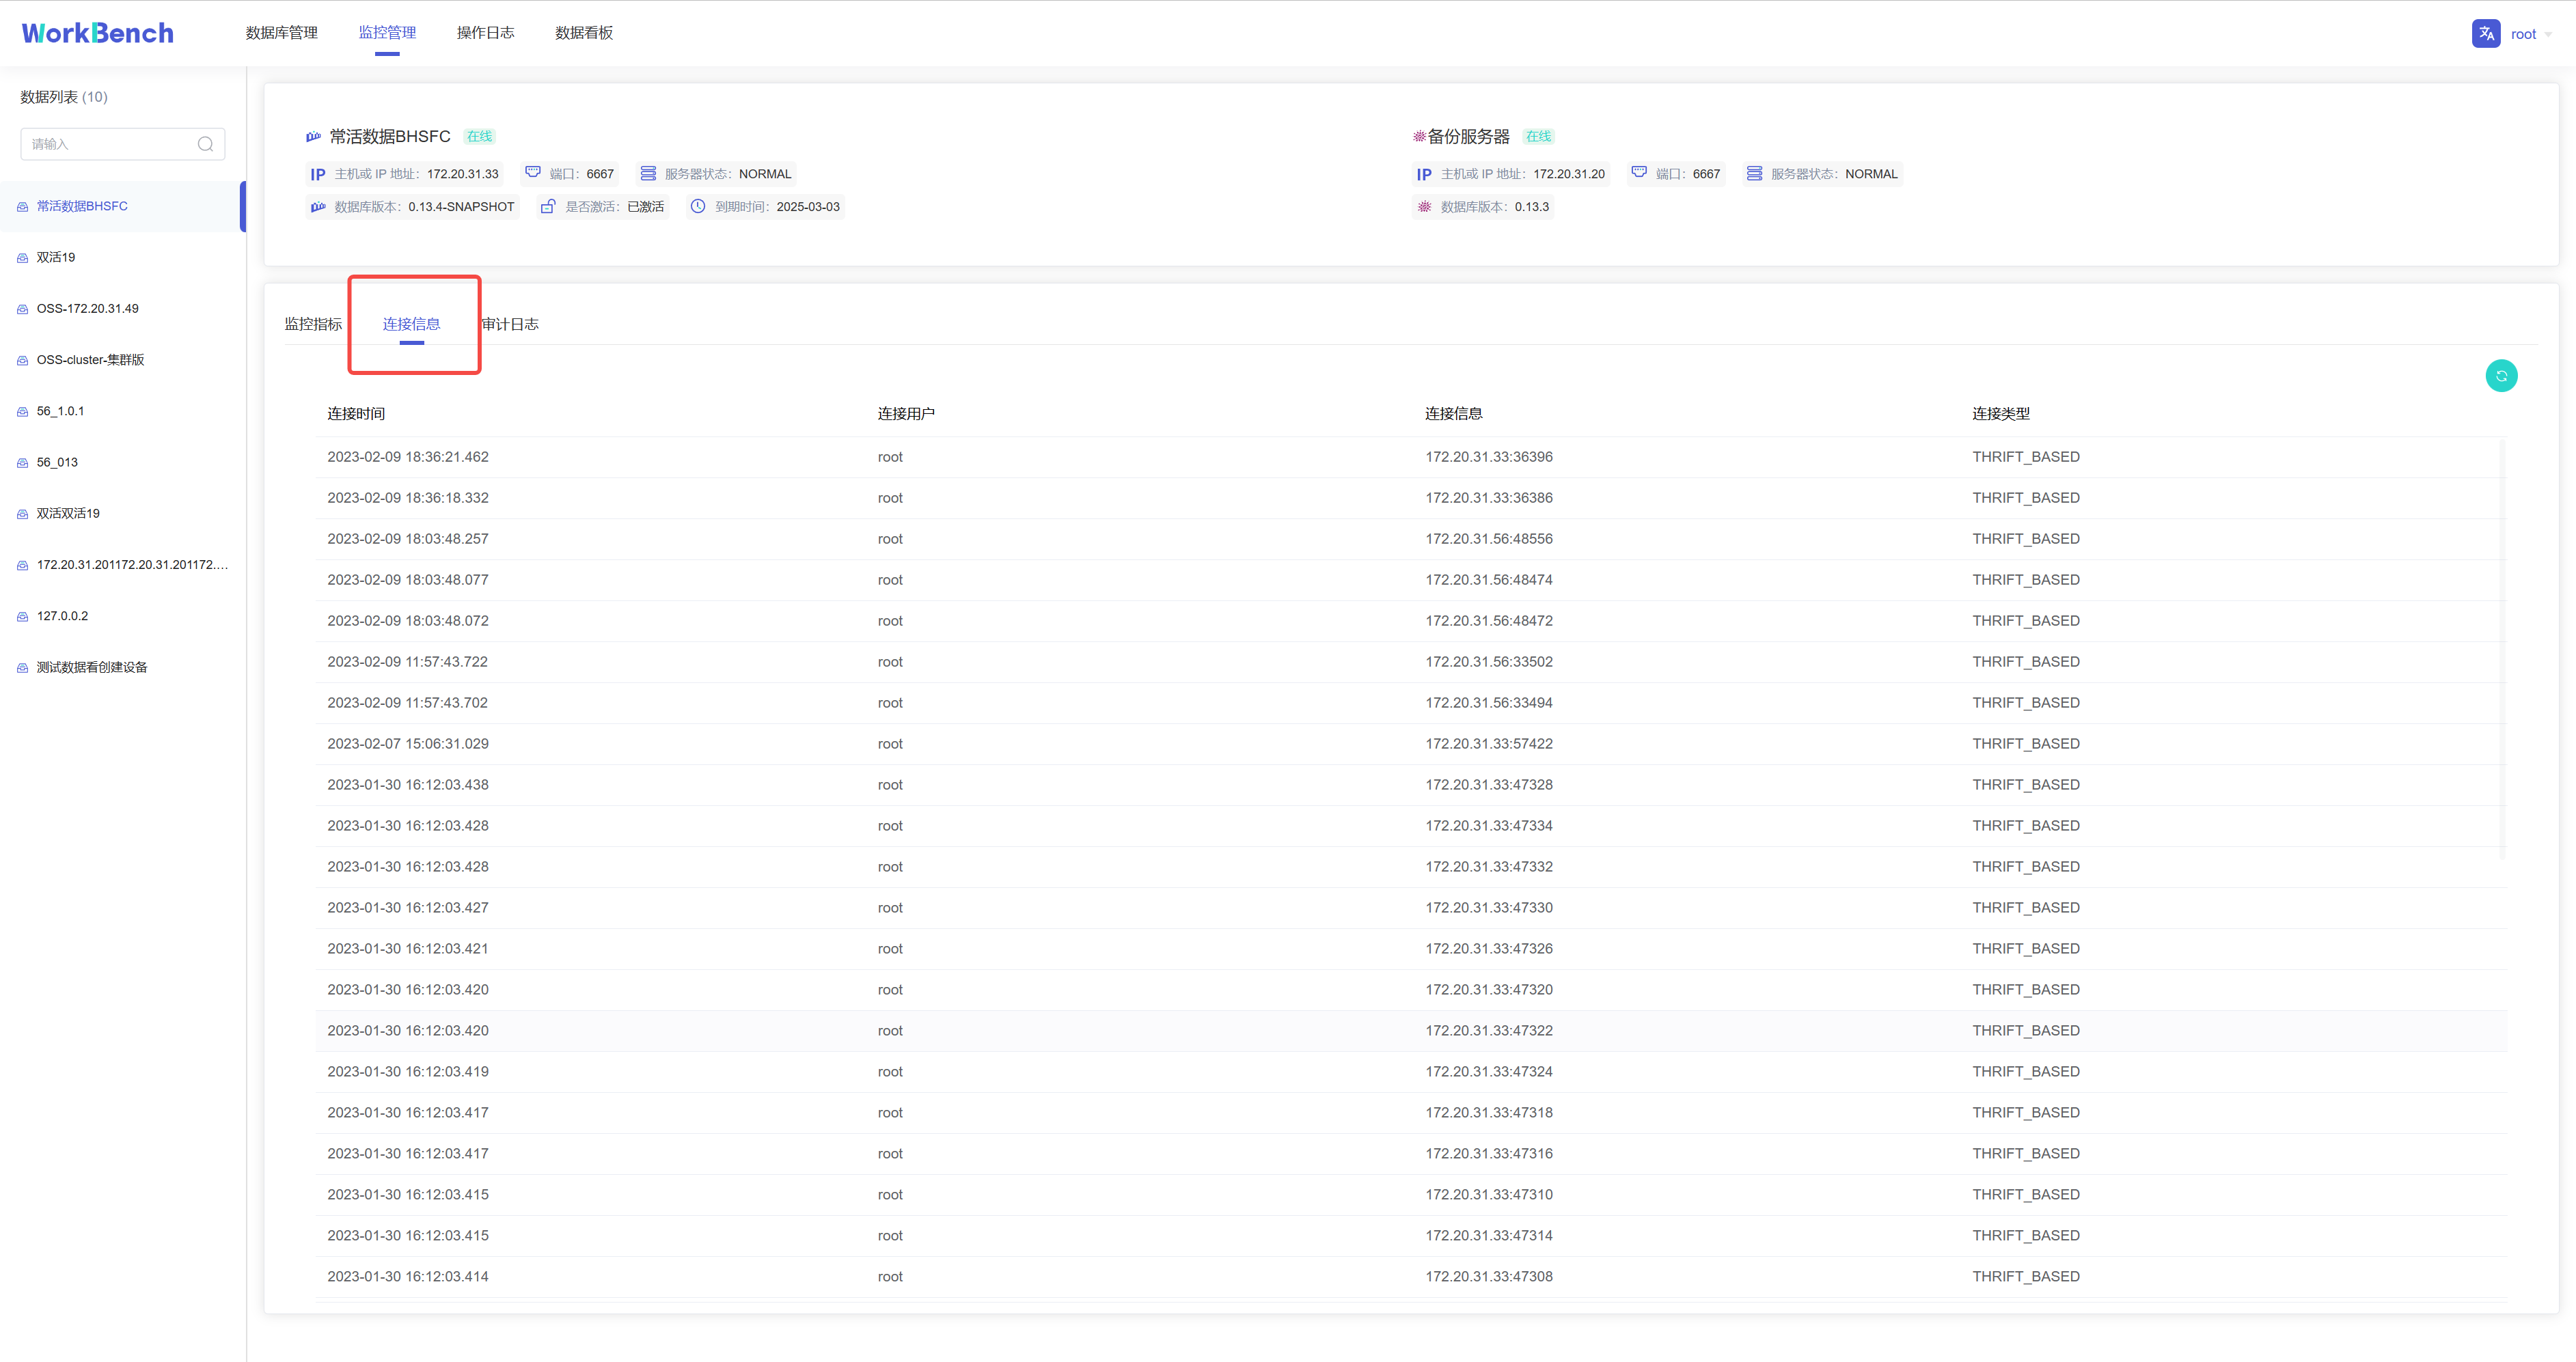
-**连接信息**
+### Connection Information
-连接信息可供查看连接到Workbench的用户和服务器信息。"连接信息"功能仅在企业版中支持。
+Connection information allows you to view information about users and servers
connected to the Workbench. The "Connection Information" feature is only
supported in the Enterprise Edition.
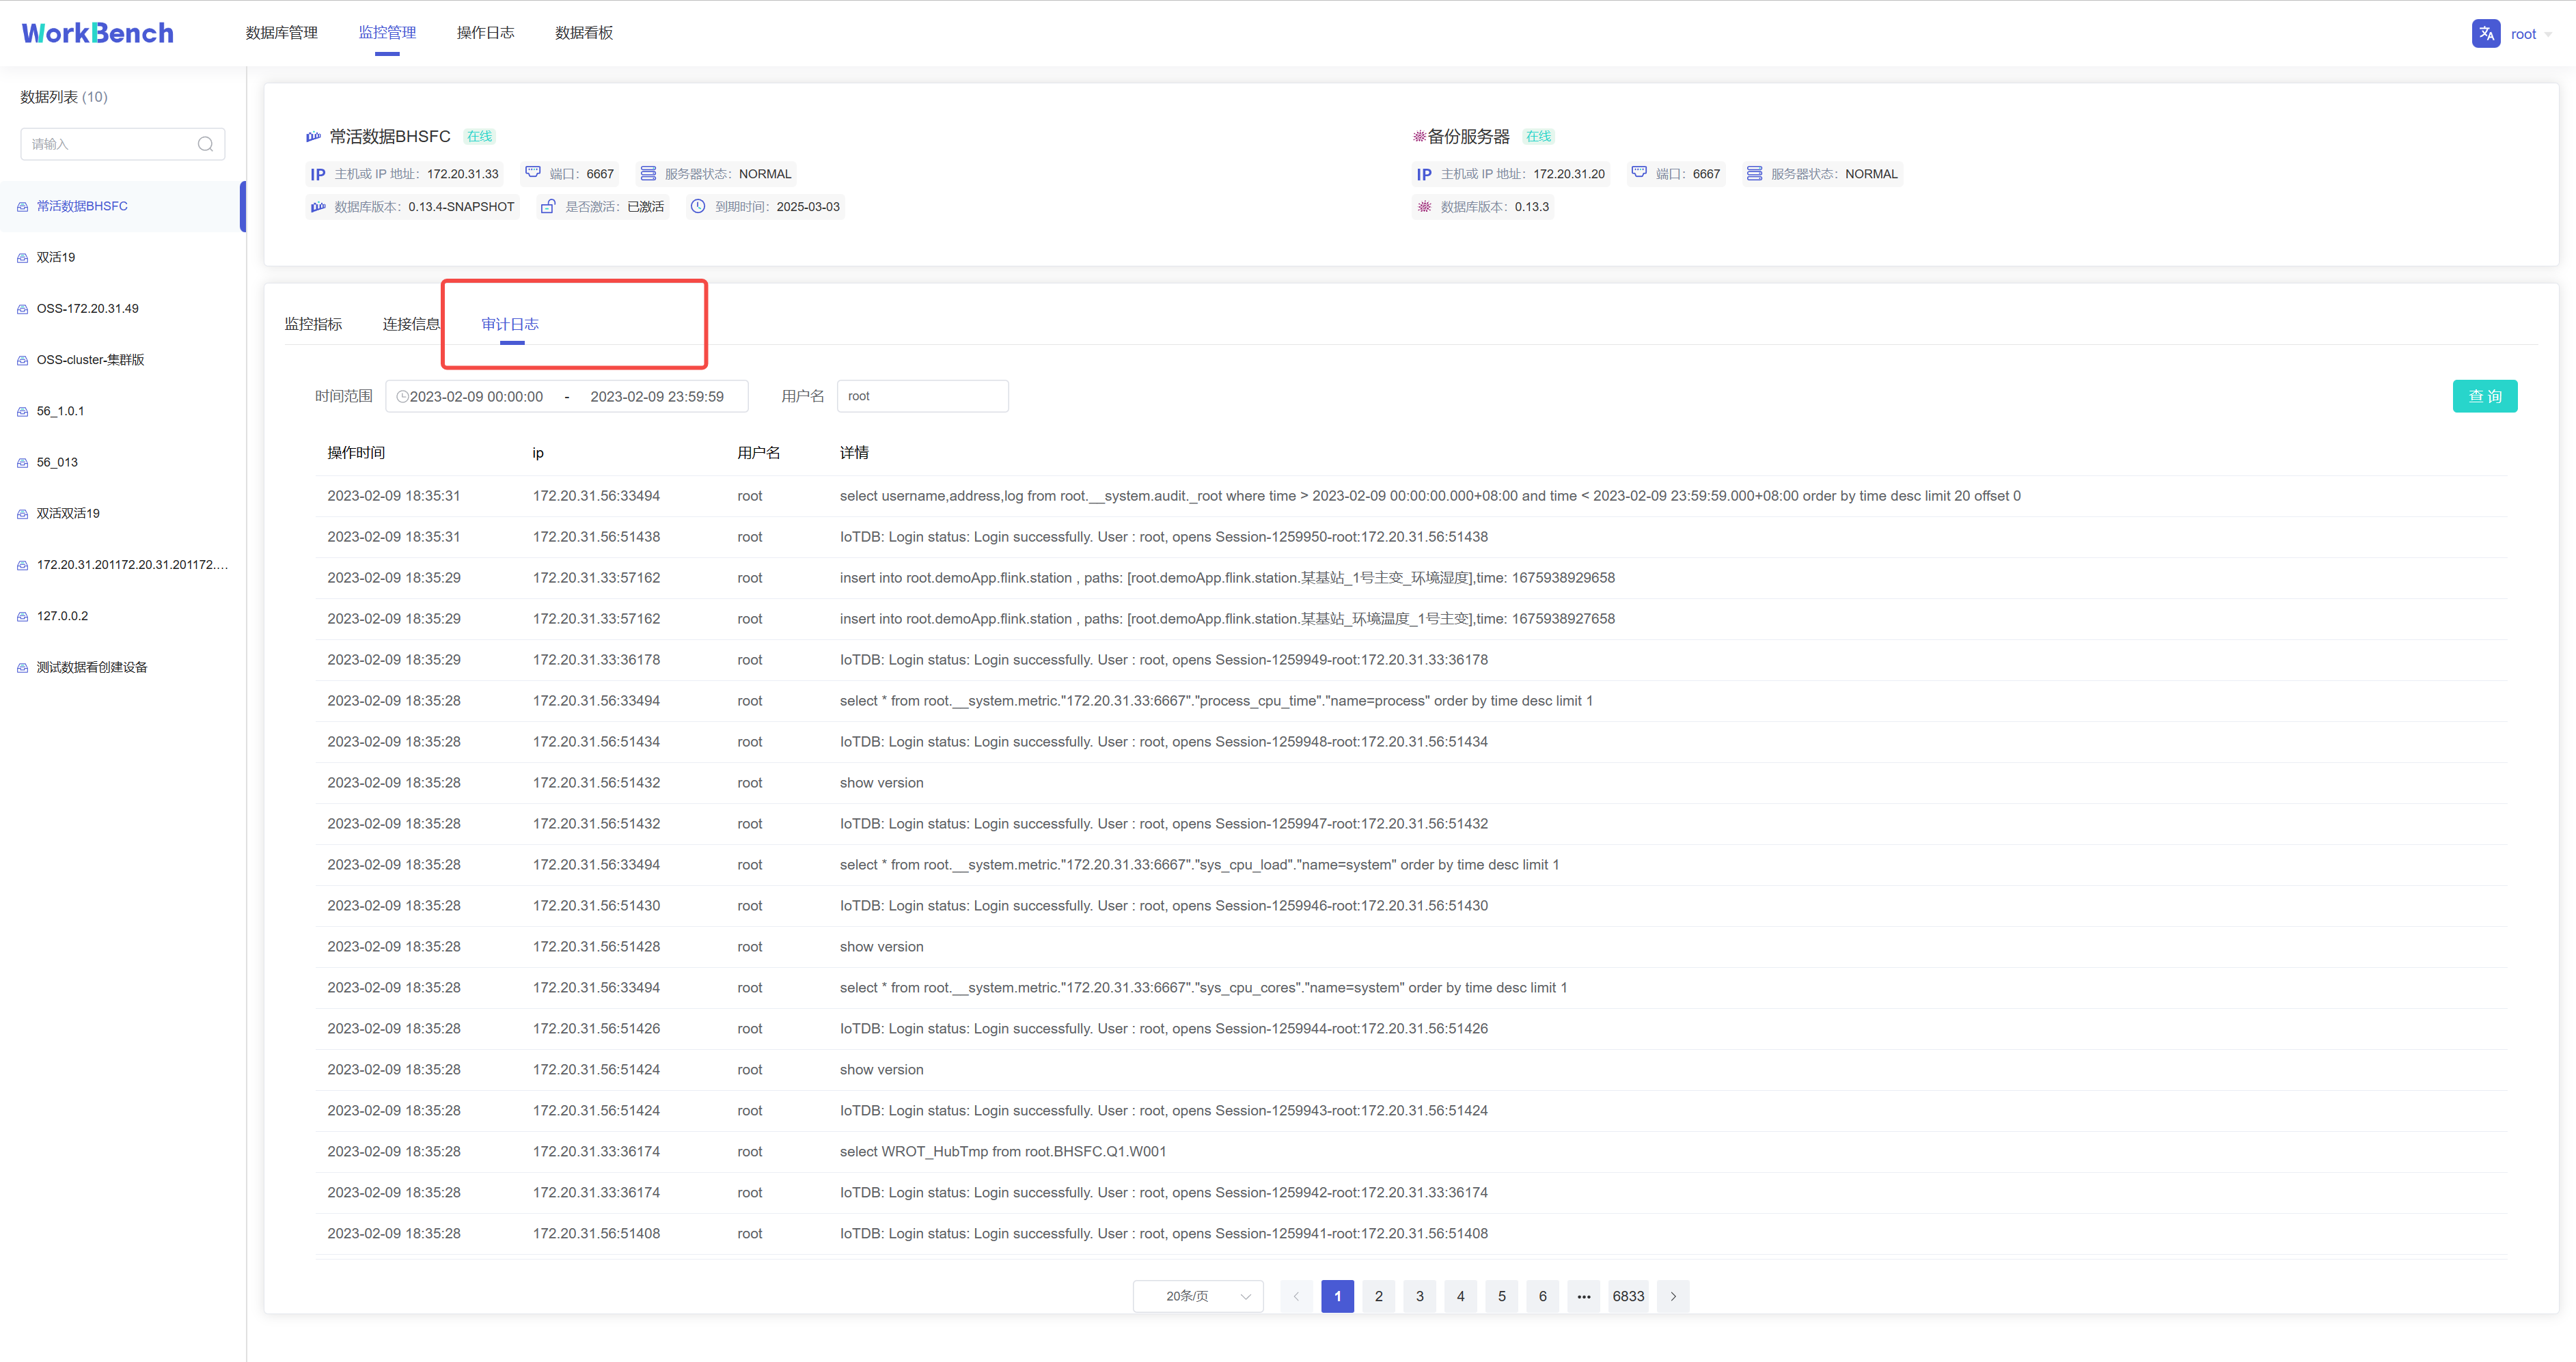
-**审计日志**
+### Audit Log
-审计日志显示所有在IoTDB执行的操作,Workbench提供查询接口,可按时间段或用户名进行查询。"审计日志"功能仅在企业版中支持。
+The audit log shows all operations performed in IoTDB, and Workbench provides
a query interface, which can be queried by time period or user name. The "Audit
Log" feature is only supported in the Enterprise Edition.
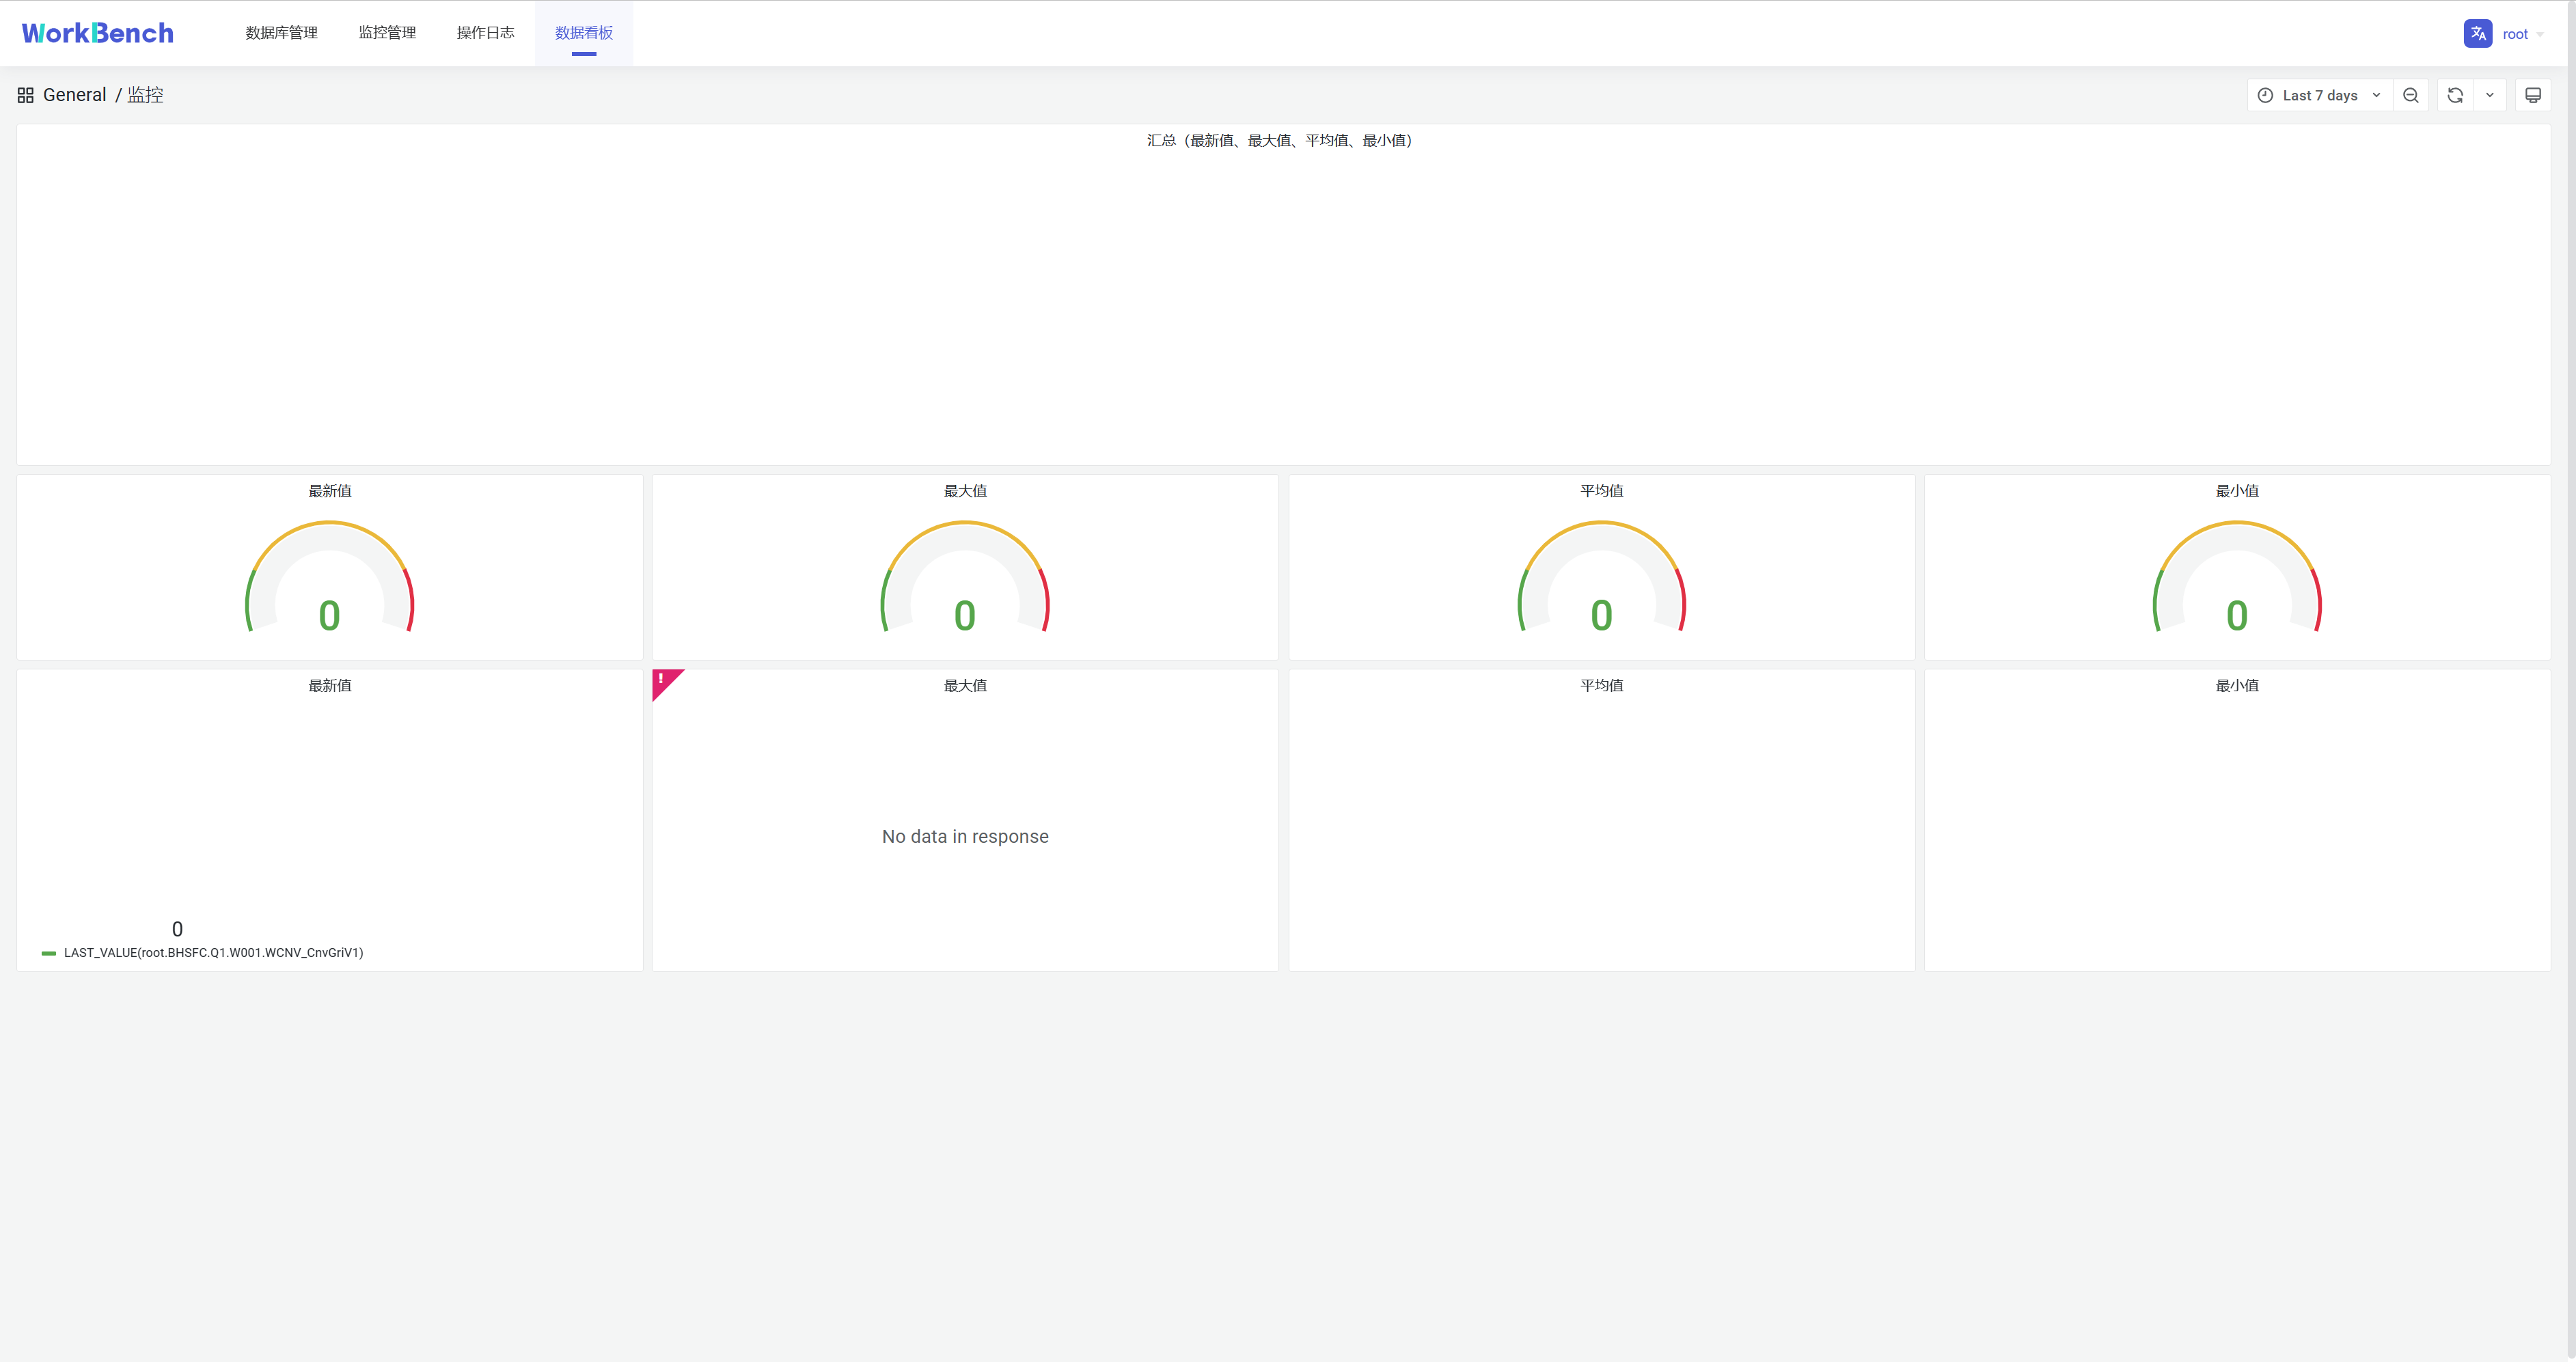
-## 数据看板
+## Data Dashboard
-数据看板可供创建数据库数据的直观表示,下图为挂载Grafana模板的仪表盘。
+The data dashboard can be used to create a visual representation of database
data. The following figure shows the dashboard with the Grafana template
mounted.
-**配置**
+### File Configuration
-**文件配置**
+Configure the dashboard address in the file application-prod.properties, find
the configuration item url.dashboard=https://grafana.com/, and fill in the
grafana URL.
-在文件application-prod.properties中配置看板地址,找到配置项url.dashboard=https://grafana.com/,填写grafana
-URL。
-
-application-prod.properties源文件内容:
+Content of application-prod.properties:
```plain Text
# Designate the log configuration file
logging.config=classpath:log4j2.xml
@@ -346,20 +339,19 @@ configServerPort=8867
url.dashboard=https://grafana.com/
```
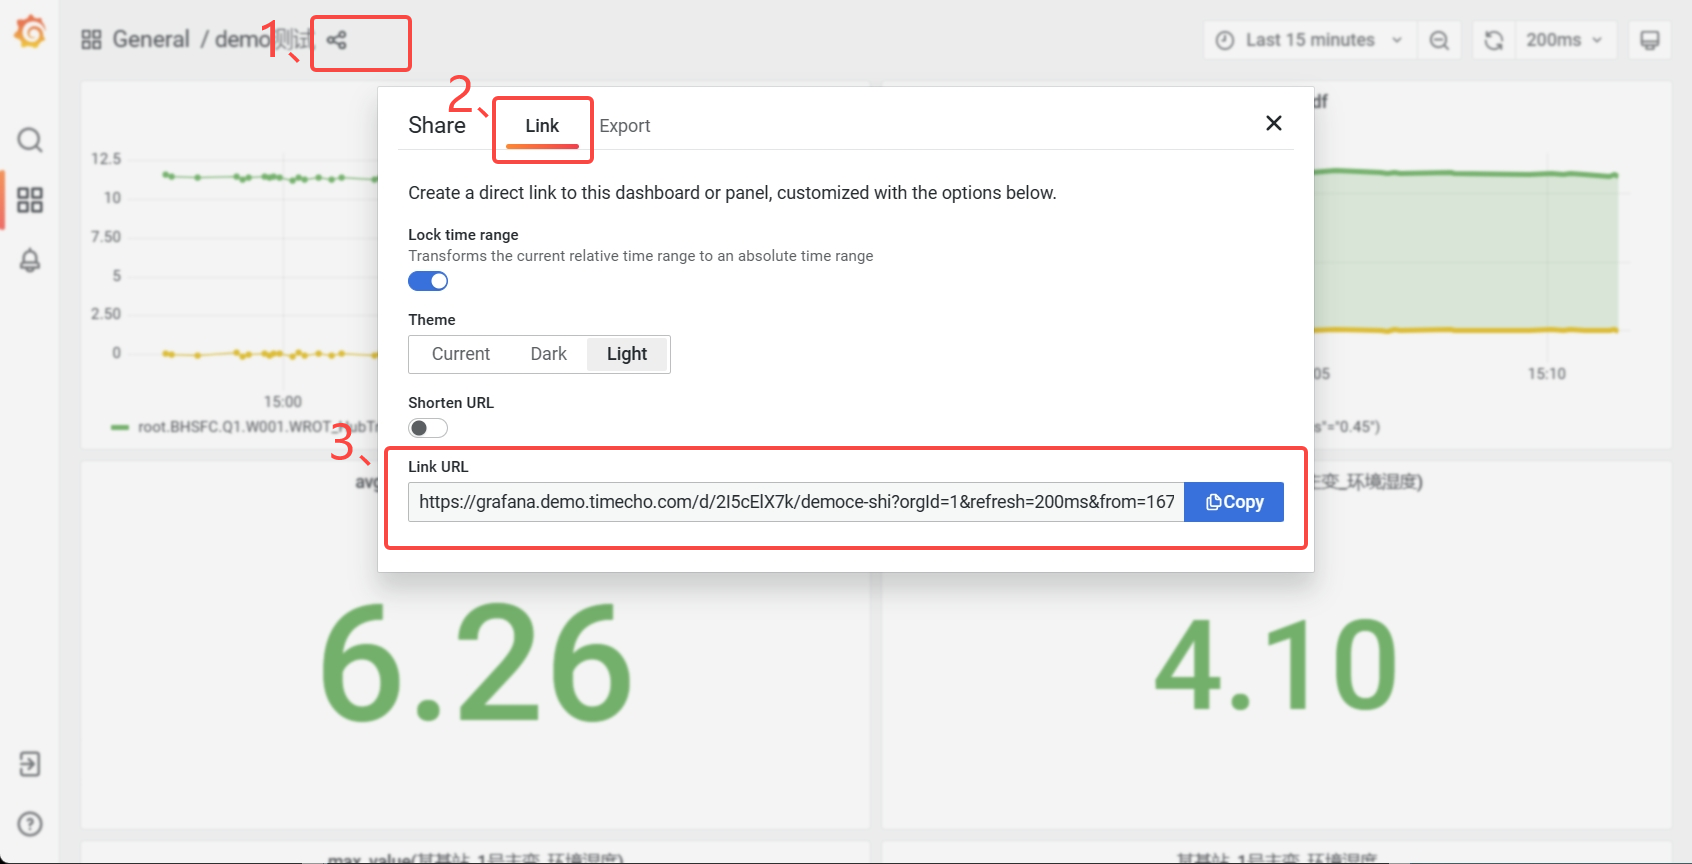
-**URL获取**
+### Get URL
-登录Grafan面板,点击分享按钮,在弹出的窗口选择"**Link**",复制"**Link
-URL**"即可。
+Log in to the Grafan panel, click the share button, select "**Link**" in the
pop-up window, and copy "**Link URL**".
## Q&A
-1. 如果遇到以下情况,请尝试退出"无痕模式"或者更换浏览器。
+1. If you encounter the following situations, please try to exit "incognito
mode" or change your browser.
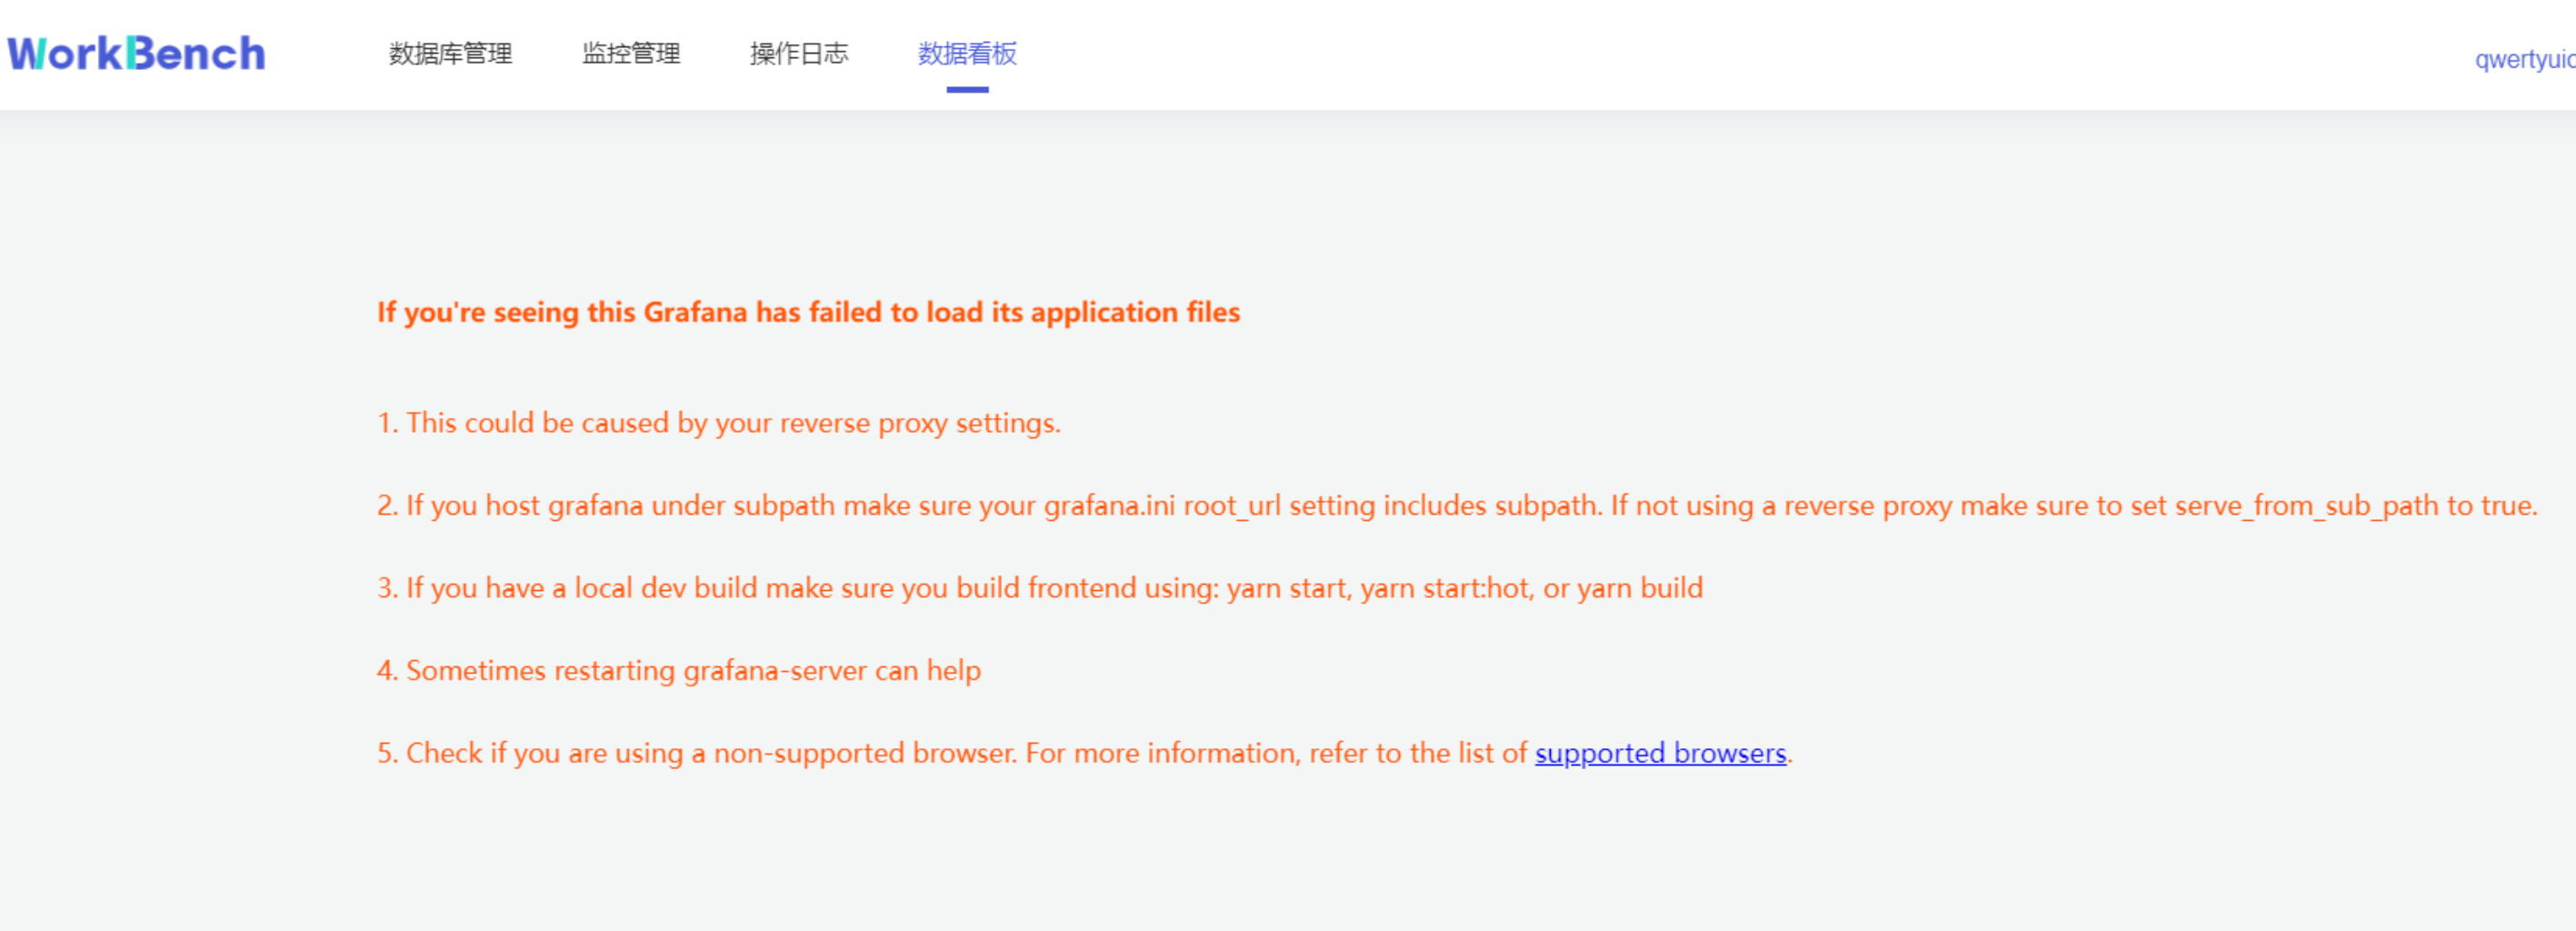
-2. 如果看不到监控信息,需要开启IoTDB的Metric。
+2. If you cannot see the monitoring information, you need to enable Metric of
IoTDB.
-3. 双活配置发生变化时需建议重新建立连接。
+3. When the active-active configuration changes, it is recommended to
re-establish the connection.
diff --git a/src/zh/UserGuide/Master/Tools-System/Benchmark.md
b/src/zh/UserGuide/Master/Tools-System/Benchmark.md
index da2472e..df79807 100644
--- a/src/zh/UserGuide/Master/Tools-System/Benchmark.md
+++ b/src/zh/UserGuide/Master/Tools-System/Benchmark.md
@@ -25,13 +25,13 @@ IoT-benchmark 是基于 Java 和大数据环境开发的时序数据库基准测
下图1-1囊括了测试基准流程及其他扩展功能。这些流程可以由IoT-benchmark 统一来完成。IoT Benchmark
支持多种工作负载,包括**纯写入、纯查询、写入查询混合**等,支持**软硬件系统监控、测试指标度量**等监控功能,还实现了**初始化数据库自动化、测试数据分析及系统参数优化**等功能。
-
+
图1-1
借鉴 YCSB 测试工具将工作负载生成、性能指标测量和数据库接口三个组件分离的设计思想,IoT-benchmark 的模块化设计如图1-2所示。与基于
YCSB 的测试工具系统不同的是,IoT-benchmark
增加了系统监控模块,支持测试数据和系统指标监控数据的持久化。此外也增加了一些特别针对时序数据场景的特殊负载测试功能,如支持物联网场景的批量写入和多种乱序数据写入模式。
-
+
图1-2
@@ -54,8 +54,6 @@ IoT-benchmark 是基于 Java 和大数据环境开发的时序数据库基准测
表1-1大数据测试基准对比
-##
-
## 软件安装与环境搭建
### IoT Benchmark 运行的前置条件
@@ -79,7 +77,7 @@ IoT-benchmark 是基于 Java 和大数据环境开发的时序数据库基准测
测试包的目录结构如下图1-3所示。其中测试配置文件为conf/config.properties,测试启动脚本为benchmark.sh (Linux &
MacOS) 和 benchmark.bat (Windows),详细文件用途见表1-2所示。
-
+
图1-3文件和文件夹列表
@@ -107,7 +105,7 @@ IoT-benchmark 是基于 Java 和大数据环境开发的时序数据库基准测
测试的所有日志文件被存放于 logs 文件夹下,测试的结果在测试完成后被存放到 data/csvOutput 文件夹下,例如测试后我们得到了如下的结果矩阵:
-
+
- Result Matrix
- OkOperation:成功的对应操作次数
@@ -269,37 +267,24 @@ IoT-benchmark目前支持通过配置参数“TEST_DATA_PERSISTENCE”将测试
首先在172.21.4.3和172.21.4.4上分别启动被测时间序列数据库Apache-IoTDB和KairosDB,之后在172.21.4.2、172.21.4.3和172.21.4.4上通过ser-benchamrk.sh脚本启动服务器资源监控(图2-1)。然后按照表2-3在172.21.4.2分别修改iotdb-0.13-0.0.1和kairosdb-0.0.1文件夹内的conf/config.properties文件满足测试需求。先后使用benchmark.sh启动对Apache-IoTDB和KairosDB的写入测试。
-
+
图2-1服务器监控任务
例如我们首先启动对KairosDB的测试,IoT-benchmark会在MySQL数据库中创建CONFIG数据表存放本次测试配置信息(图2-2),测试执行中会有日志输出当前测试进度(图2-3)。测试完成时会输出本次测试结果(图2-3),同时将结果写入FINAL_RESULT数据表中(图2-4)。
-
+
图2-2测试配置信息表
-
-
-
-
-
-
-
-
-
-
-
-
-
-
-
-
-
+
+
+
+
图2-3测试进度和结果
-
+
图2-4测试结果表
@@ -307,15 +292,14 @@ IoT-benchmark目前支持通过配置参数“TEST_DATA_PERSISTENCE”将测试
依照测试结果信息我们知道同样的配置写入Apache-IoTDB和KairosDB写入延时时间分别为:55.98ms和1324.45ms;写入吞吐分别为:5,125,600.86点/秒和224,819.01点/秒;测试分别执行了585.30秒和11777.99秒。并且KairosDB有写入失败出现,排查后发现是数据磁盘使用率已达到100%,无磁盘空间继续接收数据。而Apache-IoTDB无写入失败现象,全部数据写入完毕后占用磁盘空间仅为4.7G(如图2-5所示);从写入吞吐和磁盘占用情况上看Apache-IoTDB均优于KairosDB。当然后续还有其他测试来从多方面观察和对比,比如查询性能、文件压缩比、数据安全性等。
-
+
图2-5磁盘使用情况
那么测试过程中各个服务器资源使用情况如何呢?每个写操作具体的表现如何呢?这个时候我们就可以通过安装和使用Tableau来可视化服务器监控表和测试过程记录表内的数据了。Tableau的使用本文不展开介绍,通过它连接测试数据持久化的数据表后具体结果下如图(以Apache-IoTDB为例):
-
-
-
+
+
图2-6Tableau可视化测试过程
@@ -342,7 +326,7 @@ IoT-benchmark目前支持通过配置参数“TEST_DATA_PERSISTENCE”将测试
执行结果:
-
+
图2-7查询测试结果
diff --git a/src/zh/UserGuide/Master/Tools-System/Workbench.md
b/src/zh/UserGuide/Master/Tools-System/Workbench.md
index 6fe2458..59dfc7d 100644
--- a/src/zh/UserGuide/Master/Tools-System/Workbench.md
+++ b/src/zh/UserGuide/Master/Tools-System/Workbench.md
@@ -20,7 +20,7 @@
-->
-## Workbench简介
+# 控制台工具Workbench
Workbench是一个可创建多个连接的图形化数据库管理工具,用于管理IoTDB,提供元数据的可视化与管理、数据的增删改查以及权限控制等功能。Workbench不仅满足专业开发人员的所有需求,同时简洁友好的界面设计对初学者来说也易于上手。
diff --git a/src/zh/UserGuide/V1.2.x/Tools-System/Benchmark.md
b/src/zh/UserGuide/V1.2.x/Tools-System/Benchmark.md
index 7384041..9d0241f 100644
--- a/src/zh/UserGuide/V1.2.x/Tools-System/Benchmark.md
+++ b/src/zh/UserGuide/V1.2.x/Tools-System/Benchmark.md
@@ -26,13 +26,13 @@ IoT-benchmark 是基于 Java 和大数据环境开发的时序数据库基准测
下图1-1囊括了测试基准流程及其他扩展功能。这些流程可以由IoT-benchmark 统一来完成。IoT Benchmark
支持多种工作负载,包括**纯写入、纯查询、写入查询混合**等,支持**软硬件系统监控、测试指标度量**等监控功能,还实现了**初始化数据库自动化、测试数据分析及系统参数优化**等功能。
-
+
图1-1
借鉴 YCSB 测试工具将工作负载生成、性能指标测量和数据库接口三个组件分离的设计思想,IoT-benchmark 的模块化设计如图1-2所示。与基于
YCSB 的测试工具系统不同的是,IoT-benchmark
增加了系统监控模块,支持测试数据和系统指标监控数据的持久化。此外也增加了一些特别针对时序数据场景的特殊负载测试功能,如支持物联网场景的批量写入和多种乱序数据写入模式。
-
+
图1-2
@@ -80,7 +80,7 @@ IoT-benchmark 是基于 Java 和大数据环境开发的时序数据库基准测
测试包的目录结构如下图1-3所示。其中测试配置文件为conf/config.properties,测试启动脚本为benchmark.sh (Linux &
MacOS) 和 benchmark.bat (Windows),详细文件用途见表1-2所示。
-
+
图1-3文件和文件夹列表
@@ -108,7 +108,7 @@ IoT-benchmark 是基于 Java 和大数据环境开发的时序数据库基准测
测试的所有日志文件被存放于 logs 文件夹下,测试的结果在测试完成后被存放到 data/csvOutput 文件夹下,例如测试后我们得到了如下的结果矩阵:
-
+
- Result Matrix
- OkOperation:成功的对应操作次数
@@ -270,37 +270,24 @@ IoT-benchmark目前支持通过配置参数“TEST_DATA_PERSISTENCE”将测试
首先在172.21.4.3和172.21.4.4上分别启动被测时间序列数据库Apache-IoTDB和KairosDB,之后在172.21.4.2、172.21.4.3和172.21.4.4上通过ser-benchamrk.sh脚本启动服务器资源监控(图2-1)。然后按照表2-3在172.21.4.2分别修改iotdb-0.13-0.0.1和kairosdb-0.0.1文件夹内的conf/config.properties文件满足测试需求。先后使用benchmark.sh启动对Apache-IoTDB和KairosDB的写入测试。
-
+
图2-1服务器监控任务
例如我们首先启动对KairosDB的测试,IoT-benchmark会在MySQL数据库中创建CONFIG数据表存放本次测试配置信息(图2-2),测试执行中会有日志输出当前测试进度(图2-3)。测试完成时会输出本次测试结果(图2-3),同时将结果写入FINAL_RESULT数据表中(图2-4)。
-
+
图2-2测试配置信息表
-
-
-
-
-
-
-
-
-
-
-
-
-
-
-
-
-
+
+
+
+
图2-3测试进度和结果
-
+
图2-4测试结果表
@@ -308,15 +295,14 @@ IoT-benchmark目前支持通过配置参数“TEST_DATA_PERSISTENCE”将测试
依照测试结果信息我们知道同样的配置写入Apache-IoTDB和KairosDB写入延时时间分别为:55.98ms和1324.45ms;写入吞吐分别为:5,125,600.86点/秒和224,819.01点/秒;测试分别执行了585.30秒和11777.99秒。并且KairosDB有写入失败出现,排查后发现是数据磁盘使用率已达到100%,无磁盘空间继续接收数据。而Apache-IoTDB无写入失败现象,全部数据写入完毕后占用磁盘空间仅为4.7G(如图2-5所示);从写入吞吐和磁盘占用情况上看Apache-IoTDB均优于KairosDB。当然后续还有其他测试来从多方面观察和对比,比如查询性能、文件压缩比、数据安全性等。
-
+
图2-5磁盘使用情况
那么测试过程中各个服务器资源使用情况如何呢?每个写操作具体的表现如何呢?这个时候我们就可以通过安装和使用Tableau来可视化服务器监控表和测试过程记录表内的数据了。Tableau的使用本文不展开介绍,通过它连接测试数据持久化的数据表后具体结果下如图(以Apache-IoTDB为例):
-
-
-
+
+
图2-6Tableau可视化测试过程
@@ -343,7 +329,7 @@ IoT-benchmark目前支持通过配置参数“TEST_DATA_PERSISTENCE”将测试
执行结果:
-
+
图2-7查询测试结果