This is an automated email from the ASF dual-hosted git repository.

caogaofei pushed a commit to branch main
in repository https://gitbox.apache.org/repos/asf/iotdb-docs.git
The following commit(s) were added to refs/heads/main by this push:
new 70832bd Add Workbench Document Content
70832bd is described below
commit 70832bd9f3d1a788a35c23b15f4939919664bbfb
Author: majialin <[email protected]>
AuthorDate: Mon Jul 1 17:27:42 2024 +0800
Add Workbench Document Content
---
src/.vuepress/sidebar_timecho/V1.3.x/en.ts | 1 +
src/.vuepress/sidebar_timecho/V1.3.x/zh.ts | 1 +
.../workbench-deployment.md.md | 223 +++++++++++++++++++++
.../workbench-deployment.md.md | 223 +++++++++++++++++++++
.../workbench-deployment.md | 221 ++++++++++++++++++++
.../workbench-deployment.md.md | 221 ++++++++++++++++++++
6 files changed, 890 insertions(+)
diff --git a/src/.vuepress/sidebar_timecho/V1.3.x/en.ts
b/src/.vuepress/sidebar_timecho/V1.3.x/en.ts
index 946b1f6..2b64c1c 100644
--- a/src/.vuepress/sidebar_timecho/V1.3.x/en.ts
+++ b/src/.vuepress/sidebar_timecho/V1.3.x/en.ts
@@ -75,6 +75,7 @@ export const enSidebar = {
{ text: 'Docker Install', link: 'Docker-Install' },
{ text: 'AINode Deployment', link: 'AINode_Deployment' },
{ text: 'Monitoring Panel Deployment', link:
'Monitoring-panel-deployment' },
+ { text: 'Workbench Deployment', link: 'workbench-deployment' },
],
},
diff --git a/src/.vuepress/sidebar_timecho/V1.3.x/zh.ts
b/src/.vuepress/sidebar_timecho/V1.3.x/zh.ts
index cae6a37..6ba8aee 100644
--- a/src/.vuepress/sidebar_timecho/V1.3.x/zh.ts
+++ b/src/.vuepress/sidebar_timecho/V1.3.x/zh.ts
@@ -75,6 +75,7 @@ export const zhSidebar = {
{ text: 'docker部署', link: 'Docker-Install' },
{ text: 'AINode部署', link: 'AINode_Deployment' },
{ text: '工具部署(监控面板)', link: 'Monitoring-panel-deployment' },
+ { text: '工具部署(可视化控制台)', link: 'workbench-deployment' },
],
},
diff --git
a/src/UserGuide/Master/Deployment-and-Maintenance/workbench-deployment.md.md
b/src/UserGuide/Master/Deployment-and-Maintenance/workbench-deployment.md.md
new file mode 100644
index 0000000..a38cb5d
--- /dev/null
+++ b/src/UserGuide/Master/Deployment-and-Maintenance/workbench-deployment.md.md
@@ -0,0 +1,223 @@
+<!--
+
+ Licensed to the Apache Software Foundation (ASF) under one
+ or more contributor license agreements. See the NOTICE file
+ distributed with this work for additional information
+ regarding copyright ownership. The ASF licenses this file
+ to you under the Apache License, Version 2.0 (the
+ "License"); you may not use this file except in compliance
+ with the License. You may obtain a copy of the License at
+
+ http://www.apache.org/licenses/LICENSE-2.0
+
+ Unless required by applicable law or agreed to in writing,
+ software distributed under the License is distributed on an
+ "AS IS" BASIS, WITHOUT WARRANTIES OR CONDITIONS OF ANY
+ KIND, either express or implied. See the License for the
+ specific language governing permissions and limitations
+ under the License.
+
+-->
+# Workbench Deployment
+
+The visualization console is one of the supporting tools for IoTDB. It is an
official application tool system used in various stages of database deployment,
operation and maintenance management, and application development, making the
use, operation and management of databases simpler and more efficient, truly
achieving low-cost management and operation of databases. This document will
help you install Workbench.
+
+ <div style="display: flex;justify-content: space-between;">
+ <img src="https://alioss.timecho.com/docs/img/%E9%A6%96%E9%A1%B5.PNG"; alt="
" style="width: 50%;"/>
+ <img
src="https://alioss.timecho.com/docs/img/%E6%B5%8B%E7%82%B9%E5%88%97%E8%A1%A8.PNG";
alt="" style="width: 50%;"/>
+</div>
+
+
+## Installation Preparation
+
+| Preparation Content | Name |
Version Requirements | Link
|
+| :----------------------: | :-------------------------: |
:----------------------------------------------------------: |
:----------------------------------------------------------: |
+| Operating System | Windows or Linux |
- | -
|
+| Installation Environment | JDK | Need>=V1.8.0_162
(recommended to use 11 or 17, please choose ARM or x64 installation package
according to machine configuration when downloading) |
https://www.oracle.com/java/technologies/downloads/ |
+| Related Software | Prometheus | Requires
installation of V2.30.3 and above. |
https://prometheus.io/download/ |
+| Database | IoTDB | Requires
V1.2.0 Enterprise Edition and above | You can contact business or
technical support to obtain |
+| Console | IoTDB-Workbench-`<version>` |
- | You can choose according to the
appendix version comparison table and contact business or technical support to
obtain it |
+
+## Installation Steps
+
+### Step 1: IoTDB enables monitoring indicator collection
+
+1. Open the monitoring configuration item. The configuration items related to
monitoring in IoTDB are disabled by default. Before deploying the monitoring
panel, you need to open the relevant configuration items (note that the service
needs to be restarted after enabling monitoring configuration).
+
+ <table>
+ <tr>
+ <th>Configuration</th>
+ <th>Located in the configuration file</th>
+ <th>Description</th>
+ </tr>
+ <tr>
+ <td>cn_metric_reporter_list</td>
+ <td rowspan="3">conf/iotdb-confignode.properties</td>
+ <td>Uncomment the configuration item and set the value to
PROMETHEUS</td>
+ </tr>
+ <tr>
+ <td>cn_metric_level</td>
+ <td>Uncomment the configuration item and set the value to
IMPORTANT</td>
+ </tr>
+ <tr>
+ <td>cn_metric_prometheus_reporter_port</td>
+ <td>Uncomment the configuration item to maintain the default
setting of 9091. If other ports are set, they will not conflict with each
other</td>
+ </tr>
+ <tr>
+ <td>dn_metric_reporter_list</td>
+ <td rowspan="4">conf/iotdb-datanode.properties</td>
+ <td>Uncomment the configuration item and set the value to
PROMETHEUS</td>
+ </tr>
+ <tr>
+ <td>dn_metric_level</td>
+ <td>Uncomment the configuration item and set the value to
IMPORTANT</td>
+ </tr>
+ <tr>
+ <td>dn_metric_prometheus_reporter_port</td>
+ <td>Uncomment the configuration item and set it to 9092 by
default. If other ports are set, they will not conflict with each other</td>
+ </tr>
+ <tr>
+ <td>dn_metric_internal_reporter_type</td>
+ <td>Uncomment the configuration item and set the value to
IOTDB</td>
+ </tr>
+ <tr>
+ <td>enable_audit_log</td>
+ <td rowspan="3">conf/iotdb-common.properties</td>
+ <td>Uncomment the configuration item and set the value to
true</td>
+ </tr>
+ <tr>
+ <td>audit_log_storage</td>
+ <td>Uncomment configuration items</td>
+ </tr>
+ <tr>
+ <td>audit_log_operation</td>
+ <td>Uncomment configuration items</td>
+ </tr>
+ </table>
+
+
+2. Restart all nodes. After modifying the monitoring indicator configuration
of three nodes, the confignode and datanode services of all nodes can be
restarted:
+
+ ```shell
+ ./sbin/stop-standalone.sh #Stop confignode and datanode first
+ ./sbin/start-confignode.sh -d #Start confignode
+ ./sbin/start-datanode.sh -d #Start datanode
+ ```
+
+3. After restarting, confirm the running status of each node through the
client. If the status is Running, it indicates successful configuration:
+
+ 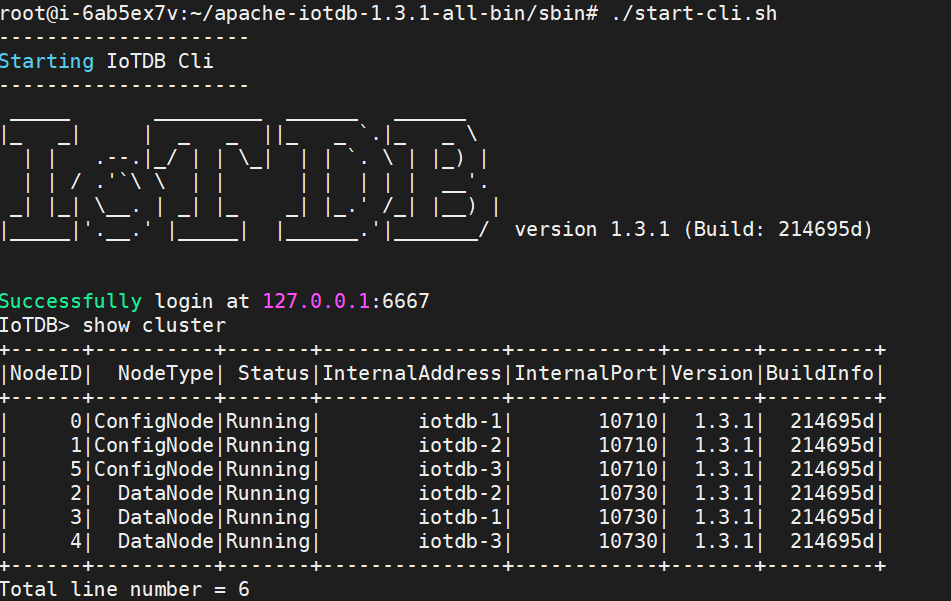
+
+### Step 2: Install and configure Prometheus
+
+1. Download the Prometheus installation package, which requires installation
of V2.30.3 and above. You can go to the Prometheus official website to download
it(https://prometheus.io/download)
+2. Unzip the installation package and enter the unzipped folder:
+
+ ```Shell
+ tar xvfz prometheus-*.tar.gz
+ cd prometheus-*
+ ```
+
+3. Modify the configuration. Modify the configuration file prometheus.yml as
follows
+ 1. Add configNode task to collect monitoring data for ConfigNode
+ 2. Add a datanode task to collect monitoring data for DataNodes
+
+ ```shell
+ global:
+ scrape_interval: 15s
+ evaluation_interval: 15s
+ scrape_configs:
+ - job_name: "prometheus"
+ static_configs:
+ - targets: ["localhost:9090"]
+ - job_name: "confignode"
+ static_configs:
+ - targets: ["iotdb-1:9091","iotdb-2:9091","iotdb-3:9091"]
+ honor_labels: true
+ - job_name: "datanode"
+ static_configs:
+ - targets: ["iotdb-1:9092","iotdb-2:9092","iotdb-3:9092"]
+ honor_labels: true
+ ```
+
+4. Start Prometheus. The default expiration time for Prometheus monitoring
data is 15 days. In production environments, it is recommended to adjust it to
180 days or more to track historical monitoring data for a longer period of
time. The startup command is as follows:
+
+ ```Shell
+ ./prometheus --config.file=prometheus.yml
--storage.tsdb.retention.time=180d
+ ```
+
+5. Confirm successful startup. Enter in browser http://IP:port Go to
Prometheus and click on the Target interface under Status. When you see that
all States are Up, it indicates successful configuration and connectivity.
+
+ <div style="display: flex;justify-content: space-between;">
+ <img src="https://alioss.timecho.com/docs/img/%E5%90%AF%E5%8A%A8_1.png";
alt="" style="width: 50%;" />
+ <img src="https://alioss.timecho.com/docs/img/%E5%90%AF%E5%8A%A8_2.png";
alt="" style="width: 48%;"/>
+ </div>
+
+
+### Step 3: Install Workbench
+
+#### Windows:
+
+1. Enter the config directory of iotdb Workbench -`<version>`
+
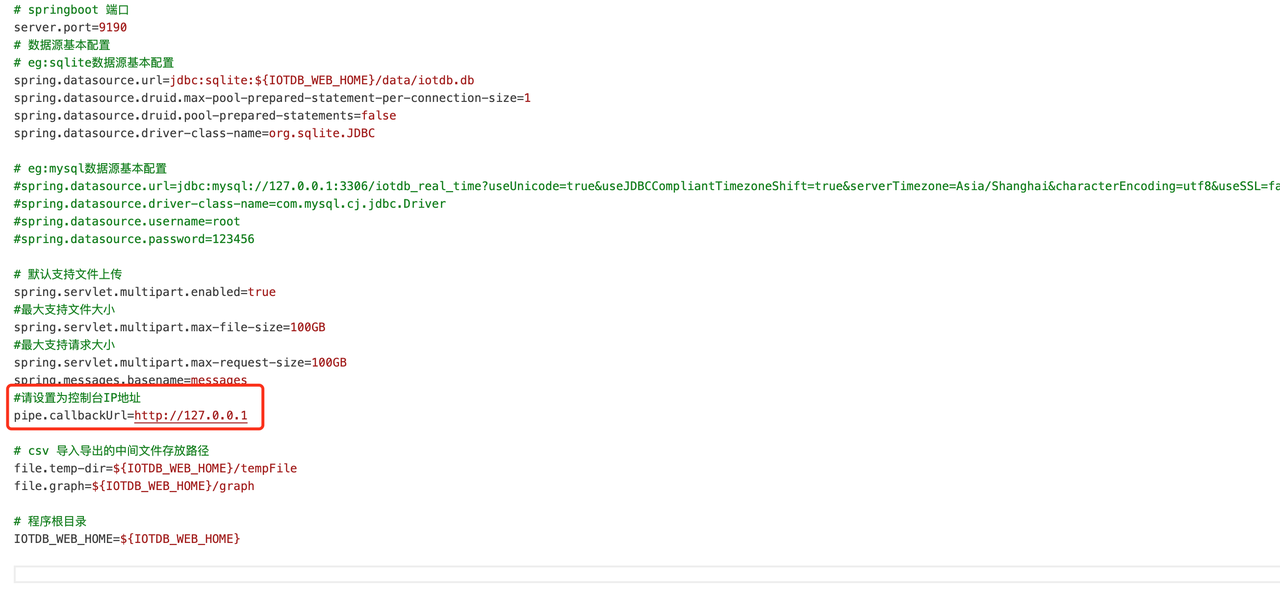
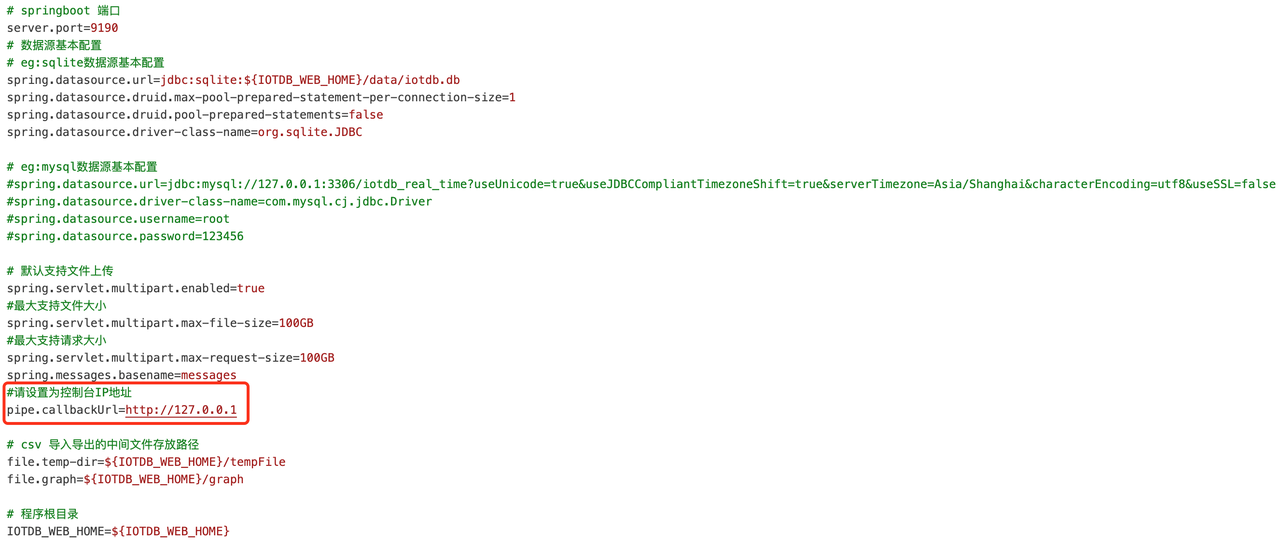
+2. Modify Workbench configuration file: Go to the `config` folder and modify
the configuration file `application-prod.properties`. If you are installing it
locally, there is no need to modify it. If you are deploying it on a server,
you need to modify the IP address
+
+ | Configuration | Before Modification | After
modification |
+ | ---------------- | ----------------------------------- |
----------------------------------------------- |
+ | pipe.callbackUrl | pipe.callbackUrl=`http://127.0.0.1` |
pipe.callbackUrl=`http://<Deployed IP address>` |
+
+ 
+
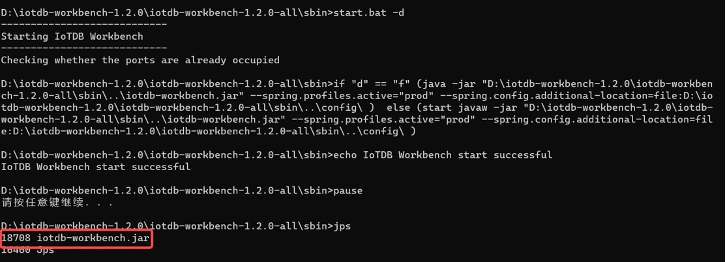
+3. Startup program: Please execute the startup command in the sbin folder of
IoTDB Workbench -`<version>`
+
+ ```shell
+ # Start Workbench in the background
+ start.bat -d
+ ```
+
+4. You can use the `jps` command to check if the startup was successful, as
shown in the figure:
+
+ 
+
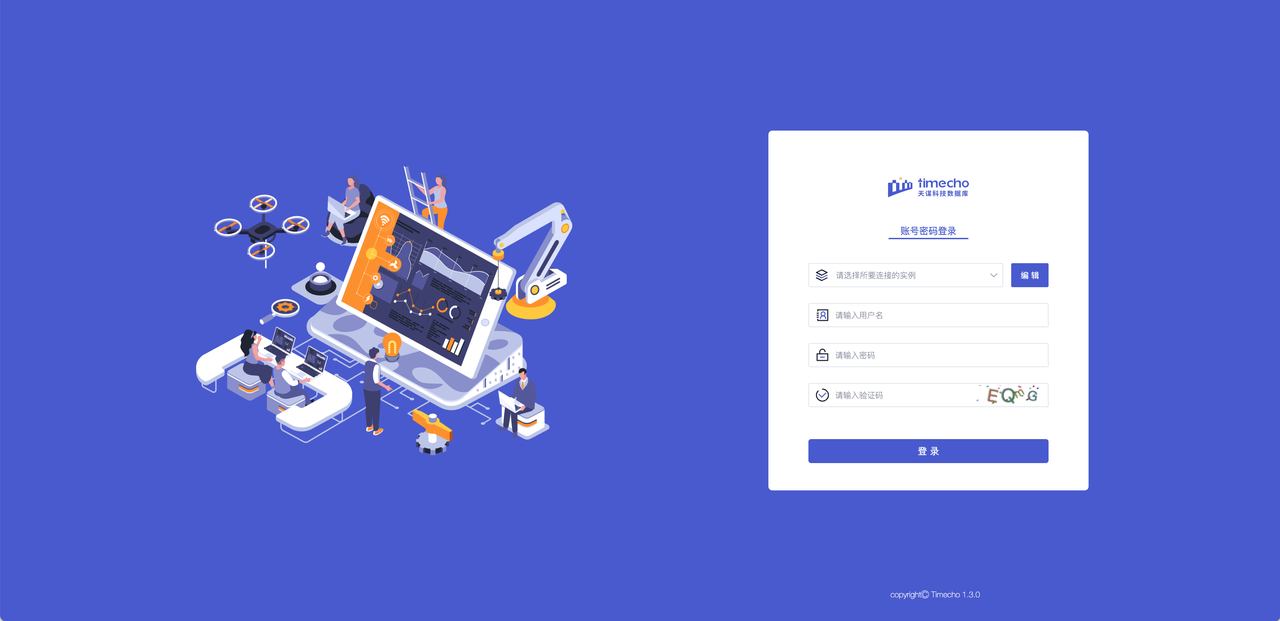
+5. Verification successful: Open "http://Server IP: Port in configuration
file" in the browser to access, for example:“ http://127.0.0.1:9190 ”When the
login interface appears, it is considered successful
+
+ 
+
+#### Linux版:
+
+1. Enter the IoTDB Workbench -`<version>` directory
+
+2. Modify Workbench configuration: Go to the `config` folder and modify the
configuration file `application-prod.properties`. If you are installing it
locally, there is no need to modify it. If you are deploying it on a server,
you need to modify the IP address
+
+ | Configuration | Before Modification | After
modification |
+ | ---------------- | ----------------------------------- |
----------------------------------------------- |
+ | pipe.callbackUrl | pipe.callbackUrl=`http://127.0.0.1` |
pipe.callbackUrl=`http://<Deployed IP address>` |
+
+ 
+
+3. Startup program: Please execute the startup command in the sbin folder of
IoTDB Workbench -`<version>`
+
+ ```shell
+ # Start Workbench in the background
+ ./start.sh -d
+ ```
+
+4. You can use the `jps` command to check if the startup was successful, as
shown in the figure:
+
+ 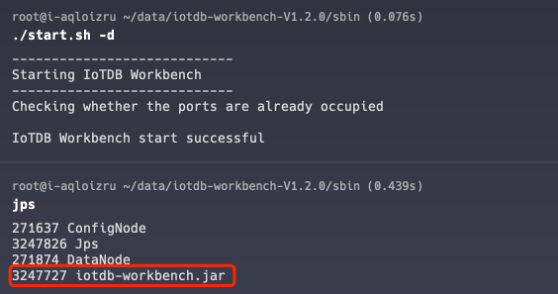
+
+5. Verification successful: Open "http://Server IP: Port in configuration
file" in the browser to access, for example:"http://127.0.0.1:9190"; When the
login interface appears, it is considered successful
+
+ 
+
+## Appendix: IoTDB and Workbench Version Comparison Table
+
+| Workbench Version Number | Release Note
| Supports IoTDB Versions |
+| ------------------------ |
------------------------------------------------------------ |
------------------------- |
+| V1.2.6 | Optimize the permission control function of each
module | V1.3.1 and above versions |
+| V1.2.5 | The visualization function has added the concept
of "commonly used templates", and all interface optimization and page caching
functions have been supplemented | V1.3.0 and above versions |
+| V1.2.4 | The calculation function has added the "import
and export" function, and the measurement point list has added the "time
alignment" field | V1.2.2 and above versions |
+| V1.2.3 | New "activation details" and analysis functions
added to the homepage | V1.2.2 and above versions |
+| V1.2.2 | Optimize the display content and other functions
of "measurement point description" | V1.2.2 and above versions |
+| V1.2.1 | New "Monitoring Panel" added to the data
synchronization interface to optimize Prometheus prompt information | V1.2.2
and above versions |
+| V1.2.0 | New Workbench version upgrade
| V1.2.0 and above versions |
\ No newline at end of file
diff --git
a/src/UserGuide/latest/Deployment-and-Maintenance/workbench-deployment.md.md
b/src/UserGuide/latest/Deployment-and-Maintenance/workbench-deployment.md.md
new file mode 100644
index 0000000..7eabed9
--- /dev/null
+++ b/src/UserGuide/latest/Deployment-and-Maintenance/workbench-deployment.md.md
@@ -0,0 +1,223 @@
+<!--
+
+ Licensed to the Apache Software Foundation (ASF) under one
+ or more contributor license agreements. See the NOTICE file
+ distributed with this work for additional information
+ regarding copyright ownership. The ASF licenses this file
+ to you under the Apache License, Version 2.0 (the
+ "License"); you may not use this file except in compliance
+ with the License. You may obtain a copy of the License at
+
+ http://www.apache.org/licenses/LICENSE-2.0
+
+ Unless required by applicable law or agreed to in writing,
+ software distributed under the License is distributed on an
+ "AS IS" BASIS, WITHOUT WARRANTIES OR CONDITIONS OF ANY
+ KIND, either express or implied. See the License for the
+ specific language governing permissions and limitations
+ under the License.
+
+-->
+# Workbench Deployment
+
+The visualization console is one of the supporting tools for IoTDB. It is an
official application tool system used in various stages of database deployment,
operation and maintenance management, and application development, making the
use, operation and management of databases simpler and more efficient, truly
achieving low-cost management and operation of databases. This document will
help you install Workbench.
+
+ <div style="display: flex;justify-content: space-between;">
+ <img src="https://alioss.timecho.com/docs/img/%E9%A6%96%E9%A1%B5.PNG"; alt="
" style="width: 50%;"/>
+ <img
src="https://alioss.timecho.com/docs/img/%E6%B5%8B%E7%82%B9%E5%88%97%E8%A1%A8.PNG";
alt="" style="width: 50%;"/>
+</div>
+
+
+## Installation Preparation
+
+| Preparation Content | Name |
Version Requirements | Link
|
+| :----------------------: | :-------------------------: |
:----------------------------------------------------------: |
:----------------------------------------------------------: |
+| Operating System | Windows or Linux |
- | -
|
+| Installation Environment | JDK | Need>=V1.8.0_162
(recommended to use 11 or 17, please choose ARM or x64 installation package
according to machine configuration when downloading) |
https://www.oracle.com/java/technologies/downloads/ |
+| Related Software | Prometheus | Requires
installation of V2.30.3 and above. |
https://prometheus.io/download/ |
+| Database | IoTDB | Requires
V1.2.0 Enterprise Edition and above | You can contact business or
technical support to obtain |
+| Console | IoTDB-Workbench-`<version>` |
- | You can choose according to the
appendix version comparison table and contact business or technical support to
obtain it |
+
+## Installation Steps
+
+### Step 1: IoTDB enables monitoring indicator collection
+
+1. Open the monitoring configuration item. The configuration items related to
monitoring in IoTDB are disabled by default. Before deploying the monitoring
panel, you need to open the relevant configuration items (note that the service
needs to be restarted after enabling monitoring configuration).
+
+ <table>
+ <tr>
+ <th>Configuration</th>
+ <th>Located in the configuration file</th>
+ <th>Description</th>
+ </tr>
+ <tr>
+ <td>cn_metric_reporter_list</td>
+ <td rowspan="3">conf/iotdb-confignode.properties</td>
+ <td>Uncomment the configuration item and set the value to
PROMETHEUS</td>
+ </tr>
+ <tr>
+ <td>cn_metric_level</td>
+ <td>Uncomment the configuration item and set the value to
IMPORTANT</td>
+ </tr>
+ <tr>
+ <td>cn_metric_prometheus_reporter_port</td>
+ <td>Uncomment the configuration item to maintain the default
setting of 9091. If other ports are set, they will not conflict with each
other</td>
+ </tr>
+ <tr>
+ <td>dn_metric_reporter_list</td>
+ <td rowspan="4">conf/iotdb-datanode.properties</td>
+ <td>Uncomment the configuration item and set the value to
PROMETHEUS</td>
+ </tr>
+ <tr>
+ <td>dn_metric_level</td>
+ <td>Uncomment the configuration item and set the value to
IMPORTANT</td>
+ </tr>
+ <tr>
+ <td>dn_metric_prometheus_reporter_port</td>
+ <td>Uncomment the configuration item and set it to 9092 by
default. If other ports are set, they will not conflict with each other</td>
+ </tr>
+ <tr>
+ <td>dn_metric_internal_reporter_type</td>
+ <td>Uncomment the configuration item and set the value to
IOTDB</td>
+ </tr>
+ <tr>
+ <td>enable_audit_log</td>
+ <td rowspan="3">conf/iotdb-common.properties</td>
+ <td>Uncomment the configuration item and set the value to
true</td>
+ </tr>
+ <tr>
+ <td>audit_log_storage</td>
+ <td>Uncomment configuration items</td>
+ </tr>
+ <tr>
+ <td>audit_log_operation</td>
+ <td>Uncomment configuration items</td>
+ </tr>
+ </table>
+
+
+2. Restart all nodes. After modifying the monitoring indicator configuration
of three nodes, the confignode and datanode services of all nodes can be
restarted:
+
+ ```shell
+ ./sbin/stop-standalone.sh #Stop confignode and datanode first
+ ./sbin/start-confignode.sh -d #Start confignode
+ ./sbin/start-datanode.sh -d #Start datanode
+ ```
+
+3. After restarting, confirm the running status of each node through the
client. If the status is Running, it indicates successful configuration:
+
+ 
+
+### Step 2: Install and configure Prometheus
+
+1. Download the Prometheus installation package, which requires installation
of V2.30.3 and above. You can go to the Prometheus official website to download
it(https://prometheus.io/download)
+2. Unzip the installation package and enter the unzipped folder:
+
+ ```Shell
+ tar xvfz prometheus-*.tar.gz
+ cd prometheus-*
+ ```
+
+3. Modify the configuration. Modify the configuration file prometheus.yml as
follows
+ 1. Add configNode task to collect monitoring data for ConfigNode
+ 2. Add a datanode task to collect monitoring data for DataNodes
+
+ ```shell
+ global:
+ scrape_interval: 15s
+ evaluation_interval: 15s
+ scrape_configs:
+ - job_name: "prometheus"
+ static_configs:
+ - targets: ["localhost:9090"]
+ - job_name: "confignode"
+ static_configs:
+ - targets: ["iotdb-1:9091","iotdb-2:9091","iotdb-3:9091"]
+ honor_labels: true
+ - job_name: "datanode"
+ static_configs:
+ - targets: ["iotdb-1:9092","iotdb-2:9092","iotdb-3:9092"]
+ honor_labels: true
+ ```
+
+4. Start Prometheus. The default expiration time for Prometheus monitoring
data is 15 days. In production environments, it is recommended to adjust it to
180 days or more to track historical monitoring data for a longer period of
time. The startup command is as follows:
+
+ ```Shell
+ ./prometheus --config.file=prometheus.yml
--storage.tsdb.retention.time=180d
+ ```
+
+5. Confirm successful startup. Enter in browser http://IP:port Go to
Prometheus and click on the Target interface under Status. When you see that
all States are Up, it indicates successful configuration and connectivity.
+
+ <div style="display: flex;justify-content: space-between;">
+ <img src="https://alioss.timecho.com/docs/img/%E5%90%AF%E5%8A%A8_1.png";
alt="" style="width: 50%;" />
+ <img src="https://alioss.timecho.com/docs/img/%E5%90%AF%E5%8A%A8_2.png";
alt="" style="width: 48%;"/>
+ </div>
+
+
+### Step 3: Install Workbench
+
+#### Windows:
+
+1. Enter the config directory of iotdb Workbench -`<version>`
+
+2. Modify Workbench configuration file: Go to the `config` folder and modify
the configuration file `application-prod.properties`. If you are installing it
locally, there is no need to modify it. If you are deploying it on a server,
you need to modify the IP address
+
+ | Configuration | Before Modification | After
modification |
+ | ---------------- | ----------------------------------- |
----------------------------------------------- |
+ | pipe.callbackUrl | pipe.callbackUrl=`http://127.0.0.1` |
pipe.callbackUrl=`http://<Deployed IP address>` |
+
+ 
+
+3. Startup program: Please execute the startup command in the sbin folder of
IoTDB Workbench -`<version>`
+
+ ```shell
+ # Start Workbench in the background
+ start.bat -d
+ ```
+
+4. You can use the `jps` command to check if the startup was successful, as
shown in the figure:
+
+ 
+
+5. Verification successful: Open "http://Server IP: Port in configuration
file" in the browser to access, for example:“ http://127.0.0.1:9190 ”When the
login interface appears, it is considered successful
+
+ 
+
+#### Linux版:
+
+1. Enter the IoTDB Workbench -`<version>` directory
+
+2. Modify Workbench configuration: Go to the `config` folder and modify the
configuration file `application-prod.properties`. If you are installing it
locally, there is no need to modify it. If you are deploying it on a server,
you need to modify the IP address
+
+ | Configuration | Before Modification | After
modification |
+ | ---------------- | ----------------------------------- |
----------------------------------------------- |
+ | pipe.callbackUrl | pipe.callbackUrl=`http://127.0.0.1` |
pipe.callbackUrl=`http://<Deployed IP address>` |
+
+ 
+
+3. Startup program: Please execute the startup command in the sbin folder of
IoTDB Workbench -`<version>`
+
+ ```shell
+ # Start Workbench in the background
+ ./start.sh -d
+ ```
+
+4. You can use the `jps` command to check if the startup was successful, as
shown in the figure:
+
+ 
+
+5. Verification successful: Open "http://Server IP: Port in configuration
file" in the browser to access, for example:"http://127.0.0.1:9190"; When the
login interface appears, it is considered successful
+
+ 
+
+## Appendix: IoTDB and Workbench Version Comparison Table
+
+| Workbench Version Number | Release Note
| Supports IoTDB Versions |
+| ------------------------ |
------------------------------------------------------------ |
------------------------- |
+| V1.2.6 | Optimize the permission control function of each
module | V1.3.1 and above versions |
+| V1.2.5 | The visualization function has added the concept
of "commonly used templates", and all interface optimization and page caching
functions have been supplemented | V1.3.0 and above versions |
+| V1.2.4 | The calculation function has added the "import
and export" function, and the measurement point list has added the "time
alignment" field | V1.2.2 and above versions |
+| V1.2.3 | New "activation details" and analysis functions
added to the homepage | V1.2.2 and above versions |
+| V1.2.2 | Optimize the display content and other functions
of "measurement point description" | V1.2.2 and above versions |
+| V1.2.1 | New "Monitoring Panel" added to the data
synchronization interface to optimize Prometheus prompt information | V1.2.2
and above versions |
+| V1.2.0 | New Workbench version upgrade
| V1.2.0 and above versions |
\ No newline at end of file
diff --git
a/src/zh/UserGuide/Master/Deployment-and-Maintenance/workbench-deployment.md
b/src/zh/UserGuide/Master/Deployment-and-Maintenance/workbench-deployment.md
new file mode 100644
index 0000000..3e8bdb0
--- /dev/null
+++ b/src/zh/UserGuide/Master/Deployment-and-Maintenance/workbench-deployment.md
@@ -0,0 +1,221 @@
+<!--
+
+ Licensed to the Apache Software Foundation (ASF) under one
+ or more contributor license agreements. See the NOTICE file
+ distributed with this work for additional information
+ regarding copyright ownership. The ASF licenses this file
+ to you under the Apache License, Version 2.0 (the
+ "License"); you may not use this file except in compliance
+ with the License. You may obtain a copy of the License at
+
+ http://www.apache.org/licenses/LICENSE-2.0
+
+ Unless required by applicable law or agreed to in writing,
+ software distributed under the License is distributed on an
+ "AS IS" BASIS, WITHOUT WARRANTIES OR CONDITIONS OF ANY
+ KIND, either express or implied. See the License for the
+ specific language governing permissions and limitations
+ under the License.
+
+-->
+# 可视化控制台部署
+
+可视化控制台是IoTDB配套工具之一。它用于数据库部署实施、运维管理、应用开发各阶段的官方应用工具体系,让数据库的使用、运维和管理更加简单、高效,真正实现数据库低成本的管理和运维。本文档将帮助您安装Workbench。
+
+ <div style="display: flex;justify-content: space-between;">
+ <img src="https://alioss.timecho.com/docs/img/%E9%A6%96%E9%A1%B5.PNG";
alt=" " style="width: 50%;"/>
+ <img
src="https://alioss.timecho.com/docs/img/%E6%B5%8B%E7%82%B9%E5%88%97%E8%A1%A8.PNG";
alt="" style="width: 50%;"/>
+ </div>
+
+## 安装准备
+
+| 准备内容 | 名称 | 版本要求
| 官方链接 |
+| :------: | :-----------------------: |
:----------------------------------------------------------: |
:----------------------------------------------------: |
+| 操作系统 | Windows或Linux | -
| - |
+| 安装环境 | JDK | 需要 >= V1.8.0_162(推荐使用 11 或者
17,下载时请根据机器配置选择ARM或x64安装包) |
https://www.oracle.com/java/technologies/downloads/ |
+| 相关软件 | Prometheus | 需要 >=V2.30.3
| https://prometheus.io/download/ |
+| 数据库 | IoTDB | 需要>=V1.2.0企业版
| 您可联系商务或技术支持获取 |
+| 控制台 | IoTDB-Workbench-`<version>`| -
| 您可根据附录版本对照表进行选择后联系商务或技术支持获取 |
+
+## 安装步骤
+
+### 步骤一:IoTDB 开启监控指标采集
+
+1. 打开监控配置项。IoTDB中监控有关的配置项默认是关闭的,在部署监控面板前,您需要打开相关配置项(注意开启监控配置后需要重启服务)。
+
+ <table>
+ <tr>
+ <th>配置项</th>
+ <th>所在配置文件</th>
+ <th>配置说明</th>
+ </tr>
+ <tr>
+ <td>cn_metric_reporter_list</td>
+ <td rowspan="3">conf/iotdb-confignode.properties</td>
+ <td>将配置项取消注释,值设置为PROMETHEUS</td>
+ </tr>
+ <tr>
+ <td>cn_metric_level</td>
+ <td>将配置项取消注释,值设置为IMPORTANT</td>
+ </tr>
+ <tr>
+ <td>cn_metric_prometheus_reporter_port</td>
+ <td>将配置项取消注释,可保持默认设置9091,如设置其他端口,不与其他端口冲突即可</td>
+ </tr>
+ <tr>
+ <td>dn_metric_reporter_list</td>
+ <td rowspan="4">conf/iotdb-datanode.properties</td>
+ <td>将配置项取消注释,值设置为PROMETHEUS</td>
+ </tr>
+ <tr>
+ <td>dn_metric_level</td>
+ <td>将配置项取消注释,值设置为IMPORTANT</td>
+ </tr>
+ <tr>
+ <td>dn_metric_prometheus_reporter_port</td>
+ <td>将配置项取消注释,可保持默认设置9092,如设置其他端口,不与其他端口冲突即可</td>
+ </tr>
+ <tr>
+ <td>dn_metric_internal_reporter_type</td>
+ <td>将配置项取消注释,值设置为IOTDB</td>
+ </tr>
+ <tr>
+ <td>enable_audit_log</td>
+ <td rowspan="3">conf/iotdb-common.properties</td>
+ <td>将配置项取消注释,值设置为true</td>
+ </tr>
+ <tr>
+ <td>audit_log_storage</td>
+ <td>将配置项取消注释</td>
+ </tr>
+ <tr>
+ <td>audit_log_operation</td>
+ <td>将配置项取消注释</td>
+ </tr>
+ </table>
+
+2. 重启所有节点。修改3个节点的监控指标配置后,可重新启动所有节点的confignode和datanode服务:
+
+ ```shell
+ ./sbin/stop-standalone.sh #先停止confignode和datanode
+ ./sbin/start-confignode.sh -d #启动confignode
+ ./sbin/start-datanode.sh -d #启动datanode
+ ```
+
+3. 重启后,通过客户端确认各节点的运行状态,若状态都为Running,则为配置成功:
+
+ 
+
+### 步骤二:安装、配置Prometheus监控
+
+1.
确保Prometheus安装完成(官方安装说明可参考:https://prometheus.io/docs/introduction/first_steps/)
+2. 解压安装包,进入解压后的文件夹:
+
+ ```Shell
+ tar xvfz prometheus-*.tar.gz
+ cd prometheus-*
+ ```
+
+3. 修改配置。修改配置文件prometheus.yml如下
+ 1. 新增confignode任务收集ConfigNode的监控数据
+ 2. 新增datanode任务收集DataNode的监控数据
+
+ ```shell
+ global:
+ scrape_interval: 15s
+ evaluation_interval: 15s
+ scrape_configs:
+ - job_name: "prometheus"
+ static_configs:
+ - targets: ["localhost:9090"]
+ - job_name: "confignode"
+ static_configs:
+ - targets: ["iotdb-1:9091","iotdb-2:9091","iotdb-3:9091"]
+ honor_labels: true
+ - job_name: "datanode"
+ static_configs:
+ - targets: ["iotdb-1:9092","iotdb-2:9092","iotdb-3:9092"]
+ honor_labels: true
+ ```
+
+4. 启动Prometheus。Prometheus
监控数据的默认过期时间为15天,在生产环境中,建议将其调整为180天以上,以对更长时间的历史监控数据进行追踪,启动命令如下所示:
+
+ ```Shell
+ ./prometheus --config.file=prometheus.yml
--storage.tsdb.retention.time=180d
+ ```
+
+5. 确认启动成功。在浏览器中输入
http://IP:port,进入Prometheus,点击进入Status下的Target界面,当看到State均为Up时表示配置成功并已经联通。
+
+ <div style="display: flex;justify-content: space-between;">
+ <img src="https://alioss.timecho.com/docs/img/%E5%90%AF%E5%8A%A8_1.png";
alt="" style="width: 50%;" />
+ <img src="https://alioss.timecho.com/docs/img/%E5%90%AF%E5%8A%A8_2.png";
alt="" style="width: 48%;"/>
+ </div>
+
+### 步骤三:安装Workbench
+
+#### Windows版:
+
+1. 进入iotdb-Workbench-`<version>`的config目录
+
+2.
修改Workbench配置文件:进入`config`文件夹下修改配置文件`application-prod.properties`。若您是在本机安装则无需修改,若是部署在服务器上则需修改IP地址
+
+ | 配置项 | 修改前 | 修改后
|
+ | ---------------- | --------------------------------- |
-------------------------------------- |
+ | pipe.callbackUrl | pipe.callbackUrl=`http://127.0.0.1` |
pipe.callbackUrl=`http://<部署的IP地址>` |
+
+ 
+
+1. 启动程序:请在IoTDB-Workbench-`<version>`的sbin文件夹下执行启动命令
+
+ ```shell
+ # 后台启动Workbench
+ start.bat -d
+ ```
+
+4. 可以通过`jps`命令进行启动是否成功,如图所示即为启动成功:
+
+ 
+
+5.
验证是否成功:浏览器中打开:"http://服务器ip:配置文件中端口"进行访问,例如:"http://127.0.0.1:9190",当出现登录界面时即为成功
+
+ 
+
+#### Linux版:
+
+1. 进入IoTDB-Workbench-`<version>`目录
+
+2.
修改Workbench配置:进入`config`文件夹下修改配置文件`application-prod.properties`。若您是在本机安装则无需修改,若是部署在服务器上则需修改IP地址
+
+ | 配置项 | 修改前 | 修改后
|
+ | ---------------- | --------------------------------- |
-------------------------------------- |
+ | pipe.callbackUrl | pipe.callbackUrl=`http://127.0.0.1` |
pipe.callbackUrl=`http://<部署的IP地址>` |
+
+ 
+
+3. 启动程序:请在IoTDB-Workbench-`<version>`的sbin文件夹下执行启动命令
+
+ ```shell
+ # 后台启动Workbench
+ ./start.sh -d
+ ```
+
+4. 可以通过`jps`命令进行启动是否成功,如图所示即为启动成功:
+
+ 
+
+5. 验证是否成功:浏览器中打开
"http://服务器ip:配置文件中端口"进行访问,例如:"http://127.0.0.1:9190",当出现登录界面时即为成功
+
+ 
+
+## 附录:IoTDB与控制台版本对照表
+
+| 控制台版本号 | 版本说明 |
可支持IoTDB版本 |
+| ------------ | ------------------------------------------------------------
| ---------------- |
+| V1.2.6 | 优化各模块权限控制功能 |
V1.3.1及以上版本 |
+| V1.2.5 | 可视化功能新增“常用模版”概念,所有界面优化补充页面缓存等功能 | V1.3.0及以上版本 |
+| V1.2.4 | 计算功能新增“导入、导出”功能,测点列表新增“时间对齐”字段 | V1.2.2及以上版本 |
+| V1.2.3 | 首页新增“激活详情”,新增分析等功能 | V1.2.2及以上版本 |
+| V1.2.2 | 优化“测点描述”展示内容等功能 | V1.2.2及以上版本
|
+| V1.2.1 | 数据同步界面新增“监控面板”,优化Prometheus提示信息 | V1.2.2及以上版本 |
+| V1.2.0 | 全新Workbench版本升级 |
V1.2.0及以上版本 |
+
diff --git
a/src/zh/UserGuide/latest/Deployment-and-Maintenance/workbench-deployment.md.md
b/src/zh/UserGuide/latest/Deployment-and-Maintenance/workbench-deployment.md.md
new file mode 100644
index 0000000..3e8bdb0
--- /dev/null
+++
b/src/zh/UserGuide/latest/Deployment-and-Maintenance/workbench-deployment.md.md
@@ -0,0 +1,221 @@
+<!--
+
+ Licensed to the Apache Software Foundation (ASF) under one
+ or more contributor license agreements. See the NOTICE file
+ distributed with this work for additional information
+ regarding copyright ownership. The ASF licenses this file
+ to you under the Apache License, Version 2.0 (the
+ "License"); you may not use this file except in compliance
+ with the License. You may obtain a copy of the License at
+
+ http://www.apache.org/licenses/LICENSE-2.0
+
+ Unless required by applicable law or agreed to in writing,
+ software distributed under the License is distributed on an
+ "AS IS" BASIS, WITHOUT WARRANTIES OR CONDITIONS OF ANY
+ KIND, either express or implied. See the License for the
+ specific language governing permissions and limitations
+ under the License.
+
+-->
+# 可视化控制台部署
+
+可视化控制台是IoTDB配套工具之一。它用于数据库部署实施、运维管理、应用开发各阶段的官方应用工具体系,让数据库的使用、运维和管理更加简单、高效,真正实现数据库低成本的管理和运维。本文档将帮助您安装Workbench。
+
+ <div style="display: flex;justify-content: space-between;">
+ <img src="https://alioss.timecho.com/docs/img/%E9%A6%96%E9%A1%B5.PNG";
alt=" " style="width: 50%;"/>
+ <img
src="https://alioss.timecho.com/docs/img/%E6%B5%8B%E7%82%B9%E5%88%97%E8%A1%A8.PNG";
alt="" style="width: 50%;"/>
+ </div>
+
+## 安装准备
+
+| 准备内容 | 名称 | 版本要求
| 官方链接 |
+| :------: | :-----------------------: |
:----------------------------------------------------------: |
:----------------------------------------------------: |
+| 操作系统 | Windows或Linux | -
| - |
+| 安装环境 | JDK | 需要 >= V1.8.0_162(推荐使用 11 或者
17,下载时请根据机器配置选择ARM或x64安装包) |
https://www.oracle.com/java/technologies/downloads/ |
+| 相关软件 | Prometheus | 需要 >=V2.30.3
| https://prometheus.io/download/ |
+| 数据库 | IoTDB | 需要>=V1.2.0企业版
| 您可联系商务或技术支持获取 |
+| 控制台 | IoTDB-Workbench-`<version>`| -
| 您可根据附录版本对照表进行选择后联系商务或技术支持获取 |
+
+## 安装步骤
+
+### 步骤一:IoTDB 开启监控指标采集
+
+1. 打开监控配置项。IoTDB中监控有关的配置项默认是关闭的,在部署监控面板前,您需要打开相关配置项(注意开启监控配置后需要重启服务)。
+
+ <table>
+ <tr>
+ <th>配置项</th>
+ <th>所在配置文件</th>
+ <th>配置说明</th>
+ </tr>
+ <tr>
+ <td>cn_metric_reporter_list</td>
+ <td rowspan="3">conf/iotdb-confignode.properties</td>
+ <td>将配置项取消注释,值设置为PROMETHEUS</td>
+ </tr>
+ <tr>
+ <td>cn_metric_level</td>
+ <td>将配置项取消注释,值设置为IMPORTANT</td>
+ </tr>
+ <tr>
+ <td>cn_metric_prometheus_reporter_port</td>
+ <td>将配置项取消注释,可保持默认设置9091,如设置其他端口,不与其他端口冲突即可</td>
+ </tr>
+ <tr>
+ <td>dn_metric_reporter_list</td>
+ <td rowspan="4">conf/iotdb-datanode.properties</td>
+ <td>将配置项取消注释,值设置为PROMETHEUS</td>
+ </tr>
+ <tr>
+ <td>dn_metric_level</td>
+ <td>将配置项取消注释,值设置为IMPORTANT</td>
+ </tr>
+ <tr>
+ <td>dn_metric_prometheus_reporter_port</td>
+ <td>将配置项取消注释,可保持默认设置9092,如设置其他端口,不与其他端口冲突即可</td>
+ </tr>
+ <tr>
+ <td>dn_metric_internal_reporter_type</td>
+ <td>将配置项取消注释,值设置为IOTDB</td>
+ </tr>
+ <tr>
+ <td>enable_audit_log</td>
+ <td rowspan="3">conf/iotdb-common.properties</td>
+ <td>将配置项取消注释,值设置为true</td>
+ </tr>
+ <tr>
+ <td>audit_log_storage</td>
+ <td>将配置项取消注释</td>
+ </tr>
+ <tr>
+ <td>audit_log_operation</td>
+ <td>将配置项取消注释</td>
+ </tr>
+ </table>
+
+2. 重启所有节点。修改3个节点的监控指标配置后,可重新启动所有节点的confignode和datanode服务:
+
+ ```shell
+ ./sbin/stop-standalone.sh #先停止confignode和datanode
+ ./sbin/start-confignode.sh -d #启动confignode
+ ./sbin/start-datanode.sh -d #启动datanode
+ ```
+
+3. 重启后,通过客户端确认各节点的运行状态,若状态都为Running,则为配置成功:
+
+ 
+
+### 步骤二:安装、配置Prometheus监控
+
+1.
确保Prometheus安装完成(官方安装说明可参考:https://prometheus.io/docs/introduction/first_steps/)
+2. 解压安装包,进入解压后的文件夹:
+
+ ```Shell
+ tar xvfz prometheus-*.tar.gz
+ cd prometheus-*
+ ```
+
+3. 修改配置。修改配置文件prometheus.yml如下
+ 1. 新增confignode任务收集ConfigNode的监控数据
+ 2. 新增datanode任务收集DataNode的监控数据
+
+ ```shell
+ global:
+ scrape_interval: 15s
+ evaluation_interval: 15s
+ scrape_configs:
+ - job_name: "prometheus"
+ static_configs:
+ - targets: ["localhost:9090"]
+ - job_name: "confignode"
+ static_configs:
+ - targets: ["iotdb-1:9091","iotdb-2:9091","iotdb-3:9091"]
+ honor_labels: true
+ - job_name: "datanode"
+ static_configs:
+ - targets: ["iotdb-1:9092","iotdb-2:9092","iotdb-3:9092"]
+ honor_labels: true
+ ```
+
+4. 启动Prometheus。Prometheus
监控数据的默认过期时间为15天,在生产环境中,建议将其调整为180天以上,以对更长时间的历史监控数据进行追踪,启动命令如下所示:
+
+ ```Shell
+ ./prometheus --config.file=prometheus.yml
--storage.tsdb.retention.time=180d
+ ```
+
+5. 确认启动成功。在浏览器中输入
http://IP:port,进入Prometheus,点击进入Status下的Target界面,当看到State均为Up时表示配置成功并已经联通。
+
+ <div style="display: flex;justify-content: space-between;">
+ <img src="https://alioss.timecho.com/docs/img/%E5%90%AF%E5%8A%A8_1.png";
alt="" style="width: 50%;" />
+ <img src="https://alioss.timecho.com/docs/img/%E5%90%AF%E5%8A%A8_2.png";
alt="" style="width: 48%;"/>
+ </div>
+
+### 步骤三:安装Workbench
+
+#### Windows版:
+
+1. 进入iotdb-Workbench-`<version>`的config目录
+
+2.
修改Workbench配置文件:进入`config`文件夹下修改配置文件`application-prod.properties`。若您是在本机安装则无需修改,若是部署在服务器上则需修改IP地址
+
+ | 配置项 | 修改前 | 修改后
|
+ | ---------------- | --------------------------------- |
-------------------------------------- |
+ | pipe.callbackUrl | pipe.callbackUrl=`http://127.0.0.1` |
pipe.callbackUrl=`http://<部署的IP地址>` |
+
+ 
+
+1. 启动程序:请在IoTDB-Workbench-`<version>`的sbin文件夹下执行启动命令
+
+ ```shell
+ # 后台启动Workbench
+ start.bat -d
+ ```
+
+4. 可以通过`jps`命令进行启动是否成功,如图所示即为启动成功:
+
+ 
+
+5.
验证是否成功:浏览器中打开:"http://服务器ip:配置文件中端口"进行访问,例如:"http://127.0.0.1:9190",当出现登录界面时即为成功
+
+ 
+
+#### Linux版:
+
+1. 进入IoTDB-Workbench-`<version>`目录
+
+2.
修改Workbench配置:进入`config`文件夹下修改配置文件`application-prod.properties`。若您是在本机安装则无需修改,若是部署在服务器上则需修改IP地址
+
+ | 配置项 | 修改前 | 修改后
|
+ | ---------------- | --------------------------------- |
-------------------------------------- |
+ | pipe.callbackUrl | pipe.callbackUrl=`http://127.0.0.1` |
pipe.callbackUrl=`http://<部署的IP地址>` |
+
+ 
+
+3. 启动程序:请在IoTDB-Workbench-`<version>`的sbin文件夹下执行启动命令
+
+ ```shell
+ # 后台启动Workbench
+ ./start.sh -d
+ ```
+
+4. 可以通过`jps`命令进行启动是否成功,如图所示即为启动成功:
+
+ 
+
+5. 验证是否成功:浏览器中打开
"http://服务器ip:配置文件中端口"进行访问,例如:"http://127.0.0.1:9190",当出现登录界面时即为成功
+
+ 
+
+## 附录:IoTDB与控制台版本对照表
+
+| 控制台版本号 | 版本说明 |
可支持IoTDB版本 |
+| ------------ | ------------------------------------------------------------
| ---------------- |
+| V1.2.6 | 优化各模块权限控制功能 |
V1.3.1及以上版本 |
+| V1.2.5 | 可视化功能新增“常用模版”概念,所有界面优化补充页面缓存等功能 | V1.3.0及以上版本 |
+| V1.2.4 | 计算功能新增“导入、导出”功能,测点列表新增“时间对齐”字段 | V1.2.2及以上版本 |
+| V1.2.3 | 首页新增“激活详情”,新增分析等功能 | V1.2.2及以上版本 |
+| V1.2.2 | 优化“测点描述”展示内容等功能 | V1.2.2及以上版本
|
+| V1.2.1 | 数据同步界面新增“监控面板”,优化Prometheus提示信息 | V1.2.2及以上版本 |
+| V1.2.0 | 全新Workbench版本升级 |
V1.2.0及以上版本 |
+