This is an automated email from the ASF dual-hosted git repository.

caogaofei pushed a commit to branch main
in repository https://gitbox.apache.org/repos/asf/iotdb-docs.git
The following commit(s) were added to refs/heads/main by this push:
new bd609be Fix display format
bd609be is described below
commit bd609beceb8e9a0278bc1b603559a4733f1d2ef6
Author: majialin <[email protected]>
AuthorDate: Tue Aug 13 18:33:42 2024 +0800
Fix display format
---
src/UserGuide/Master/Tools-System/Benchmark.md | 72 +++++++++++-----------
.../Master/User-Manual/Database-Programming.md | 2 +-
src/UserGuide/V1.2.x/Tools-System/Benchmark.md | 42 ++++++-------
.../V1.2.x/User-Manual/Database-Programming.md | 2 +-
src/UserGuide/latest/Tools-System/Benchmark.md | 44 ++++++-------
.../latest/User-Manual/Database-Programming.md | 2 +-
.../Master/API/Programming-CSharp-Native-API.md | 4 +-
src/zh/UserGuide/Master/Tools-System/Benchmark.md | 38 ++++++------
.../Master/User-Manual/Database-Programming.md | 4 +-
.../V1.2.x/API/Programming-CSharp-Native-API.md | 4 +-
src/zh/UserGuide/V1.2.x/Tools-System/Benchmark.md | 30 ++++-----
.../latest/API/Programming-CSharp-Native-API.md | 4 +-
src/zh/UserGuide/latest/Tools-System/Benchmark.md | 40 ++++++------
.../latest/User-Manual/Database-Programming.md | 4 +-
14 files changed, 145 insertions(+), 147 deletions(-)
diff --git a/src/UserGuide/Master/Tools-System/Benchmark.md
b/src/UserGuide/Master/Tools-System/Benchmark.md
index 2bd6c46..8f88659 100644
--- a/src/UserGuide/Master/Tools-System/Benchmark.md
+++ b/src/UserGuide/Master/Tools-System/Benchmark.md
@@ -25,30 +25,28 @@ IoT-benchmark is a time-series database benchmarking tool
based on Java and big
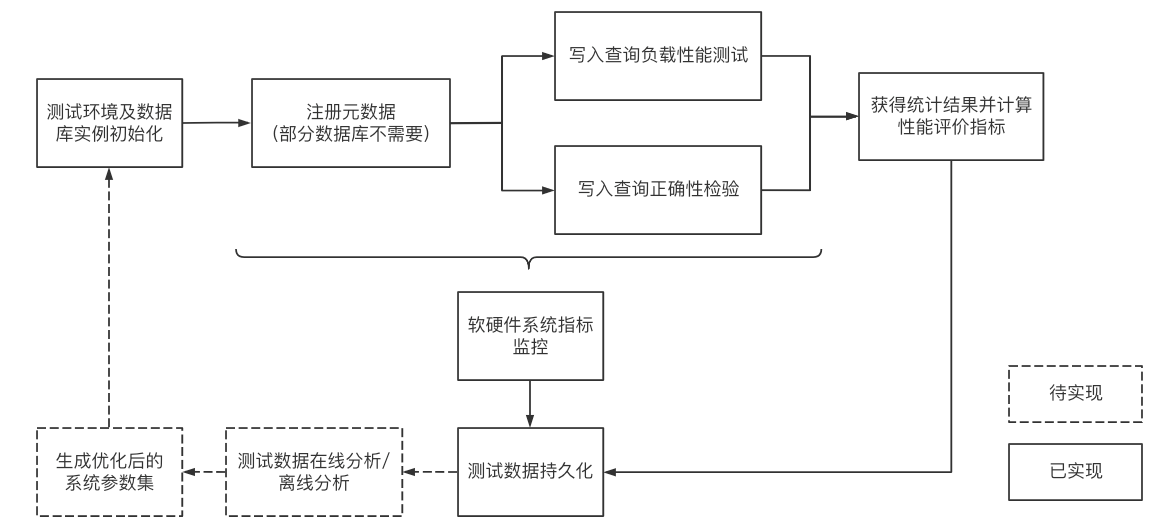
Figure 1-1 below includes the test benchmark process and other extended
functions. These processes can be unified by IoT-benchmark. IoT Benchmark
supports a variety of workloads, including **pure write, pure query, write
query mixed**, etc., supports **software and hardware system monitoring, test
metric measurement** and other monitoring functions, and also realizes
**initializing the database automatically, test data analysis and system
parameter optimization** functions.
-
+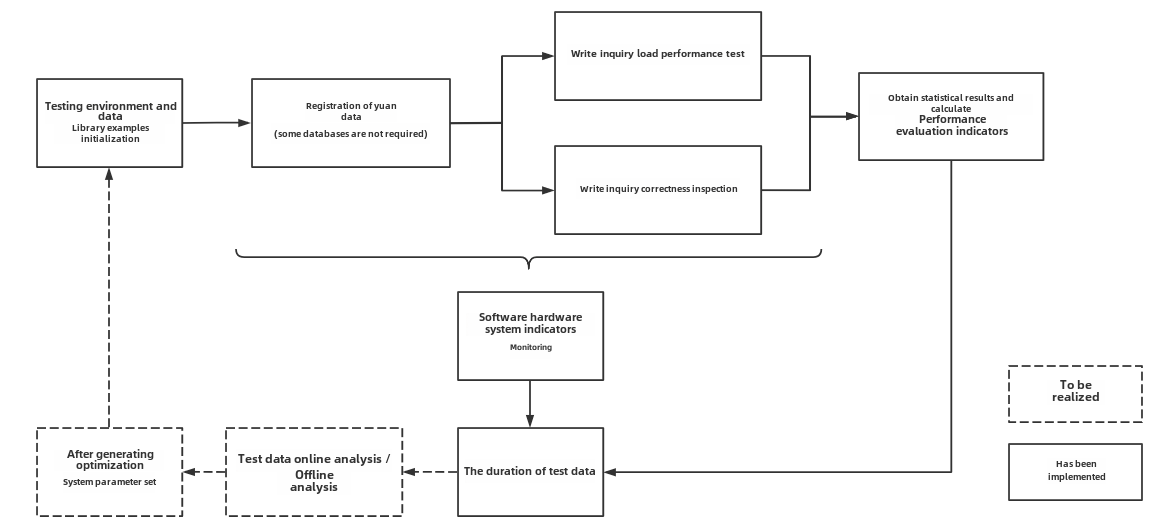
Figure 1-1
Referring to the YCSB test tool's design idea of separating the three
components of workload generation, performance metric measurement and database
interface, the modular design of IoT-benchmark is shown in Figure 1-2.
Different from the YCSB-based test tool system, IoT-benchmark adds a system
monitoring module to support the persistence of test data and system monitoring
data. In addition, some special load testing functions especially designed for
time series data scenarios have been [...]
-
+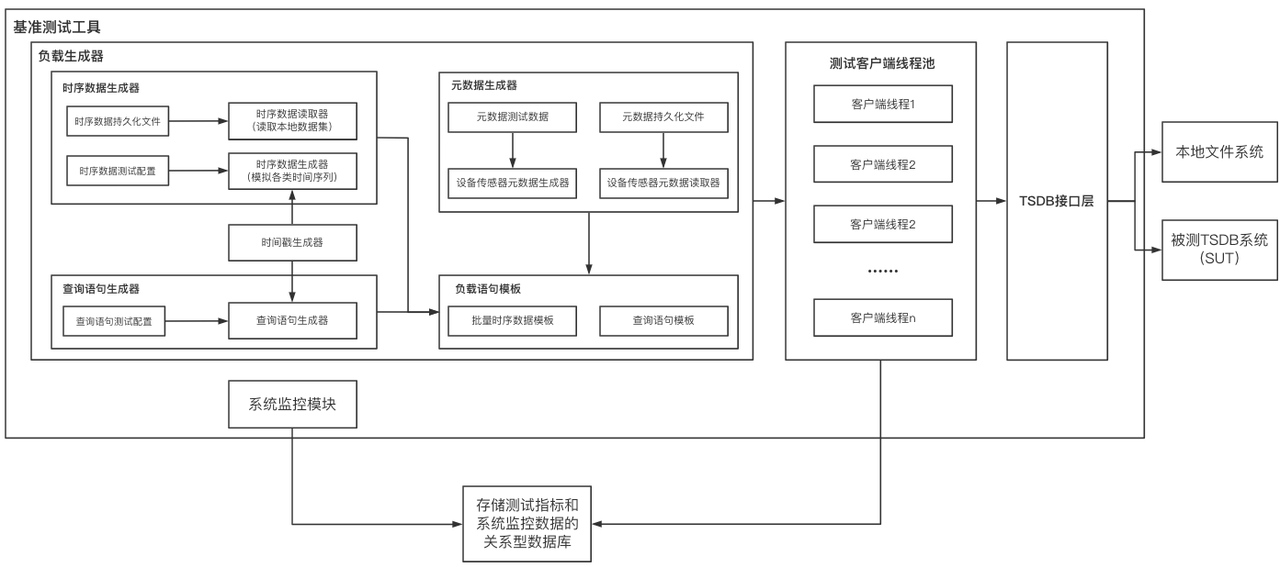
Figure 1-2
Currently IoT-benchmark supports the following time series databases, versions
and connection methods:
-| Database | DB-Engines Rank | Version | Connection Methods
|
-| --------------- | --------------- | ------- |
-------------------------------------------------------- |
-| InfluxDB | 1 | v1.x | SDK
|
-| v2.0 | | |
|
-| TimescaleDB | 5 | -- | jdbc
|
-| OpenTSDB | 8 | -- | Http Request
|
-| QuestDB | 10 | v6.0.7 | jdbc
|
-| TDengine | 13 | 2.2.0.2 | jdbc
|
-| VictoriaMetrics | 16 | v1.64.0 | Http Request
|
-| KairosDB | 17 | -- | Http Request
|
-| IoTDB | 19 | v1.0 |
jdbc、sessionByTablet、sessionByRecord、sessionByRecords |
-| v0.13 | | |
|
+| Database | Version | Connection mmethod
|
+| --------------- | ------- |
-------------------------------------------------------- |
+| InfluxDB | v1.x <br> v2.0 | SDK
| |
+| TimescaleDB | -- | jdbc
|
+| OpenTSDB | -- | Http Request
|
+| QuestDB | v6.0.7 | jdbc
|
+| TDengine | v2.2.0.2 | jdbc
|
+| VictoriaMetrics | v1.64.0 | Http Request
|
+| KairosDB | -- | Http Request
|
+| IoTDB | v1.x <br> v0.13 |
jdbc、sessionByTablet、sessionByRecord、sessionByRecords |
Table 1-1 Comparison of big data test benchmarks
@@ -69,22 +67,22 @@ Table 1-1 Comparison of big data test benchmarks
### IoT Benchmark's Test Package Structure
-The directory structure of the test package is shown in Figure 1-3 below. The
test configuration file is conf/config.properties, and the test startup scripts
are benchmark.sh (Linux & MacOS) and benchmark.bat (Windows). The detailed
usage of the files is shown in Table 1-2.
+The directory structure of the test package is shown in Figure 1-3 below. The
test configuration file is conf/config.properties, and the test startup scripts
are benchmark\.sh (Linux & MacOS) and benchmark.bat (Windows). The detailed
usage of the files is shown in Table 1-2.
-
+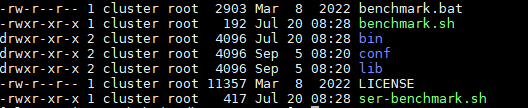
Figure 1-3 List of files and folders
| Name | File | Usage |
| ---------------- | ----------------- | -------------------------------- |
| benchmark.bat | - | Startup script on Windows |
-| benchmark.sh | - | Startup script on Linux/Mac |
+| benchmark\.sh | - | Startup script on Linux/Mac |
| conf | config.properties | Test scenario configuration file |
| logback.xml | - | Log output configuration file |
| lib | - | Dependency library |
| LICENSE | - | License file |
-| bin | startup.sh | Init script folder |
-| ser-benchmark.sh | - | Monitor mode startup script |
+| bin | startup\.sh | Init script folder |
+| ser-benchmark\.sh | - | Monitor mode startup script |
Table 1-2 Usage list of files and folders
@@ -99,7 +97,7 @@ Table 1-2 Usage list of files and folders
All the log files of the test are stored in the logs folder, and the test
results are stored in the data/csvOutput folder after the test is completed.
For example, after the test, we get the following result matrix:
-
+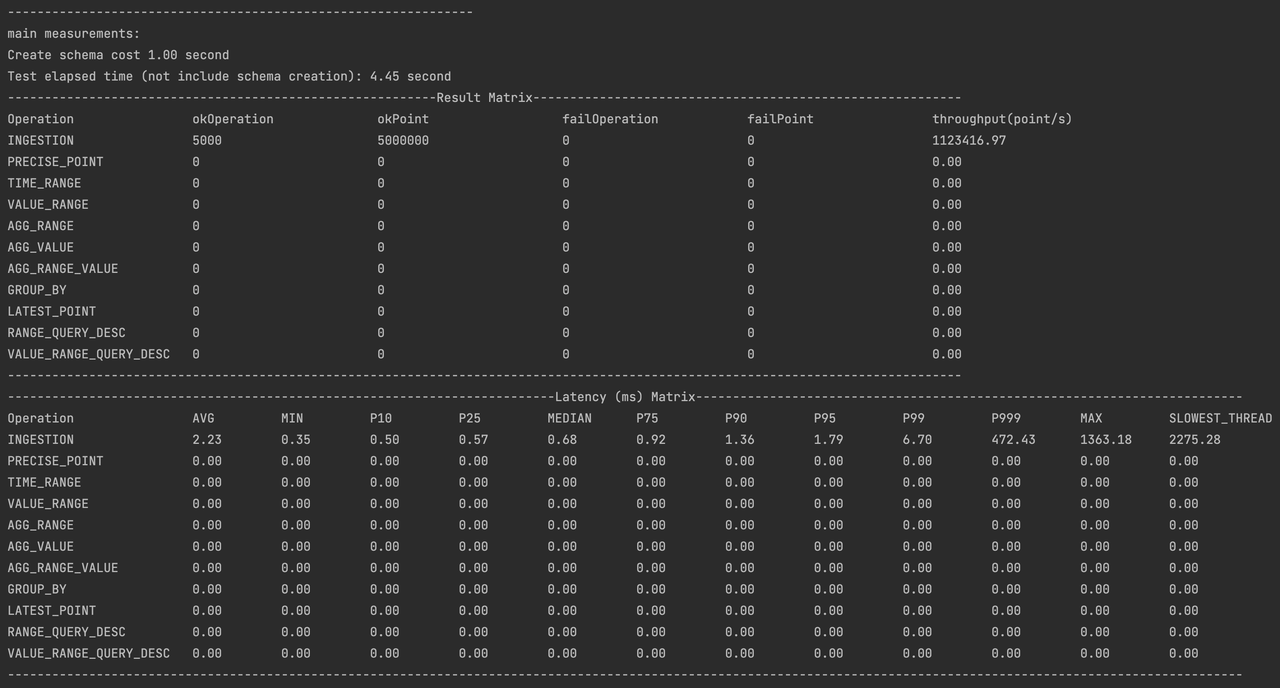
- Result Matrix
- OkOperation: successful operations
@@ -117,7 +115,7 @@ This chapter mainly explains the purpose and configuration
method of the main pa
### Working Mode and Operation Proportion
-- The working mode parameter "BENCHMARK_WORK_MODE" can be selected as "default
mode" and "server monitoring"; the "server monitoring" mode can be started
directly by executing the ser-benchmark.sh script, and the script will
automatically modify this parameter. "Default mode" is a commonly used test
mode, combined with the configuration of the OPERATION_PROPORTION parameter to
achieve the definition of test operation proportions of "pure write", "pure
query" and "read-write mix".
+- The working mode parameter "BENCHMARK_WORK_MODE" can be selected as "default
mode" and "server monitoring"; the "server monitoring" mode can be started
directly by executing the ser-benchmark\.sh script, and the script will
automatically modify this parameter. "Default mode" is a commonly used test
mode, combined with the configuration of the OPERATION_PROPORTION parameter to
achieve the definition of test operation proportions of "pure write", "pure
query" and "read-write mix".
- When running ServerMode to monitor the operating environment of the time
series database under test, IoT-benchmark relies on sysstat software related
commands; if MySQL or IoTDB is selected for persistent test process data, this
type of database needs to be installed; the recording mode of ServerMode and
CSV can only be used in the Linux system to record relevant system information
during the test. Therefore, we recommend using MacOs or Linux system. This
article uses Linux (Centos7) [...]
@@ -126,7 +124,7 @@ Table 1-3 Test mode
| Mode Name | BENCHMARK_WORK_MODE | Description
|
| ------------ | ------------------- |
------------------------------------------------------------ |
| default mode | testWithDefaultPath | Supports mixed workloads with multiple
read and write operations |
-| server mode | serverMODE | Server resource usage monitoring mode
(running in this mode is started by the ser-benchmark.sh script, no need to
manually configure this parameter) |
+| server mode | serverMODE | Server resource usage monitoring mode
(running in this mode is started by the ser-benchmark\.sh script, no need to
manually configure this parameter) |
### Server Connection Information
@@ -199,7 +197,7 @@ We take the application of CRRC Qingdao Sifang Vehicle
Research Institute Co., L
Test objective: Simulate the actual needs of switching time series databases
in the scene of CRRC Qingdao Sifang Institute, and compare the performance of
the expected IoTDB and KairosDB used by the original system.
-测试环境:为了保证在实验过程中消除其他无关服务与进程对数据库性能的影响,以及不同数据库之间的相互影响,本实验中的本地数据库均部署并运行在资源配置相同的多个独立的虚拟机上。因此,本实验搭建了
4 台 Linux( CentOS7 /x86) 虚拟机,并分别在上面部署了IoT-benchmark、
IoTDB数据库、KairosDB数据库、MySQL数据库。每一台虚拟机的具体资源配置如表2-1所示。每一台虚拟机的具体用途如表2-2所示。Test
environment: In order to ensure that the impact of other irrelevant services
and processes on database performance and the mutual influence between
different databases are eliminated during the experiment, the local databases
in this experiment are deployed and run on [...]
+Test environment: In order to ensure that the impact of other irrelevant
services and processes on database performance and the mutual influence between
different databases are eliminated during the experiment, the local databases
in this experiment are deployed and run on multiple independent virtual servers
with the same resource configuration. Therefore, this experiment set up 4 Linux
(CentOS7 /x86) virtual machines, and deployed IoT-benchmark, IoTDB database,
KairosDB database, and M [...]
Table 2-1 Virtual machine configuration information
@@ -209,7 +207,7 @@ Table 2-1 Virtual machine configuration information
| number of CPU cores | 16 |
| memory | 32G |
| hard disk | 200G |
-| network | 千兆 |
+| network | Gigabit |
Table 2-2 Virtual machine usage
@@ -251,41 +249,41 @@ Table 2-3 Configuration parameter information
| TEST_DATA_STORE_PW | admin | |
| REMARK | demo | |
-First, start the tested time series databases Apache-IoTDB and KairosDB on
172.21.4.3 and 172.21.4.4 respectively, and then start server resource
monitoring through the ser-benchamrk.sh script on 172.21.4.2, 172.21.4.3 and
172.21.4.4 (Figure 2-1). Then modify the conf/config.properties files in the
iotdb-0.13-0.0.1 and kairosdb-0.0.1 folders in 172.21.4.2 according to Table
2-3 to meet the test requirements. Use benchmark.sh to start the writing test
of Apache-IoTDB and KairosDB successively.
+First, start the tested time series databases Apache-IoTDB and KairosDB on
172.21.4.3 and 172.21.4.4 respectively, and then start server resource
monitoring through the ser-benchamrk\.sh script on 172.21.4.2, 172.21.4.3 and
172.21.4.4 (Figure 2-1). Then modify the conf/config.properties files in the
iotdb-0.13-0.0.1 and kairosdb-0.0.1 folders in 172.21.4.2 according to Table
2-3 to meet the test requirements. Use benchmark\.sh to start the writing test
of Apache-IoTDB and KairosDB successively.
-
+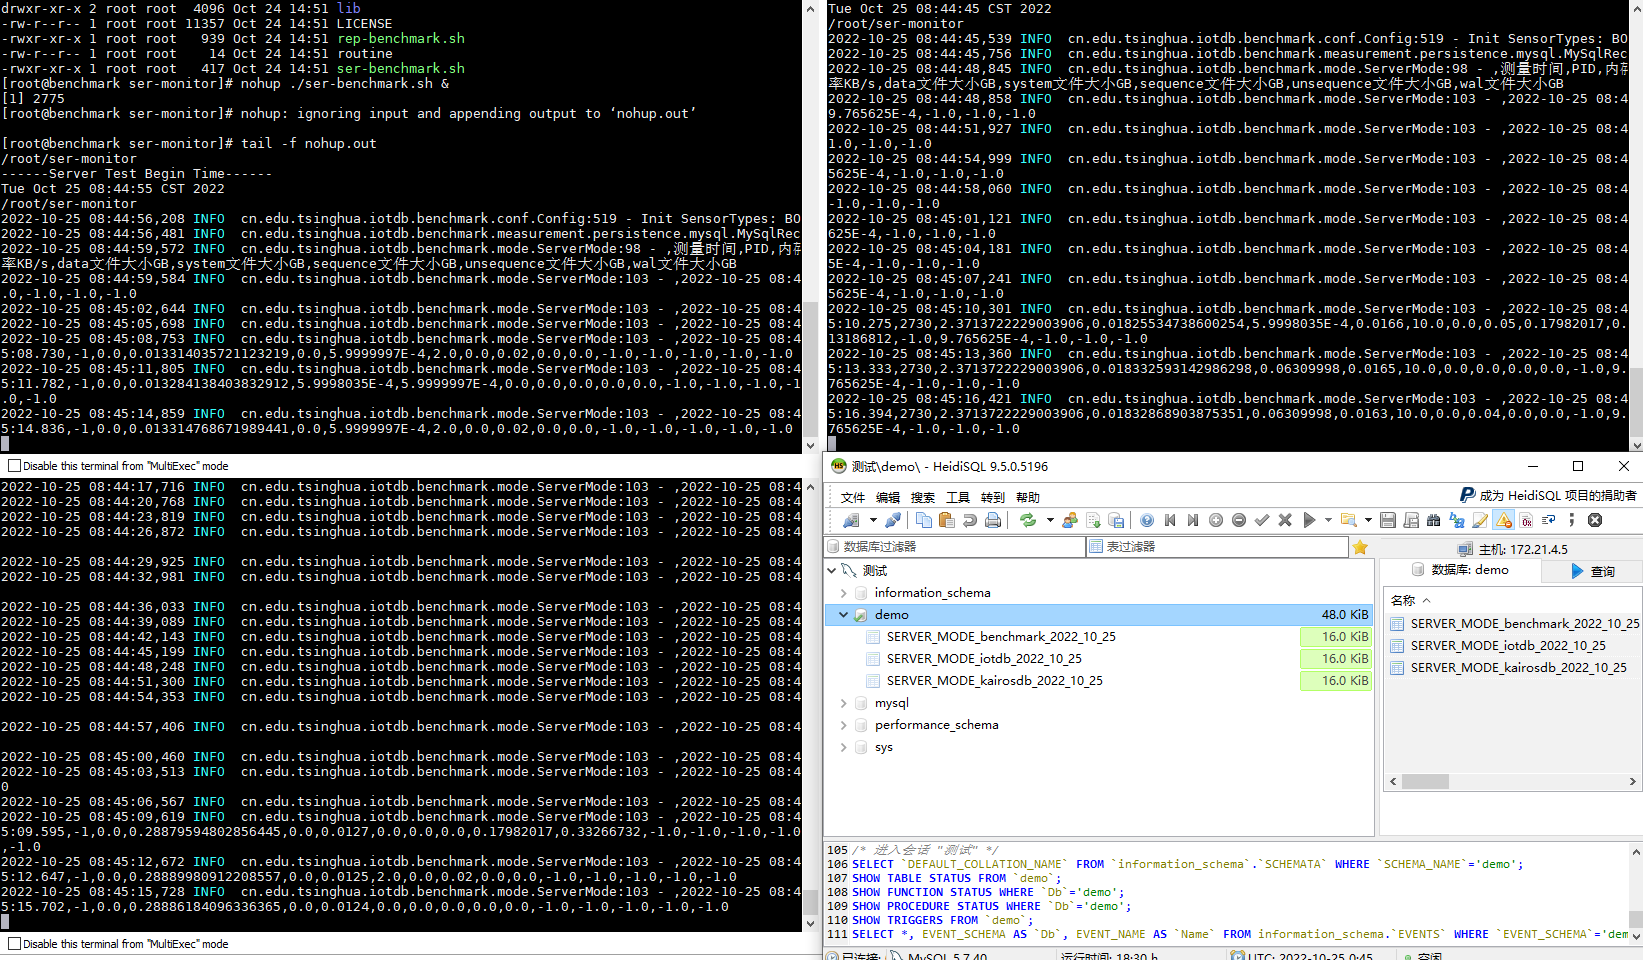
Figure 2-1 Server monitoring tasks
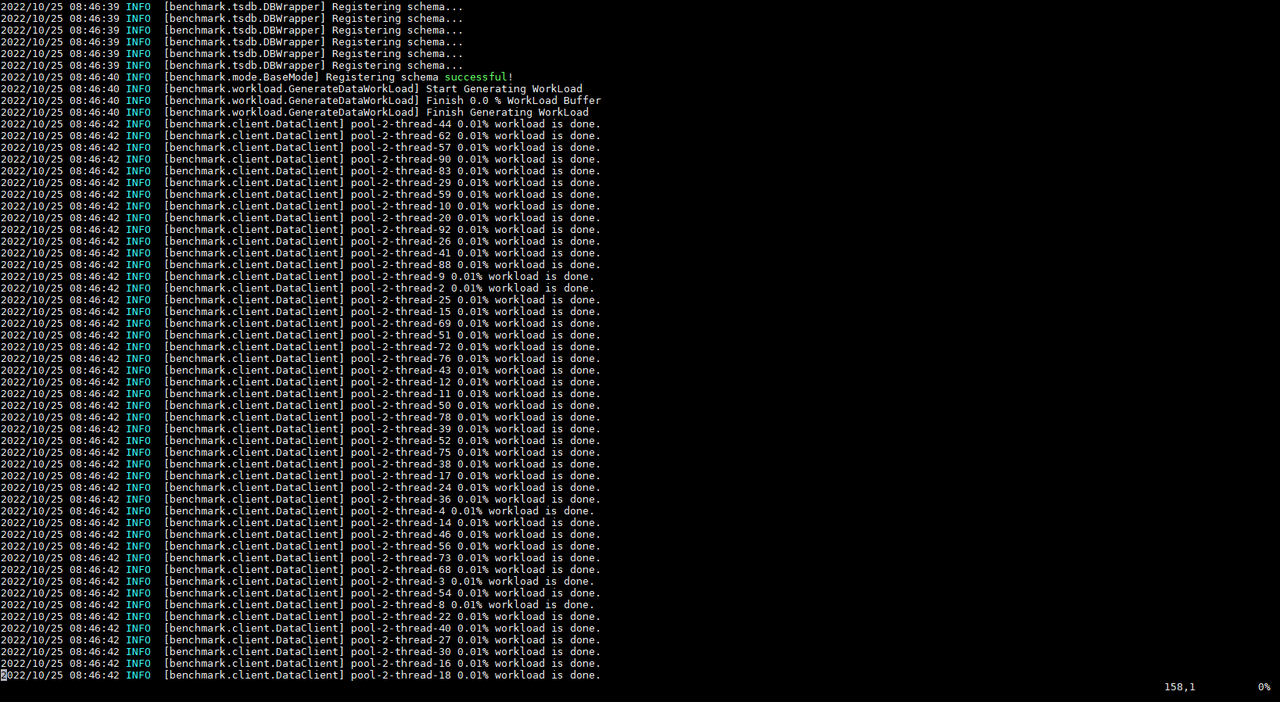
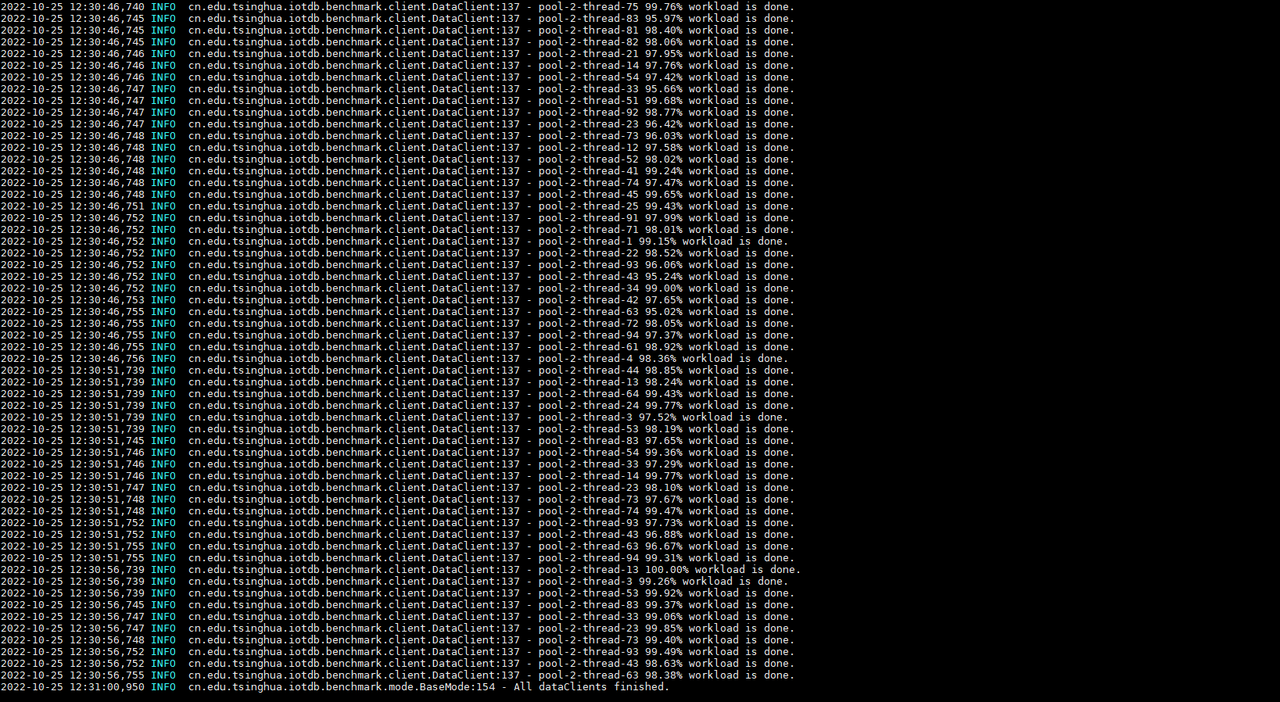
For example, if we first start the test on KairosDB, IoT-benchmark will create
a CONFIG data table in the MySQL database to store the configuration
information of this test (Figure 2-2), and there will be a log output of the
current test progress during the test execution (Figure 2-3) . When the test is
completed, the test result will be output (Figure 2-3), and the result will be
written into the FINAL_RESULT data table (Figure 2-4).
-
+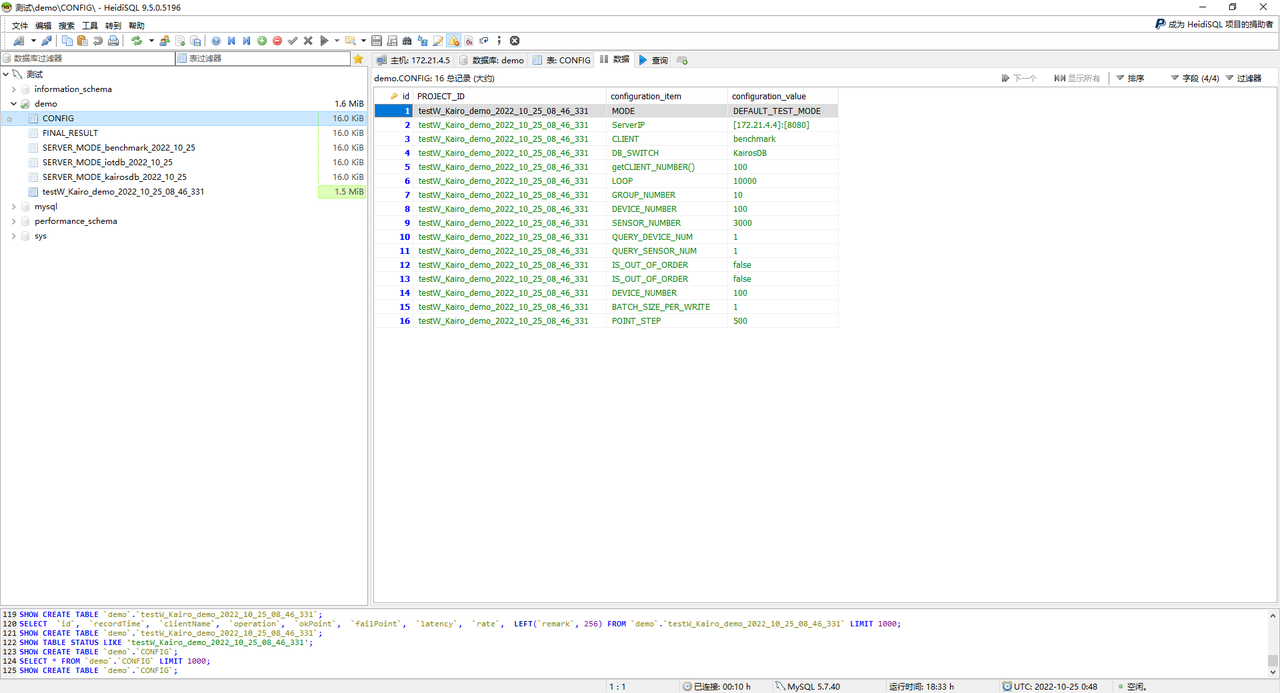
Figure 2-2 Test configuration information table
-
-
-
-
+
+
+
+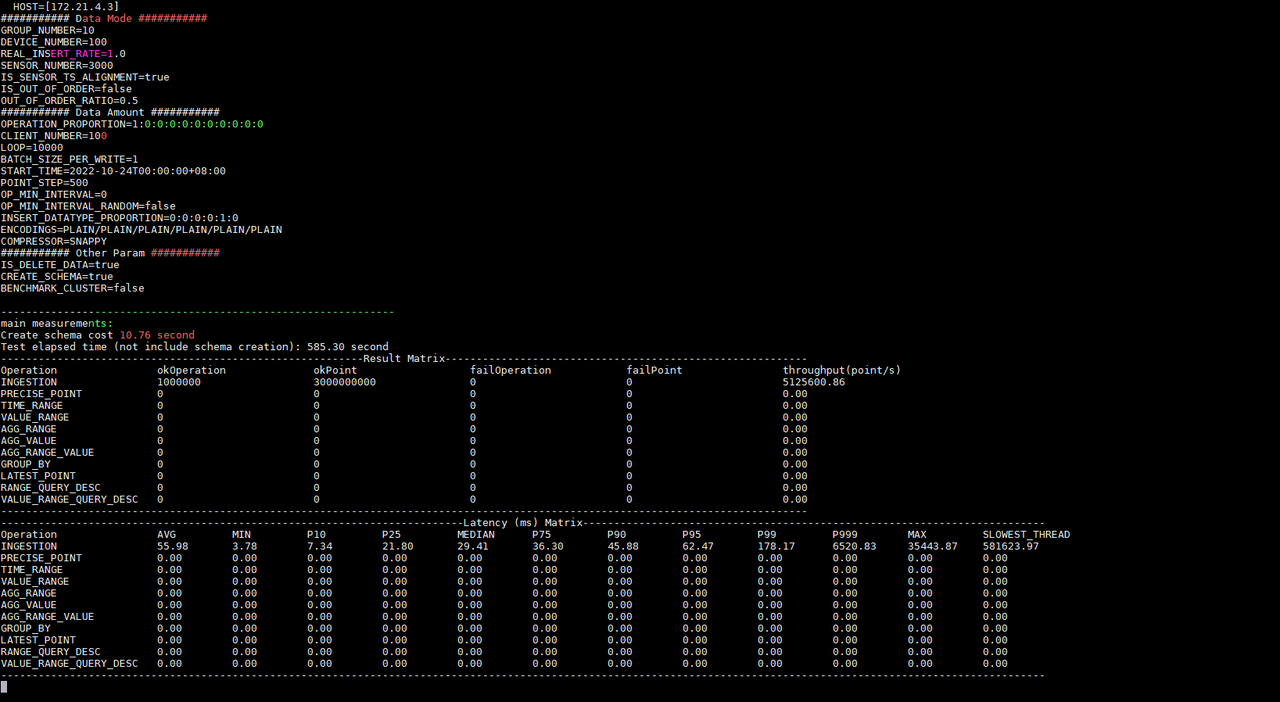
Figure 2-3 Test progress and results
-
+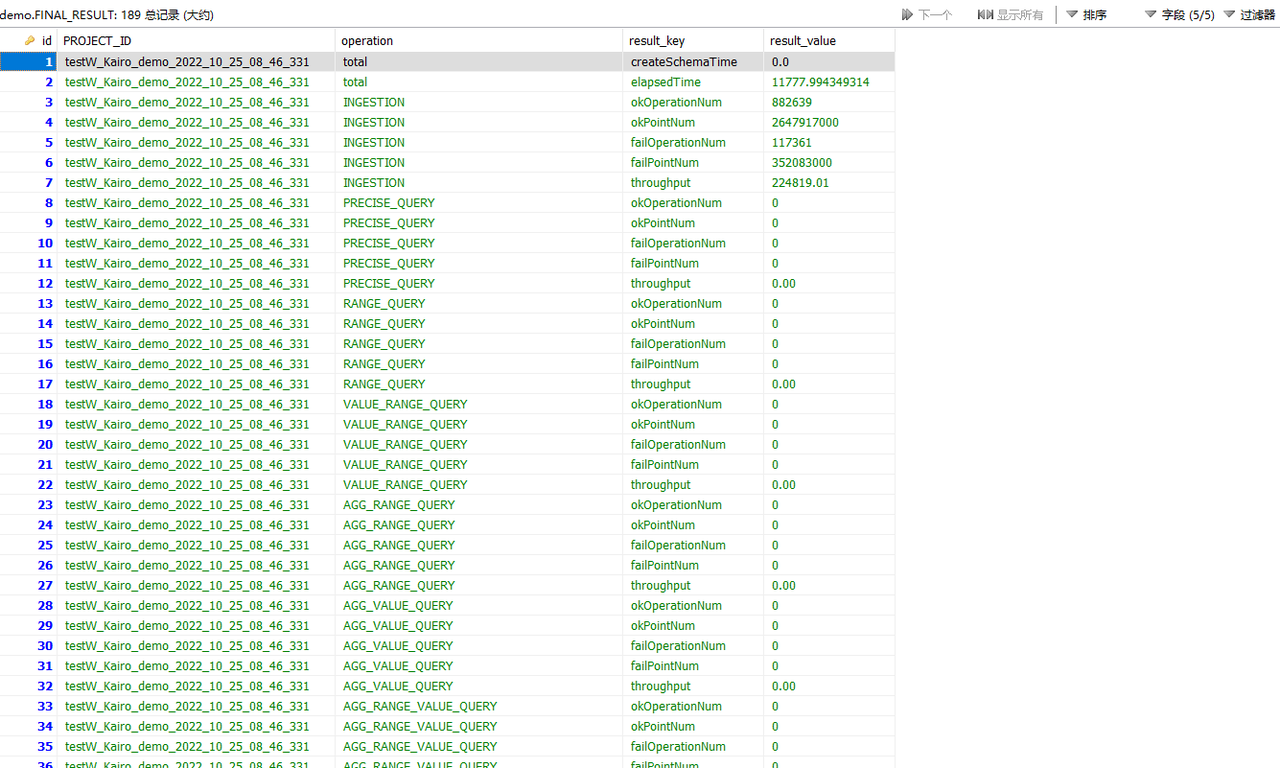
Figure 2-4 Test result table
Afterwards, we will start the test on Apache-IoTDB. The same IoT-benchmark
will write the test configuration information in the MySQL database CONFIG data
table. During the test execution, there will be a log to output the current
test progress. When the test is completed, the test result will be output, and
the result will be written into the FINAL_RESULT data table.
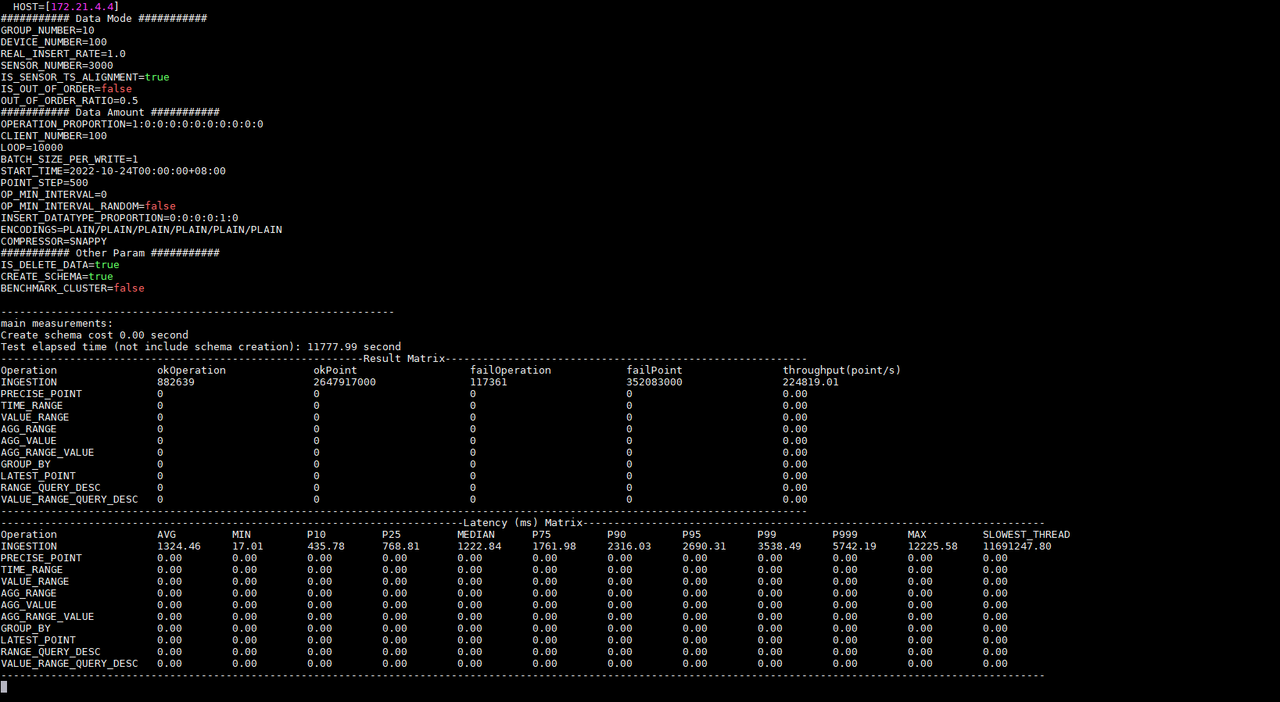
-依照测试结果信息我们知道同样的配置写入Apache-IoTDB和KairosDB写入延时时间分别为:55.98ms和1324.45ms;写入吞吐分别为:5,125,600.86点/秒和224,819.01点/秒;测试分别执行了585.30秒和11777.99秒。并且KairosDB有写入失败出现,排查后发现是数据磁盘使用率已达到100%,无磁盘空间继续接收数据。而Apache-IoTDB无写入失败现象,全部数据写入完毕后占用磁盘空间仅为4.7G(如图2-5所示);从写入吞吐和磁盘占用情况上看Apache-IoTDB均优于KairosDB。当然后续还有其他测试来从多方面观察和对比,比如查询性能、文件压缩比、数据安全性等。According
to the test result information, we know that under the same configuration the
write delay times of Apache-IoTDB and KairosDB are 55.98ms and 1324.45ms
respectively; the [...]
+According to the test result information, we know that under the same
configuration the write delay times of Apache-IoTDB and KairosDB are 55.98ms
and 1324.45ms respectively; the write throughputs are 5,125,600.86
points/second and 224,819.01 points/second respectively; the tests were
executed respectively 585.30 seconds and 11777.99 seconds. And KairosDB has a
write failure. After investigation, it is found that the data disk usage has
reached 100%, and there is no disk space to continu [...]
-
+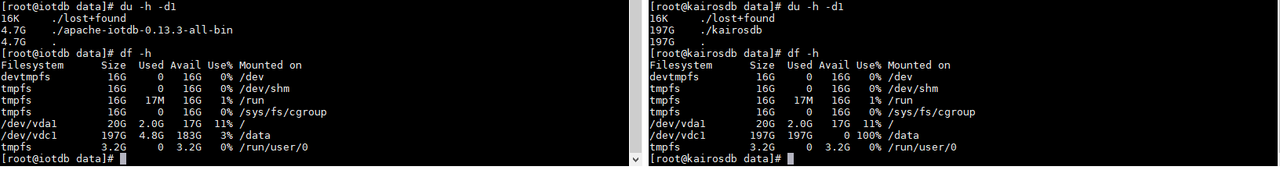
Figure 2-5 Disk usage
So what is the resource usage of each server during the test? What is the
specific performance of each write operation? At this time, we can visualize
the data in the server monitoring table and test process recording table by
installing and using Tableau. The use of Tableau will not be introduced in this
article. After connecting to the data table for test data persistence, the
specific results are as follows (taking Apache-IoTDB as an example):
-
-
+
+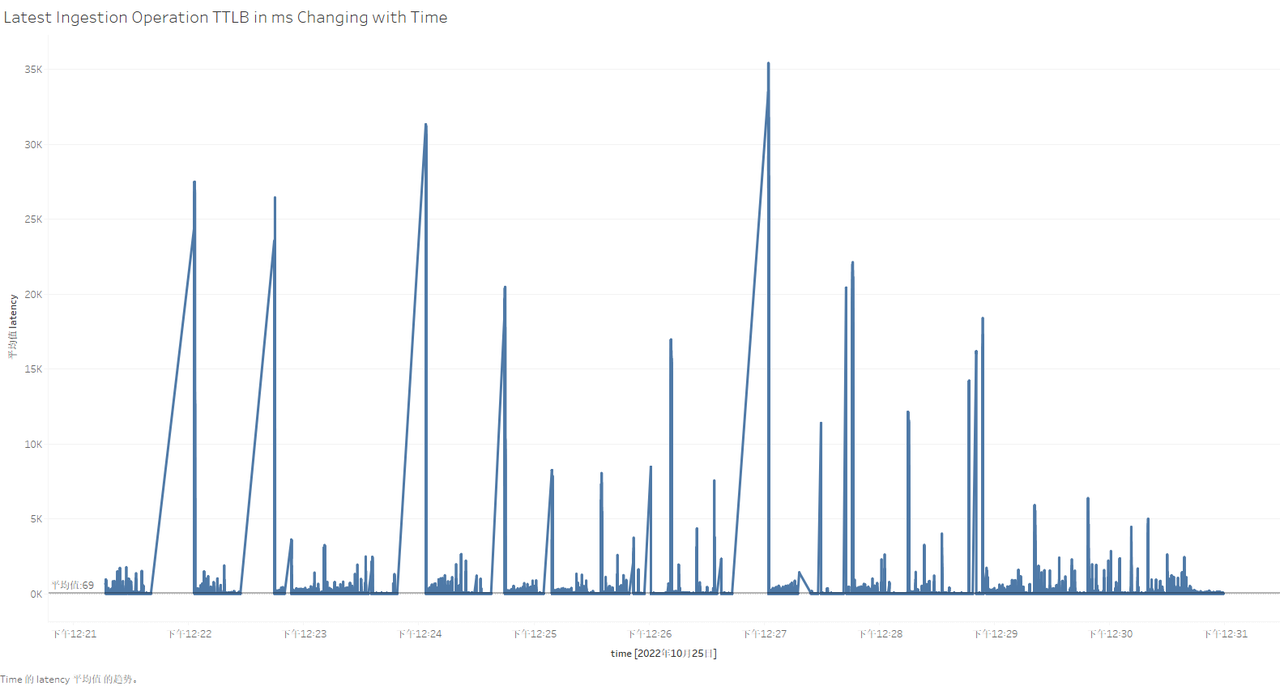
Figure 2-6 Visualization of testing process in Tableau
@@ -310,7 +308,7 @@ Table 2-4 Configuration parameter information
Results:
-
+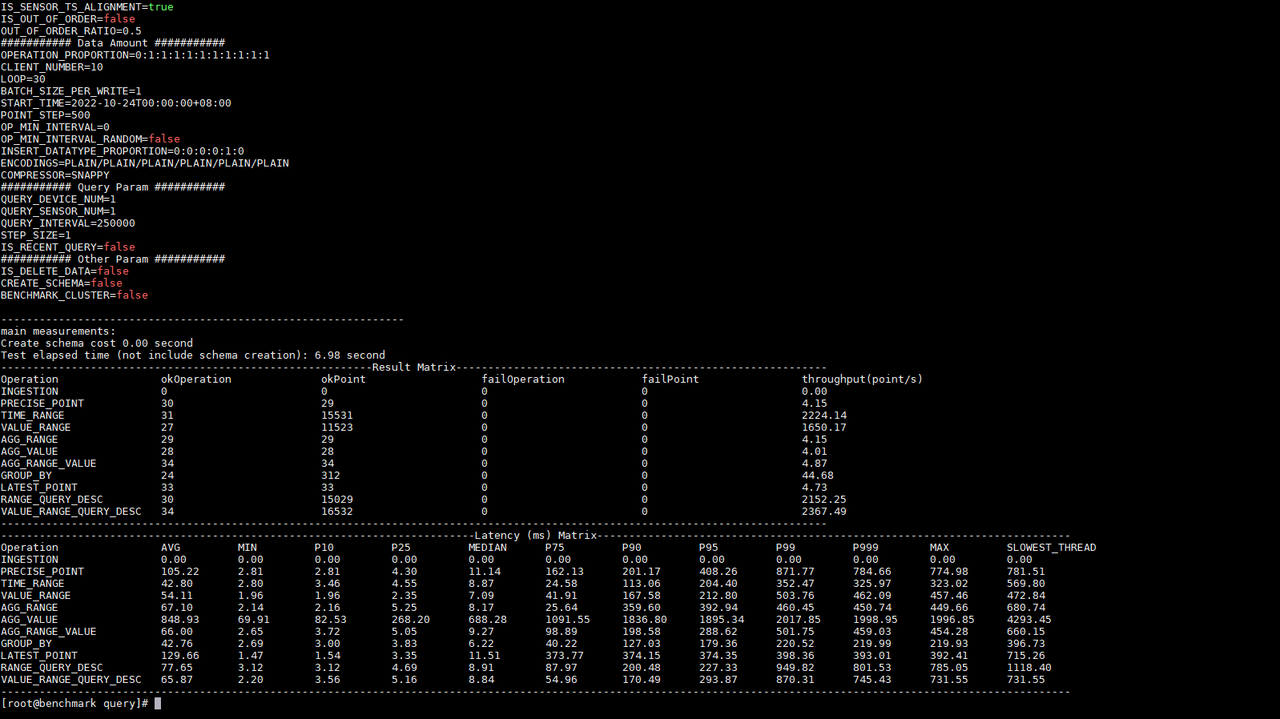
Figure 2-7 Query test results
diff --git a/src/UserGuide/Master/User-Manual/Database-Programming.md
b/src/UserGuide/Master/User-Manual/Database-Programming.md
index 8939c97..f501e29 100644
--- a/src/UserGuide/Master/User-Manual/Database-Programming.md
+++ b/src/UserGuide/Master/User-Manual/Database-Programming.md
@@ -397,7 +397,7 @@ The above SQL statement creates a trigger named triggerTest:
- The trigger is stateless.
- Fires before insertion.
-- Listens on path pattern root.sg.**
+- Listens on path pattern root\.sg.**
- The implemented trigger class is named
`org.apache.iotdb.trigger.ClusterAlertingExample`
- The JAR package URI is http://jar/ClusterAlertingExample.jar
- When creating the trigger instance, two parameters, name and limit, are
passed in.
diff --git a/src/UserGuide/V1.2.x/Tools-System/Benchmark.md
b/src/UserGuide/V1.2.x/Tools-System/Benchmark.md
index 2dd6e3e..a7f75cd 100644
--- a/src/UserGuide/V1.2.x/Tools-System/Benchmark.md
+++ b/src/UserGuide/V1.2.x/Tools-System/Benchmark.md
@@ -25,13 +25,13 @@ IoT-benchmark is a time-series database benchmarking tool
based on Java and big
Figure 1-1 below includes the test benchmark process and other extended
functions. These processes can be unified by IoT-benchmark. IoT Benchmark
supports a variety of workloads, including **pure write, pure query, write
query mixed**, etc., supports **software and hardware system monitoring, test
metric measurement** and other monitoring functions, and also realizes
**initializing the database automatically, test data analysis and system
parameter optimization** functions.
-
+
Figure 1-1
Referring to the YCSB test tool's design idea of separating the three
components of workload generation, performance metric measurement and database
interface, the modular design of IoT-benchmark is shown in Figure 1-2.
Different from the YCSB-based test tool system, IoT-benchmark adds a system
monitoring module to support the persistence of test data and system monitoring
data. In addition, some special load testing functions especially designed for
time series data scenarios have been [...]
-
+
Figure 1-2
@@ -67,22 +67,22 @@ Table 1-1 Comparison of big data test benchmarks
### IoT Benchmark's Test Package Structure
-The directory structure of the test package is shown in Figure 1-3 below. The
test configuration file is conf/config.properties, and the test startup scripts
are benchmark.sh (Linux & MacOS) and benchmark.bat (Windows). The detailed
usage of the files is shown in Table 1-2.
+The directory structure of the test package is shown in Figure 1-3 below. The
test configuration file is conf/config.properties, and the test startup scripts
are benchmark\.sh (Linux & MacOS) and benchmark.bat (Windows). The detailed
usage of the files is shown in Table 1-2.
-
+
Figure 1-3 List of files and folders
| Name | File | Usage |
| ---------------- | ----------------- | -------------------------------- |
| benchmark.bat | - | Startup script on Windows |
-| benchmark.sh | - | Startup script on Linux/Mac |
+| benchmark\.sh | - | Startup script on Linux/Mac |
| conf | config.properties | Test scenario configuration file |
| logback.xml | - | Log output configuration file |
| lib | - | Dependency library |
| LICENSE | - | License file |
-| bin | startup.sh | Init script folder |
-| ser-benchmark.sh | - | Monitor mode startup script |
+| bin | startup\.sh | Init script folder |
+| ser-benchmark\.sh | - | Monitor mode startup script |
Table 1-2 Usage list of files and folders
@@ -115,7 +115,7 @@ This chapter mainly explains the purpose and configuration
method of the main pa
### Working Mode and Operation Proportion
-- The working mode parameter "BENCHMARK_WORK_MODE" can be selected as "default
mode" and "server monitoring"; the "server monitoring" mode can be started
directly by executing the ser-benchmark.sh script, and the script will
automatically modify this parameter. "Default mode" is a commonly used test
mode, combined with the configuration of the OPERATION_PROPORTION parameter to
achieve the definition of test operation proportions of "pure write", "pure
query" and "read-write mix".
+- The working mode parameter "BENCHMARK_WORK_MODE" can be selected as "default
mode" and "server monitoring"; the "server monitoring" mode can be started
directly by executing the ser-benchmark\.sh script, and the script will
automatically modify this parameter. "Default mode" is a commonly used test
mode, combined with the configuration of the OPERATION_PROPORTION parameter to
achieve the definition of test operation proportions of "pure write", "pure
query" and "read-write mix".
- When running ServerMode to monitor the operating environment of the time
series database under test, IoT-benchmark relies on sysstat software related
commands; if MySQL or IoTDB is selected for persistent test process data, this
type of database needs to be installed; the recording mode of ServerMode and
CSV can only be used in the Linux system to record relevant system information
during the test. Therefore, we recommend using MacOs or Linux system. This
article uses Linux (Centos7) [...]
@@ -124,7 +124,7 @@ Table 1-3 Test mode
| Mode Name | BENCHMARK_WORK_MODE | Description
|
| ------------ | ------------------- |
------------------------------------------------------------ |
| default mode | testWithDefaultPath | Supports mixed workloads with multiple
read and write operations |
-| server mode | serverMODE | Server resource usage monitoring mode
(running in this mode is started by the ser-benchmark.sh script, no need to
manually configure this parameter) |
+| server mode | serverMODE | Server resource usage monitoring mode
(running in this mode is started by the ser-benchmark\.sh script, no need to
manually configure this parameter) |
### Server Connection Information
@@ -207,7 +207,7 @@ Table 2-1 Virtual machine configuration information
| number of CPU cores | 16 |
| memory | 32G |
| hard disk | 200G |
-| network | 千兆 |
+| network | Gigabit |
Table 2-2 Virtual machine usage
@@ -249,26 +249,26 @@ Table 2-3 Configuration parameter information
| TEST_DATA_STORE_PW | admin | |
| REMARK | demo | |
-First, start the tested time series databases Apache-IoTDB and KairosDB on
172.21.4.3 and 172.21.4.4 respectively, and then start server resource
monitoring through the ser-benchamrk.sh script on 172.21.4.2, 172.21.4.3 and
172.21.4.4 (Figure 2-1). Then modify the conf/config.properties files in the
iotdb-0.13-0.0.1 and kairosdb-0.0.1 folders in 172.21.4.2 according to Table
2-3 to meet the test requirements. Use benchmark.sh to start the writing test
of Apache-IoTDB and KairosDB successively.
+First, start the tested time series databases Apache-IoTDB and KairosDB on
172.21.4.3 and 172.21.4.4 respectively, and then start server resource
monitoring through the ser-benchamrk\.sh script on 172.21.4.2, 172.21.4.3 and
172.21.4.4 (Figure 2-1). Then modify the conf/config.properties files in the
iotdb-0.13-0.0.1 and kairosdb-0.0.1 folders in 172.21.4.2 according to Table
2-3 to meet the test requirements. Use benchmark\.sh to start the writing test
of Apache-IoTDB and KairosDB successively.
-
+
Figure 2-1 Server monitoring tasks
For example, if we first start the test on KairosDB, IoT-benchmark will create
a CONFIG data table in the MySQL database to store the configuration
information of this test (Figure 2-2), and there will be a log output of the
current test progress during the test execution (Figure 2-3) . When the test is
completed, the test result will be output (Figure 2-3), and the result will be
written into the FINAL_RESULT data table (Figure 2-4).
-
+
Figure 2-2 Test configuration information table
-
-
-
-
+
+
+
+
Figure 2-3 Test progress and results
-
+
Figure 2-4 Test result table
@@ -276,14 +276,14 @@ Afterwards, we will start the test on Apache-IoTDB. The
same IoT-benchmark will
According to the test result information, we know that under the same
configuration the write delay times of Apache-IoTDB and KairosDB are 55.98ms
and 1324.45ms respectively; the write throughputs are 5,125,600.86
points/second and 224,819.01 points/second respectively; the tests were
executed respectively 585.30 seconds and 11777.99 seconds. And KairosDB has a
write failure. After investigation, it is found that the data disk usage has
reached 100%, and there is no disk space to continu [...]
-
+
Figure 2-5 Disk usage
So what is the resource usage of each server during the test? What is the
specific performance of each write operation? At this time, we can visualize
the data in the server monitoring table and test process recording table by
installing and using Tableau. The use of Tableau will not be introduced in this
article. After connecting to the data table for test data persistence, the
specific results are as follows (taking Apache-IoTDB as an example):
-
-
+
+
Figure 2-6 Visualization of testing process in Tableau
diff --git a/src/UserGuide/V1.2.x/User-Manual/Database-Programming.md
b/src/UserGuide/V1.2.x/User-Manual/Database-Programming.md
index f83a361..d625e42 100644
--- a/src/UserGuide/V1.2.x/User-Manual/Database-Programming.md
+++ b/src/UserGuide/V1.2.x/User-Manual/Database-Programming.md
@@ -397,7 +397,7 @@ The above SQL statement creates a trigger named triggerTest:
- The trigger is stateless.
- Fires before insertion.
-- Listens on path pattern root.sg.**
+- Listens on path pattern root\.sg.**
- The implemented trigger class is named
`org.apache.iotdb.trigger.ClusterAlertingExample`
- The JAR package URI is http://jar/ClusterAlertingExample.jar
- When creating the trigger instance, two parameters, name and limit, are
passed in.
diff --git a/src/UserGuide/latest/Tools-System/Benchmark.md
b/src/UserGuide/latest/Tools-System/Benchmark.md
index e067702..8f88659 100644
--- a/src/UserGuide/latest/Tools-System/Benchmark.md
+++ b/src/UserGuide/latest/Tools-System/Benchmark.md
@@ -25,13 +25,13 @@ IoT-benchmark is a time-series database benchmarking tool
based on Java and big
Figure 1-1 below includes the test benchmark process and other extended
functions. These processes can be unified by IoT-benchmark. IoT Benchmark
supports a variety of workloads, including **pure write, pure query, write
query mixed**, etc., supports **software and hardware system monitoring, test
metric measurement** and other monitoring functions, and also realizes
**initializing the database automatically, test data analysis and system
parameter optimization** functions.
-
+
Figure 1-1
Referring to the YCSB test tool's design idea of separating the three
components of workload generation, performance metric measurement and database
interface, the modular design of IoT-benchmark is shown in Figure 1-2.
Different from the YCSB-based test tool system, IoT-benchmark adds a system
monitoring module to support the persistence of test data and system monitoring
data. In addition, some special load testing functions especially designed for
time series data scenarios have been [...]
-
+
Figure 1-2
@@ -67,22 +67,22 @@ Table 1-1 Comparison of big data test benchmarks
### IoT Benchmark's Test Package Structure
-The directory structure of the test package is shown in Figure 1-3 below. The
test configuration file is conf/config.properties, and the test startup scripts
are benchmark.sh (Linux & MacOS) and benchmark.bat (Windows). The detailed
usage of the files is shown in Table 1-2.
+The directory structure of the test package is shown in Figure 1-3 below. The
test configuration file is conf/config.properties, and the test startup scripts
are benchmark\.sh (Linux & MacOS) and benchmark.bat (Windows). The detailed
usage of the files is shown in Table 1-2.
-
+
Figure 1-3 List of files and folders
| Name | File | Usage |
| ---------------- | ----------------- | -------------------------------- |
| benchmark.bat | - | Startup script on Windows |
-| benchmark.sh | - | Startup script on Linux/Mac |
+| benchmark\.sh | - | Startup script on Linux/Mac |
| conf | config.properties | Test scenario configuration file |
| logback.xml | - | Log output configuration file |
| lib | - | Dependency library |
| LICENSE | - | License file |
-| bin | startup.sh | Init script folder |
-| ser-benchmark.sh | - | Monitor mode startup script |
+| bin | startup\.sh | Init script folder |
+| ser-benchmark\.sh | - | Monitor mode startup script |
Table 1-2 Usage list of files and folders
@@ -97,7 +97,7 @@ Table 1-2 Usage list of files and folders
All the log files of the test are stored in the logs folder, and the test
results are stored in the data/csvOutput folder after the test is completed.
For example, after the test, we get the following result matrix:
-
+
- Result Matrix
- OkOperation: successful operations
@@ -115,7 +115,7 @@ This chapter mainly explains the purpose and configuration
method of the main pa
### Working Mode and Operation Proportion
-- The working mode parameter "BENCHMARK_WORK_MODE" can be selected as "default
mode" and "server monitoring"; the "server monitoring" mode can be started
directly by executing the ser-benchmark.sh script, and the script will
automatically modify this parameter. "Default mode" is a commonly used test
mode, combined with the configuration of the OPERATION_PROPORTION parameter to
achieve the definition of test operation proportions of "pure write", "pure
query" and "read-write mix".
+- The working mode parameter "BENCHMARK_WORK_MODE" can be selected as "default
mode" and "server monitoring"; the "server monitoring" mode can be started
directly by executing the ser-benchmark\.sh script, and the script will
automatically modify this parameter. "Default mode" is a commonly used test
mode, combined with the configuration of the OPERATION_PROPORTION parameter to
achieve the definition of test operation proportions of "pure write", "pure
query" and "read-write mix".
- When running ServerMode to monitor the operating environment of the time
series database under test, IoT-benchmark relies on sysstat software related
commands; if MySQL or IoTDB is selected for persistent test process data, this
type of database needs to be installed; the recording mode of ServerMode and
CSV can only be used in the Linux system to record relevant system information
during the test. Therefore, we recommend using MacOs or Linux system. This
article uses Linux (Centos7) [...]
@@ -124,7 +124,7 @@ Table 1-3 Test mode
| Mode Name | BENCHMARK_WORK_MODE | Description
|
| ------------ | ------------------- |
------------------------------------------------------------ |
| default mode | testWithDefaultPath | Supports mixed workloads with multiple
read and write operations |
-| server mode | serverMODE | Server resource usage monitoring mode
(running in this mode is started by the ser-benchmark.sh script, no need to
manually configure this parameter) |
+| server mode | serverMODE | Server resource usage monitoring mode
(running in this mode is started by the ser-benchmark\.sh script, no need to
manually configure this parameter) |
### Server Connection Information
@@ -207,7 +207,7 @@ Table 2-1 Virtual machine configuration information
| number of CPU cores | 16 |
| memory | 32G |
| hard disk | 200G |
-| network | 千兆 |
+| network | Gigabit |
Table 2-2 Virtual machine usage
@@ -249,26 +249,26 @@ Table 2-3 Configuration parameter information
| TEST_DATA_STORE_PW | admin | |
| REMARK | demo | |
-First, start the tested time series databases Apache-IoTDB and KairosDB on
172.21.4.3 and 172.21.4.4 respectively, and then start server resource
monitoring through the ser-benchamrk.sh script on 172.21.4.2, 172.21.4.3 and
172.21.4.4 (Figure 2-1). Then modify the conf/config.properties files in the
iotdb-0.13-0.0.1 and kairosdb-0.0.1 folders in 172.21.4.2 according to Table
2-3 to meet the test requirements. Use benchmark.sh to start the writing test
of Apache-IoTDB and KairosDB successively.
+First, start the tested time series databases Apache-IoTDB and KairosDB on
172.21.4.3 and 172.21.4.4 respectively, and then start server resource
monitoring through the ser-benchamrk\.sh script on 172.21.4.2, 172.21.4.3 and
172.21.4.4 (Figure 2-1). Then modify the conf/config.properties files in the
iotdb-0.13-0.0.1 and kairosdb-0.0.1 folders in 172.21.4.2 according to Table
2-3 to meet the test requirements. Use benchmark\.sh to start the writing test
of Apache-IoTDB and KairosDB successively.
-
+
Figure 2-1 Server monitoring tasks
For example, if we first start the test on KairosDB, IoT-benchmark will create
a CONFIG data table in the MySQL database to store the configuration
information of this test (Figure 2-2), and there will be a log output of the
current test progress during the test execution (Figure 2-3) . When the test is
completed, the test result will be output (Figure 2-3), and the result will be
written into the FINAL_RESULT data table (Figure 2-4).
-
+
Figure 2-2 Test configuration information table
-
-
-
-
+
+
+
+
Figure 2-3 Test progress and results
-
+
Figure 2-4 Test result table
@@ -276,14 +276,14 @@ Afterwards, we will start the test on Apache-IoTDB. The
same IoT-benchmark will
According to the test result information, we know that under the same
configuration the write delay times of Apache-IoTDB and KairosDB are 55.98ms
and 1324.45ms respectively; the write throughputs are 5,125,600.86
points/second and 224,819.01 points/second respectively; the tests were
executed respectively 585.30 seconds and 11777.99 seconds. And KairosDB has a
write failure. After investigation, it is found that the data disk usage has
reached 100%, and there is no disk space to continu [...]
-
+
Figure 2-5 Disk usage
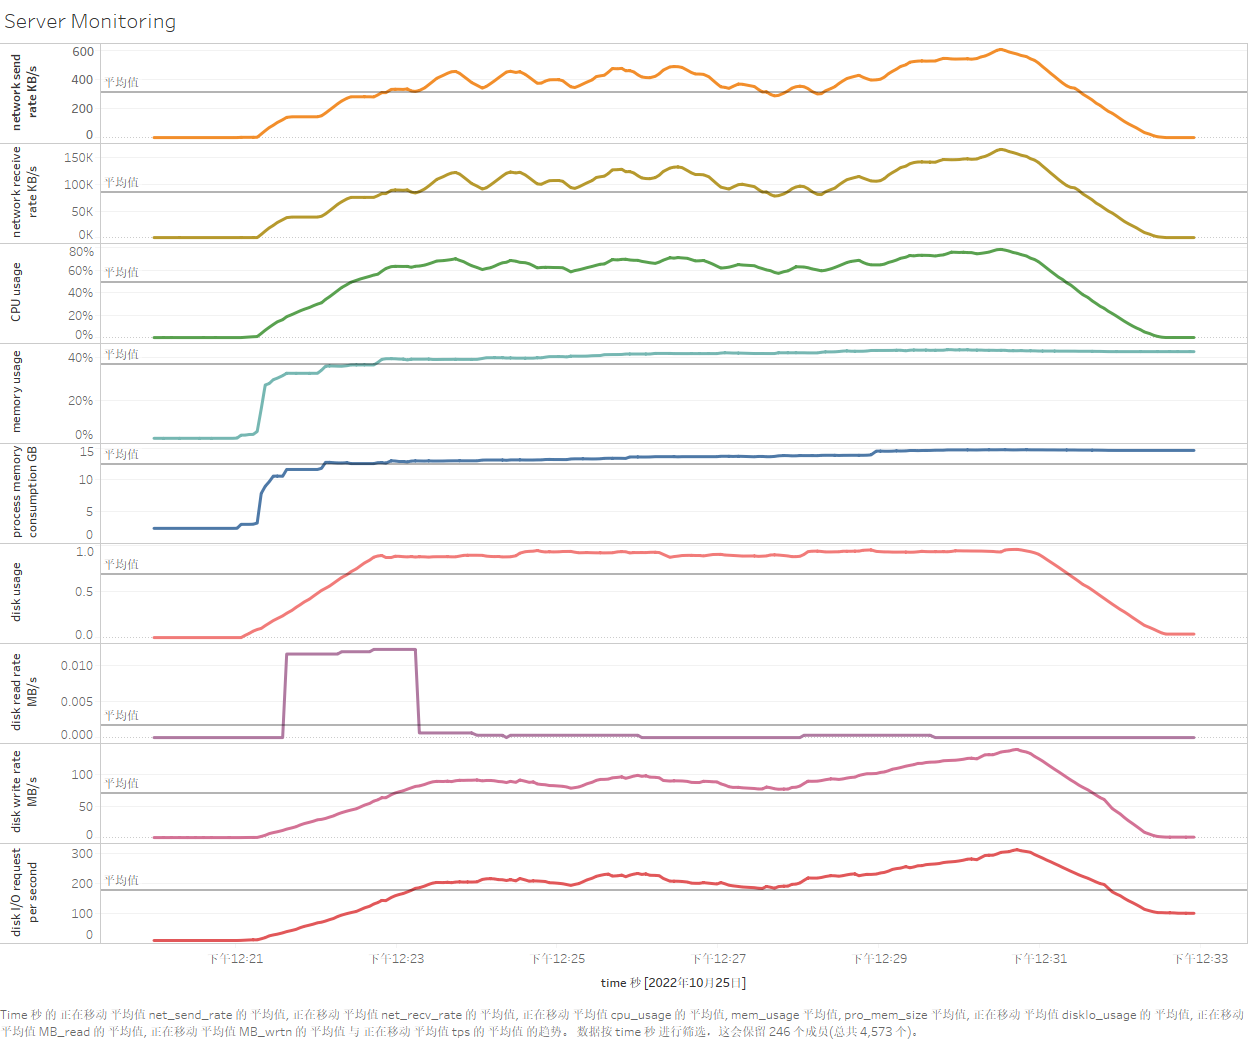
So what is the resource usage of each server during the test? What is the
specific performance of each write operation? At this time, we can visualize
the data in the server monitoring table and test process recording table by
installing and using Tableau. The use of Tableau will not be introduced in this
article. After connecting to the data table for test data persistence, the
specific results are as follows (taking Apache-IoTDB as an example):
-
-
+
+
Figure 2-6 Visualization of testing process in Tableau
diff --git a/src/UserGuide/latest/User-Manual/Database-Programming.md
b/src/UserGuide/latest/User-Manual/Database-Programming.md
index 1114e6c..c2f6407 100644
--- a/src/UserGuide/latest/User-Manual/Database-Programming.md
+++ b/src/UserGuide/latest/User-Manual/Database-Programming.md
@@ -397,7 +397,7 @@ The above SQL statement creates a trigger named triggerTest:
- The trigger is stateless.
- Fires before insertion.
-- Listens on path pattern root.sg.**
+- Listens on path pattern root\.sg.**
- The implemented trigger class is named
`org.apache.iotdb.trigger.ClusterAlertingExample`
- The JAR package URI is http://jar/ClusterAlertingExample.jar
- When creating the trigger instance, two parameters, name and limit, are
passed in.
diff --git a/src/zh/UserGuide/Master/API/Programming-CSharp-Native-API.md
b/src/zh/UserGuide/Master/API/Programming-CSharp-Native-API.md
index b72300f..2a4a4dd 100644
--- a/src/zh/UserGuide/Master/API/Programming-CSharp-Native-API.md
+++ b/src/zh/UserGuide/Master/API/Programming-CSharp-Native-API.md
@@ -31,13 +31,13 @@
您可以使用 NuGet Package Manager, .NET CLI等工具来安装,以 .NET CLI为例
-如果您使用的是.NET 5.0 或者更高版本的SDK,输入如下命令即可安装最新的NuGet包
+如果您使用的是\.NET 5.0 或者更高版本的SDK,输入如下命令即可安装最新的NuGet包
```
dotnet add package Apache.IoTDB
```
-为了适配 .NET Framework 4.x,我们单独构建了一个NuGet包,如果您使用的是.NET Framework
4.x,输入如下命令即可安装最新的包
+为了适配 .NET Framework 4.x,我们单独构建了一个NuGet包,如果您使用的是\.NET Framework
4.x,输入如下命令即可安装最新的包
```bash
dotnet add package Apache.IoTDB.framework
diff --git a/src/zh/UserGuide/Master/Tools-System/Benchmark.md
b/src/zh/UserGuide/Master/Tools-System/Benchmark.md
index 080148b..efbd369 100644
--- a/src/zh/UserGuide/Master/Tools-System/Benchmark.md
+++ b/src/zh/UserGuide/Master/Tools-System/Benchmark.md
@@ -27,13 +27,13 @@ IoT-benchmark 是基于 Java 和大数据环境开发的时序数据库基准测
下图1-1囊括了测试基准流程及其他扩展功能。这些流程可以由IoT-benchmark 统一来完成。IoT Benchmark
支持多种工作负载,包括**纯写入、纯查询、写入查询混合**等,支持**软硬件系统监控、测试指标度量**等监控功能,还实现了**初始化数据库自动化、测试数据分析及系统参数优化**等功能。
-
+
图1-1
借鉴 YCSB 测试工具将工作负载生成、性能指标测量和数据库接口三个组件分离的设计思想,IoT-benchmark 的模块化设计如图1-2所示。与基于
YCSB 的测试工具系统不同的是,IoT-benchmark
增加了系统监控模块,支持测试数据和系统指标监控数据的持久化。此外也增加了一些特别针对时序数据场景的特殊负载测试功能,如支持物联网场景的批量写入和多种乱序数据写入模式。
-
+
图1-2
@@ -75,28 +75,28 @@ IoT-benchmark 是基于 Java 和大数据环境开发的时序数据库基准测
#### IoT Benchmark 的测试包结构
-测试包的目录结构如下图1-3所示。其中测试配置文件为conf/config.properties,测试启动脚本为benchmark.sh (Linux &
MacOS) 和 benchmark.bat (Windows),详细文件用途见表1-2所示。
+测试包的目录结构如下图1-3所示。其中测试配置文件为conf/config.properties,测试启动脚本为benchmark\.sh (Linux &
MacOS) 和 benchmark.bat (Windows),详细文件用途见表1-2所示。
-
+
图1-3文件和文件夹列表
| 名称 | 子文件 | 用途 |
| ---------------- | ----------------- | ------------------------- |
| benchmark.bat | - | Windows环境运行启动脚本 |
-| benchmark.sh | - | Linux/Mac环境运行启动脚本 |
+| benchmark\.sh | - | Linux/Mac环境运行启动脚本 |
| conf | config.properties | 测试场景配置文件 |
| logback.xml | 日志输出配置文件 | |
| lib | - | 依赖库文件 |
| LICENSE | - | 许可文件 |
-| bin | startup.sh | 初始化脚本文件夹 |
-| ser-benchmark.sh | - | 监控模式启动脚本 |
+| bin | startup\.sh | 初始化脚本文件夹 |
+| ser-benchmark\.sh | - | 监控模式启动脚本 |
表1-2文件和文件夹列表用途
#### IoT Benchmark 执行测试
-1. 按照测试需求修改配置文件,主要参数介绍见 1.2 节,对应配置文件为conf/config.properties,**比如测试****Apache**
**IoTDB 1.0,则需要修改 DB_SWITCH=IoTDB-100-SESSION_BY_TABLET**
+1. 按照测试需求修改配置文件,主要参数介绍见 1.2 节,对应配置文件为conf/config.properties,**比如测试Apache**
**IoTDB 1.0,则需要修改 DB_SWITCH=IoTDB-100-SESSION_BY_TABLET**
2. 启动被测时间序列数据库
3. 通过运行
4. 启动IoT-benchmark执行测试。执行中观测被测时间序列数据库和IoT-benchmark状态,执行完毕后查看结果和分析测试过程。
@@ -105,7 +105,7 @@ IoT-benchmark 是基于 Java 和大数据环境开发的时序数据库基准测
测试的所有日志文件被存放于 logs 文件夹下,测试的结果在测试完成后被存放到 data/csvOutput 文件夹下,例如测试后我们得到了如下的结果矩阵:
-
+
- Result Matrix
- OkOperation:成功的对应操作次数
@@ -273,18 +273,18 @@ IoT-benchmark目前支持通过配置参数“TEST_DATA_PERSISTENCE”将测试
例如我们首先启动对KairosDB的测试,IoT-benchmark会在MySQL数据库中创建CONFIG数据表存放本次测试配置信息(图2-2),测试执行中会有日志输出当前测试进度(图2-3)。测试完成时会输出本次测试结果(图2-3),同时将结果写入FINAL_RESULT数据表中(图2-4)。
-
+
图2-2测试配置信息表
-
-
-
-
+
+
+
+
图2-3测试进度和结果
-
+
图2-4测试结果表
@@ -292,14 +292,14 @@ IoT-benchmark目前支持通过配置参数“TEST_DATA_PERSISTENCE”将测试
依照测试结果信息我们知道同样的配置写入Apache-IoTDB和KairosDB写入延时时间分别为:55.98ms和1324.45ms;写入吞吐分别为:5,125,600.86点/秒和224,819.01点/秒;测试分别执行了585.30秒和11777.99秒。并且KairosDB有写入失败出现,排查后发现是数据磁盘使用率已达到100%,无磁盘空间继续接收数据。而Apache-IoTDB无写入失败现象,全部数据写入完毕后占用磁盘空间仅为4.7G(如图2-5所示);从写入吞吐和磁盘占用情况上看Apache-IoTDB均优于KairosDB。当然后续还有其他测试来从多方面观察和对比,比如查询性能、文件压缩比、数据安全性等。
-
+
图2-5磁盘使用情况
那么测试过程中各个服务器资源使用情况如何呢?每个写操作具体的表现如何呢?这个时候我们就可以通过安装和使用Tableau来可视化服务器监控表和测试过程记录表内的数据了。Tableau的使用本文不展开介绍,通过它连接测试数据持久化的数据表后具体结果下如图(以Apache-IoTDB为例):
-
-
+
+
图2-6Tableau可视化测试过程
@@ -326,7 +326,7 @@ IoT-benchmark目前支持通过配置参数“TEST_DATA_PERSISTENCE”将测试
执行结果:
-
+
图2-7查询测试结果
diff --git a/src/zh/UserGuide/Master/User-Manual/Database-Programming.md
b/src/zh/UserGuide/Master/User-Manual/Database-Programming.md
index 506299a..c930653 100644
--- a/src/zh/UserGuide/Master/User-Manual/Database-Programming.md
+++ b/src/zh/UserGuide/Master/User-Manual/Database-Programming.md
@@ -170,7 +170,7 @@ Map<PartialPath, List<Trigger>> pathToTriggerListMap =>
Map<Trigger, Tablet>
假设有三个触发器,触发器的触发时机均为 BEFORE INSERT
-- 触发器 Trigger1 侦听路径模式:root.sg.*
+- 触发器 Trigger1 侦听路径模式:root\.sg.*
- 触发器 Trigger2 侦听路径模式:root.sg.a
- 触发器 Trigger3 侦听路径模式:root.sg.b
@@ -396,7 +396,7 @@ WITH (
- 该触发器是无状态的(STATELESS)
- 在写入前触发(BEFORE INSERT)
-- 该触发器侦听路径模式为 root.sg.**
+- 该触发器侦听路径模式为 root\.sg.**
- 所编写的触发器类名为 org.apache.iotdb.trigger.ClusterAlertingExample
- JAR 包的 URI 为 http://jar/ClusterAlertingExample.jar
- 创建该触发器实例时会传入 name 和 limit 两个参数。
diff --git a/src/zh/UserGuide/V1.2.x/API/Programming-CSharp-Native-API.md
b/src/zh/UserGuide/V1.2.x/API/Programming-CSharp-Native-API.md
index b72300f..2a4a4dd 100644
--- a/src/zh/UserGuide/V1.2.x/API/Programming-CSharp-Native-API.md
+++ b/src/zh/UserGuide/V1.2.x/API/Programming-CSharp-Native-API.md
@@ -31,13 +31,13 @@
您可以使用 NuGet Package Manager, .NET CLI等工具来安装,以 .NET CLI为例
-如果您使用的是.NET 5.0 或者更高版本的SDK,输入如下命令即可安装最新的NuGet包
+如果您使用的是\.NET 5.0 或者更高版本的SDK,输入如下命令即可安装最新的NuGet包
```
dotnet add package Apache.IoTDB
```
-为了适配 .NET Framework 4.x,我们单独构建了一个NuGet包,如果您使用的是.NET Framework
4.x,输入如下命令即可安装最新的包
+为了适配 .NET Framework 4.x,我们单独构建了一个NuGet包,如果您使用的是\.NET Framework
4.x,输入如下命令即可安装最新的包
```bash
dotnet add package Apache.IoTDB.framework
diff --git a/src/zh/UserGuide/V1.2.x/Tools-System/Benchmark.md
b/src/zh/UserGuide/V1.2.x/Tools-System/Benchmark.md
index 52d094c..3e19f21 100644
--- a/src/zh/UserGuide/V1.2.x/Tools-System/Benchmark.md
+++ b/src/zh/UserGuide/V1.2.x/Tools-System/Benchmark.md
@@ -33,7 +33,7 @@ IoT-benchmark 是基于 Java 和大数据环境开发的时序数据库基准测
借鉴 YCSB 测试工具将工作负载生成、性能指标测量和数据库接口三个组件分离的设计思想,IoT-benchmark 的模块化设计如图1-2所示。与基于
YCSB 的测试工具系统不同的是,IoT-benchmark
增加了系统监控模块,支持测试数据和系统指标监控数据的持久化。此外也增加了一些特别针对时序数据场景的特殊负载测试功能,如支持物联网场景的批量写入和多种乱序数据写入模式。
-
+
图1-2
@@ -75,28 +75,28 @@ IoT-benchmark 是基于 Java 和大数据环境开发的时序数据库基准测
#### IoT Benchmark 的测试包结构
-测试包的目录结构如下图1-3所示。其中测试配置文件为conf/config.properties,测试启动脚本为benchmark.sh (Linux &
MacOS) 和 benchmark.bat (Windows),详细文件用途见表1-2所示。
+测试包的目录结构如下图1-3所示。其中测试配置文件为conf/config.properties,测试启动脚本为benchmark\.sh (Linux &
MacOS) 和 benchmark.bat (Windows),详细文件用途见表1-2所示。
-
+
图1-3文件和文件夹列表
| 名称 | 子文件 | 用途 |
| ---------------- | ----------------- | ------------------------- |
| benchmark.bat | - | Windows环境运行启动脚本 |
-| benchmark.sh | - | Linux/Mac环境运行启动脚本 |
+| benchmark\.sh | - | Linux/Mac环境运行启动脚本 |
| conf | config.properties | 测试场景配置文件 |
| logback.xml | 日志输出配置文件 | |
| lib | - | 依赖库文件 |
| LICENSE | - | 许可文件 |
-| bin | startup.sh | 初始化脚本文件夹 |
-| ser-benchmark.sh | - | 监控模式启动脚本 |
+| bin | startup\.sh | 初始化脚本文件夹 |
+| ser-benchmark\.sh | - | 监控模式启动脚本 |
表1-2文件和文件夹列表用途
#### IoT Benchmark 执行测试
-1. 按照测试需求修改配置文件,主要参数介绍见 1.2 节,对应配置文件为conf/config.properties,**比如测试****Apache**
**IoTDB 1.0,则需要修改 DB_SWITCH=IoTDB-100-SESSION_BY_TABLET**
+1. 按照测试需求修改配置文件,主要参数介绍见 1.2 节,对应配置文件为conf/config.properties,**比如测试Apache**
**IoTDB 1.0,则需要修改 DB_SWITCH=IoTDB-100-SESSION_BY_TABLET**
2. 启动被测时间序列数据库
3. 通过运行
4. 启动IoT-benchmark执行测试。执行中观测被测时间序列数据库和IoT-benchmark状态,执行完毕后查看结果和分析测试过程。
@@ -105,7 +105,7 @@ IoT-benchmark 是基于 Java 和大数据环境开发的时序数据库基准测
测试的所有日志文件被存放于 logs 文件夹下,测试的结果在测试完成后被存放到 data/csvOutput 文件夹下,例如测试后我们得到了如下的结果矩阵:
-
+
- Result Matrix
- OkOperation:成功的对应操作次数
@@ -267,24 +267,24 @@ IoT-benchmark目前支持通过配置参数“TEST_DATA_PERSISTENCE”将测试
首先在172.21.4.3和172.21.4.4上分别启动被测时间序列数据库Apache-IoTDB和KairosDB,之后在172.21.4.2、172.21.4.3和172.21.4.4上通过ser-benchamrk.sh脚本启动服务器资源监控(图2-1)。然后按照表2-3在172.21.4.2分别修改iotdb-0.13-0.0.1和kairosdb-0.0.1文件夹内的conf/config.properties文件满足测试需求。先后使用benchmark.sh启动对Apache-IoTDB和KairosDB的写入测试。
-
+
图2-1服务器监控任务
例如我们首先启动对KairosDB的测试,IoT-benchmark会在MySQL数据库中创建CONFIG数据表存放本次测试配置信息(图2-2),测试执行中会有日志输出当前测试进度(图2-3)。测试完成时会输出本次测试结果(图2-3),同时将结果写入FINAL_RESULT数据表中(图2-4)。
-
+
图2-2测试配置信息表
-
-
-
-
+
+
+
+
图2-3测试进度和结果
-
+
图2-4测试结果表
diff --git a/src/zh/UserGuide/latest/API/Programming-CSharp-Native-API.md
b/src/zh/UserGuide/latest/API/Programming-CSharp-Native-API.md
index b72300f..2a4a4dd 100644
--- a/src/zh/UserGuide/latest/API/Programming-CSharp-Native-API.md
+++ b/src/zh/UserGuide/latest/API/Programming-CSharp-Native-API.md
@@ -31,13 +31,13 @@
您可以使用 NuGet Package Manager, .NET CLI等工具来安装,以 .NET CLI为例
-如果您使用的是.NET 5.0 或者更高版本的SDK,输入如下命令即可安装最新的NuGet包
+如果您使用的是\.NET 5.0 或者更高版本的SDK,输入如下命令即可安装最新的NuGet包
```
dotnet add package Apache.IoTDB
```
-为了适配 .NET Framework 4.x,我们单独构建了一个NuGet包,如果您使用的是.NET Framework
4.x,输入如下命令即可安装最新的包
+为了适配 .NET Framework 4.x,我们单独构建了一个NuGet包,如果您使用的是\.NET Framework
4.x,输入如下命令即可安装最新的包
```bash
dotnet add package Apache.IoTDB.framework
diff --git a/src/zh/UserGuide/latest/Tools-System/Benchmark.md
b/src/zh/UserGuide/latest/Tools-System/Benchmark.md
index 080148b..3a6d572 100644
--- a/src/zh/UserGuide/latest/Tools-System/Benchmark.md
+++ b/src/zh/UserGuide/latest/Tools-System/Benchmark.md
@@ -27,13 +27,13 @@ IoT-benchmark 是基于 Java 和大数据环境开发的时序数据库基准测
下图1-1囊括了测试基准流程及其他扩展功能。这些流程可以由IoT-benchmark 统一来完成。IoT Benchmark
支持多种工作负载,包括**纯写入、纯查询、写入查询混合**等,支持**软硬件系统监控、测试指标度量**等监控功能,还实现了**初始化数据库自动化、测试数据分析及系统参数优化**等功能。
-
+
图1-1
借鉴 YCSB 测试工具将工作负载生成、性能指标测量和数据库接口三个组件分离的设计思想,IoT-benchmark 的模块化设计如图1-2所示。与基于
YCSB 的测试工具系统不同的是,IoT-benchmark
增加了系统监控模块,支持测试数据和系统指标监控数据的持久化。此外也增加了一些特别针对时序数据场景的特殊负载测试功能,如支持物联网场景的批量写入和多种乱序数据写入模式。
-
+
图1-2
@@ -75,28 +75,28 @@ IoT-benchmark 是基于 Java 和大数据环境开发的时序数据库基准测
#### IoT Benchmark 的测试包结构
-测试包的目录结构如下图1-3所示。其中测试配置文件为conf/config.properties,测试启动脚本为benchmark.sh (Linux &
MacOS) 和 benchmark.bat (Windows),详细文件用途见表1-2所示。
+测试包的目录结构如下图1-3所示。其中测试配置文件为conf/config.properties,测试启动脚本为benchmark\.sh (Linux &
MacOS) 和 benchmark.bat (Windows),详细文件用途见表1-2所示。
-
+
图1-3文件和文件夹列表
| 名称 | 子文件 | 用途 |
| ---------------- | ----------------- | ------------------------- |
| benchmark.bat | - | Windows环境运行启动脚本 |
-| benchmark.sh | - | Linux/Mac环境运行启动脚本 |
+| benchmark\.sh | - | Linux/Mac环境运行启动脚本 |
| conf | config.properties | 测试场景配置文件 |
| logback.xml | 日志输出配置文件 | |
| lib | - | 依赖库文件 |
| LICENSE | - | 许可文件 |
-| bin | startup.sh | 初始化脚本文件夹 |
-| ser-benchmark.sh | - | 监控模式启动脚本 |
+| bin | startup\.sh | 初始化脚本文件夹 |
+| ser-benchmark\.sh | - | 监控模式启动脚本 |
表1-2文件和文件夹列表用途
#### IoT Benchmark 执行测试
-1. 按照测试需求修改配置文件,主要参数介绍见 1.2 节,对应配置文件为conf/config.properties,**比如测试****Apache**
**IoTDB 1.0,则需要修改 DB_SWITCH=IoTDB-100-SESSION_BY_TABLET**
+1. 按照测试需求修改配置文件,主要参数介绍见 1.2 节,对应配置文件为conf/config.properties,**比如测试Apache**
**IoTDB 1.0,则需要修改 DB_SWITCH=IoTDB-100-SESSION_BY_TABLET**
2. 启动被测时间序列数据库
3. 通过运行
4. 启动IoT-benchmark执行测试。执行中观测被测时间序列数据库和IoT-benchmark状态,执行完毕后查看结果和分析测试过程。
@@ -105,7 +105,7 @@ IoT-benchmark 是基于 Java 和大数据环境开发的时序数据库基准测
测试的所有日志文件被存放于 logs 文件夹下,测试的结果在测试完成后被存放到 data/csvOutput 文件夹下,例如测试后我们得到了如下的结果矩阵:
-
+
- Result Matrix
- OkOperation:成功的对应操作次数
@@ -267,24 +267,24 @@ IoT-benchmark目前支持通过配置参数“TEST_DATA_PERSISTENCE”将测试
首先在172.21.4.3和172.21.4.4上分别启动被测时间序列数据库Apache-IoTDB和KairosDB,之后在172.21.4.2、172.21.4.3和172.21.4.4上通过ser-benchamrk.sh脚本启动服务器资源监控(图2-1)。然后按照表2-3在172.21.4.2分别修改iotdb-0.13-0.0.1和kairosdb-0.0.1文件夹内的conf/config.properties文件满足测试需求。先后使用benchmark.sh启动对Apache-IoTDB和KairosDB的写入测试。
-
+
图2-1服务器监控任务
例如我们首先启动对KairosDB的测试,IoT-benchmark会在MySQL数据库中创建CONFIG数据表存放本次测试配置信息(图2-2),测试执行中会有日志输出当前测试进度(图2-3)。测试完成时会输出本次测试结果(图2-3),同时将结果写入FINAL_RESULT数据表中(图2-4)。
-
+
图2-2测试配置信息表
-
-
-
-
+
+
+
+
图2-3测试进度和结果
-
+
图2-4测试结果表
@@ -292,14 +292,14 @@ IoT-benchmark目前支持通过配置参数“TEST_DATA_PERSISTENCE”将测试
依照测试结果信息我们知道同样的配置写入Apache-IoTDB和KairosDB写入延时时间分别为:55.98ms和1324.45ms;写入吞吐分别为:5,125,600.86点/秒和224,819.01点/秒;测试分别执行了585.30秒和11777.99秒。并且KairosDB有写入失败出现,排查后发现是数据磁盘使用率已达到100%,无磁盘空间继续接收数据。而Apache-IoTDB无写入失败现象,全部数据写入完毕后占用磁盘空间仅为4.7G(如图2-5所示);从写入吞吐和磁盘占用情况上看Apache-IoTDB均优于KairosDB。当然后续还有其他测试来从多方面观察和对比,比如查询性能、文件压缩比、数据安全性等。
-
+
图2-5磁盘使用情况
那么测试过程中各个服务器资源使用情况如何呢?每个写操作具体的表现如何呢?这个时候我们就可以通过安装和使用Tableau来可视化服务器监控表和测试过程记录表内的数据了。Tableau的使用本文不展开介绍,通过它连接测试数据持久化的数据表后具体结果下如图(以Apache-IoTDB为例):
-
-
+
+
图2-6Tableau可视化测试过程
@@ -326,7 +326,7 @@ IoT-benchmark目前支持通过配置参数“TEST_DATA_PERSISTENCE”将测试
执行结果:
-
+
图2-7查询测试结果
diff --git a/src/zh/UserGuide/latest/User-Manual/Database-Programming.md
b/src/zh/UserGuide/latest/User-Manual/Database-Programming.md
index 1c91cf1..509680f 100644
--- a/src/zh/UserGuide/latest/User-Manual/Database-Programming.md
+++ b/src/zh/UserGuide/latest/User-Manual/Database-Programming.md
@@ -170,7 +170,7 @@ Map<PartialPath, List<Trigger>> pathToTriggerListMap =>
Map<Trigger, Tablet>
假设有三个触发器,触发器的触发时机均为 BEFORE INSERT
-- 触发器 Trigger1 侦听路径模式:root.sg.*
+- 触发器 Trigger1 侦听路径模式:root\.sg.*
- 触发器 Trigger2 侦听路径模式:root.sg.a
- 触发器 Trigger3 侦听路径模式:root.sg.b
@@ -395,7 +395,7 @@ WITH (
- 该触发器是无状态的(STATELESS)
- 在写入前触发(BEFORE INSERT)
-- 该触发器侦听路径模式为 root.sg.**
+- 该触发器侦听路径模式为 root\.sg.**
- 所编写的触发器类名为 org.apache.iotdb.trigger.ClusterAlertingExample
- JAR 包的 URI 为 http://jar/ClusterAlertingExample.jar
- 创建该触发器实例时会传入 name 和 limit 两个参数。