This is an automated email from the ASF dual-hosted git repository.

chetanm pushed a commit to branch master
in repository https://gitbox.apache.org/repos/asf/openwhisk.git
The following commit(s) were added to refs/heads/master by this push:
new 3e89aa5 OpenWhisk User Events (#4584)
3e89aa5 is described below
commit 3e89aa51f79598a5156910b4752f9ec82b13a7c0
Author: Cosmin Stanciu <sel...@users.noreply.github.com>
AuthorDate: Tue Sep 24 21:31:25 2019 -0700
OpenWhisk User Events (#4584)
The user event service enables aggregating the metric events sent on
`events` topic and expose them as Prometheus (or Kamon) metrics. Out of the box
dashboards are provided for the Grafana/Prometheus mode which provide detailed
insights on performance metrics at cluster/namespace/action level.
---
.../apache/openwhisk/core/connector/Message.scala | 47 +-
.../openwhisk/core/entity/ActivationResult.scala | 17 +-
.../openwhisk/core/entity/WhiskActivation.scala | 4 +
core/monitoring/user-events/.dockerignore | 5 +
core/monitoring/user-events/Dockerfile | 34 +
core/monitoring/user-events/README.md | 55 +
core/monitoring/user-events/build.gradle | 53 +
.../compose/grafana/dashboards/global-metrics.json | 422 ++++++
.../grafana/dashboards/openwhisk_events.json | 1539 ++++++++++++++++++++
.../compose/grafana/dashboards/top-namespaces.json | 473 ++++++
.../grafana/provisioning/dashboards/dashboard.yml | 28 +
.../provisioning/datasources/datasource.yml | 67 +
.../user-events/compose/prometheus/prometheus.yml | 30 +
.../monitoring/user-events/images/demo_landing.png | Bin 0 -> 516563 bytes
core/monitoring/user-events/init.sh | 25 +
.../src/main/resources/application.conf | 52 +
.../user-events/src/main/resources/reference.conf | 27 +
.../src/main/resources/whisk-logback.xml | 25 +
.../core/monitoring/metrics/EventConsumer.scala | 145 ++
.../core/monitoring/metrics/KamonRecorder.scala | 111 ++
.../openwhisk/core/monitoring/metrics/Main.scala | 45 +
.../core/monitoring/metrics/MetricNames.scala | 52 +-
.../core/monitoring/metrics/OpenWhiskEvents.scala | 65 +
.../monitoring/metrics/PrometheusEventsApi.scala | 49 +
.../monitoring/metrics/PrometheusRecorder.scala | 250 ++++
.../core/monitoring/metrics/ApiTests.scala | 64 +
.../core/monitoring/metrics/EventsTestHelper.scala | 45 +
.../core/monitoring/metrics/KafkaSpecBase.scala | 56 +
.../monitoring/metrics/KamonRecorderTests.scala | 157 ++
.../monitoring/metrics/OpenWhiskEventsTests.scala | 84 ++
.../metrics/PrometheusRecorderTests.scala | 122 ++
docs/metrics.md | 3 +
settings.gradle | 1 +
tests/build.gradle | 1 +
.../apache/openwhisk/common/UserEventTests.scala | 6 +-
.../core/connector/test/EventMessageTests.scala | 8 +-
tools/jenkins/apache/dockerhub.groovy | 2 +-
37 files changed, 4122 insertions(+), 47 deletions(-)
diff --git
a/common/scala/src/main/scala/org/apache/openwhisk/core/connector/Message.scala
b/common/scala/src/main/scala/org/apache/openwhisk/core/connector/Message.scala
index 9a1a586..c8fb64d 100644
---
a/common/scala/src/main/scala/org/apache/openwhisk/core/connector/Message.scala
+++
b/common/scala/src/main/scala/org/apache/openwhisk/core/connector/Message.scala
@@ -21,6 +21,9 @@ import scala.util.Try
import spray.json._
import org.apache.openwhisk.common.TransactionId
import org.apache.openwhisk.core.entity._
+import scala.concurrent.duration._
+import java.util.concurrent.TimeUnit
+import org.apache.openwhisk.core.entity.ActivationResponse.statusForCode
/** Basic trait for messages that are sent on a message bus connector. */
trait Message {
@@ -283,22 +286,47 @@ object EventMessageBody extends DefaultJsonProtocol {
case class Activation(name: String,
statusCode: Int,
- duration: Long,
- waitTime: Long,
- initTime: Long,
+ duration: Duration,
+ waitTime: Duration,
+ initTime: Duration,
kind: String,
conductor: Boolean,
memory: Int,
causedBy: Option[String])
extends EventMessageBody {
- val typeName = "Activation"
+ val typeName = Activation.typeName
override def serialize = toJson.compactPrint
+ def entityPath: FullyQualifiedEntityName =
EntityPath(name).toFullyQualifiedEntityName
def toJson = Activation.activationFormat.write(this)
+
+ def status: String = statusForCode(statusCode)
+
+ def isColdStart: Boolean = initTime != Duration.Zero
+
+ def namespace: String = entityPath.path.root.name
+
+ def action: String = entityPath.fullPath.relativePath.get.namespace
+
}
object Activation extends DefaultJsonProtocol {
+
+ val typeName = "Activation"
def parse(msg: String) = Try(activationFormat.read(msg.parseJson))
+
+ private implicit val durationFormat = new RootJsonFormat[Duration] {
+ override def write(obj: Duration): JsValue = obj match {
+ case o if o.isFinite => JsNumber(o.toMillis)
+ case _ => JsNumber.zero
+ }
+
+ override def read(json: JsValue): Duration = json match {
+ case JsNumber(n) if n <= 0 => Duration.Zero
+ case JsNumber(n) => toDuration(n.longValue)
+ }
+ }
+
implicit val activationFormat =
jsonFormat(
Activation.apply _,
@@ -323,9 +351,9 @@ object Activation extends DefaultJsonProtocol {
Activation(
fqn,
a.response.statusCode,
- a.duration.getOrElse(0),
-
a.annotations.getAs[Long](WhiskActivation.waitTimeAnnotation).getOrElse(0),
-
a.annotations.getAs[Long](WhiskActivation.initTimeAnnotation).getOrElse(0),
+ toDuration(a.duration.getOrElse(0)),
+
toDuration(a.annotations.getAs[Long](WhiskActivation.waitTimeAnnotation).getOrElse(0)),
+
toDuration(a.annotations.getAs[Long](WhiskActivation.initTimeAnnotation).getOrElse(0)),
kind,
a.annotations.getAs[Boolean](WhiskActivation.conductorAnnotation).getOrElse(false),
a.annotations
@@ -335,6 +363,8 @@ object Activation extends DefaultJsonProtocol {
a.annotations.getAs[String](WhiskActivation.causedByAnnotation).toOption)
}
}
+
+ def toDuration(milliseconds: Long) = new FiniteDuration(milliseconds,
TimeUnit.MILLISECONDS)
}
case class Metric(metricName: String, metricValue: Long) extends
EventMessageBody {
@@ -344,6 +374,7 @@ case class Metric(metricName: String, metricValue: Long)
extends EventMessageBod
}
object Metric extends DefaultJsonProtocol {
+ val typeName = "Metric"
def parse(msg: String) = Try(metricFormat.read(msg.parseJson))
implicit val metricFormat = jsonFormat(Metric.apply _, "metricName",
"metricValue")
}
@@ -369,5 +400,5 @@ object EventMessage extends DefaultJsonProtocol {
}
}
- def parse(msg: String) = format.read(msg.parseJson)
+ def parse(msg: String) = Try(format.read(msg.parseJson))
}
diff --git
a/common/scala/src/main/scala/org/apache/openwhisk/core/entity/ActivationResult.scala
b/common/scala/src/main/scala/org/apache/openwhisk/core/entity/ActivationResult.scala
index 98f241d..e44a8ff 100644
---
a/common/scala/src/main/scala/org/apache/openwhisk/core/entity/ActivationResult.scala
+++
b/common/scala/src/main/scala/org/apache/openwhisk/core/entity/ActivationResult.scala
@@ -61,8 +61,23 @@ protected[core] object ActivationResponse extends
DefaultJsonProtocol {
val DeveloperError = 2 // action ran but failed to handle an error, or
action did not run and failed to initialize
val WhiskError = 3 // internal system error
+ val statusSuccess = "success"
+ val statusApplicationError = "application_error"
+ val statusDeveloperError = "action_developer_error"
+ val statusWhiskError = "whisk_internal_error"
+
+ protected[core] def statusForCode(code: Int) = {
+ require(code >= 0 && code <= 3)
+ code match {
+ case Success => statusSuccess
+ case ApplicationError => statusApplicationError
+ case DeveloperError => statusDeveloperError
+ case WhiskError => statusWhiskError
+ }
+ }
+
protected[core] def messageForCode(code: Int) = {
- require(code >= Success && code <= WhiskError)
+ require(code >= 0 && code <= 3)
code match {
case Success => "success"
case ApplicationError => "application error"
diff --git
a/common/scala/src/main/scala/org/apache/openwhisk/core/entity/WhiskActivation.scala
b/common/scala/src/main/scala/org/apache/openwhisk/core/entity/WhiskActivation.scala
index b275e8b..691acaf 100644
---
a/common/scala/src/main/scala/org/apache/openwhisk/core/entity/WhiskActivation.scala
+++
b/common/scala/src/main/scala/org/apache/openwhisk/core/entity/WhiskActivation.scala
@@ -145,6 +145,10 @@ object WhiskActivation
val conductorAnnotation = "conductor"
val timeoutAnnotation = "timeout"
+ val memory = "memory"
+ val duration = "duration"
+ val statusCode = "statusCode"
+
/** Some field names for compositions */
val actionField = "action"
val paramsField = "params"
diff --git a/core/monitoring/user-events/.dockerignore
b/core/monitoring/user-events/.dockerignore
new file mode 100644
index 0000000..a595535
--- /dev/null
+++ b/core/monitoring/user-events/.dockerignore
@@ -0,0 +1,5 @@
+*
+!transformEnvironment.sh
+!init.sh
+!build/distributions
+!Dockerfile
\ No newline at end of file
diff --git a/core/monitoring/user-events/Dockerfile
b/core/monitoring/user-events/Dockerfile
new file mode 100644
index 0000000..95b06ae
--- /dev/null
+++ b/core/monitoring/user-events/Dockerfile
@@ -0,0 +1,34 @@
+#
+# Licensed to the Apache Software Foundation (ASF) under one or more
+# contributor license agreements. See the NOTICE file distributed with
+# this work for additional information regarding copyright ownership.
+# The ASF licenses this file to You under the Apache License, Version 2.0
+# (the "License"); you may not use this file except in compliance with
+# the License. You may obtain a copy of the License at
+#
+# http://www.apache.org/licenses/LICENSE-2.0
+#
+# Unless required by applicable law or agreed to in writing, software
+# distributed under the License is distributed on an "AS IS" BASIS,
+# WITHOUT WARRANTIES OR CONDITIONS OF ANY KIND, either express or implied.
+# See the License for the specific language governing permissions and
+# limitations under the License.
+#
+
+FROM scala
+
+ENV UID=1001 \
+ NOT_ROOT_USER=owuser
+
+# Copy app jars
+ADD build/distributions/user-events.tar /
+
+COPY init.sh /
+RUN chmod +x init.sh
+
+RUN adduser -D -u ${UID} -h /home/${NOT_ROOT_USER} -s /bin/bash
${NOT_ROOT_USER}
+USER ${NOT_ROOT_USER}
+
+# Prometheus port
+EXPOSE 9095
+CMD ["./init.sh", "0"]
diff --git a/core/monitoring/user-events/README.md
b/core/monitoring/user-events/README.md
new file mode 100644
index 0000000..5ed2127
--- /dev/null
+++ b/core/monitoring/user-events/README.md
@@ -0,0 +1,55 @@
+<!--
+#
+# Licensed to the Apache Software Foundation (ASF) under one or more
+# contributor license agreements. See the NOTICE file distributed with
+# this work for additional information regarding copyright ownership.
+# The ASF licenses this file to You under the Apache License, Version 2.0
+# (the "License"); you may not use this file except in compliance with
+# the License. You may obtain a copy of the License at
+#
+# http://www.apache.org/licenses/LICENSE-2.0
+#
+# Unless required by applicable law or agreed to in writing, software
+# distributed under the License is distributed on an "AS IS" BASIS,
+# WITHOUT WARRANTIES OR CONDITIONS OF ANY KIND, either express or implied.
+# See the License for the specific language governing permissions and
+# limitations under the License.
+#
+-->
+
+# 
+
+# OpenWhisk User Events
+
+This service connects to `events` topic and publishes the events to various
services like Prometheus, Datadog etc via Kamon. Refer to [user specific
metrics][1] on how to enable them.
+
+
+## Local Run
+>First configure and run `openwhisk docker-compose` that can be found in the
[openwhisk-tools][2] project.
+
+- Start service inside the cluster (on the same docker-compose network:
`openwhisk_default`)
+- The service will be available on port `9095`
+- The endpoint for exposing the metrics for Prometheus can be found on
`/metrics`.
+
+## Usage
+
+The service needs the following env variables to be set
+
+- `KAFKA_HOSTS` - For local env it can be set to `172.17.0.1:9093`. When using
[OpenWhisk Devtools][2] based setup use `kafka`
+
+Integrations
+------------
+
+#### Prometheus
+The docker container would run the service and expose the metrics in format
required by [Prometheus][3] at `9095` port
+
+#### Grafana
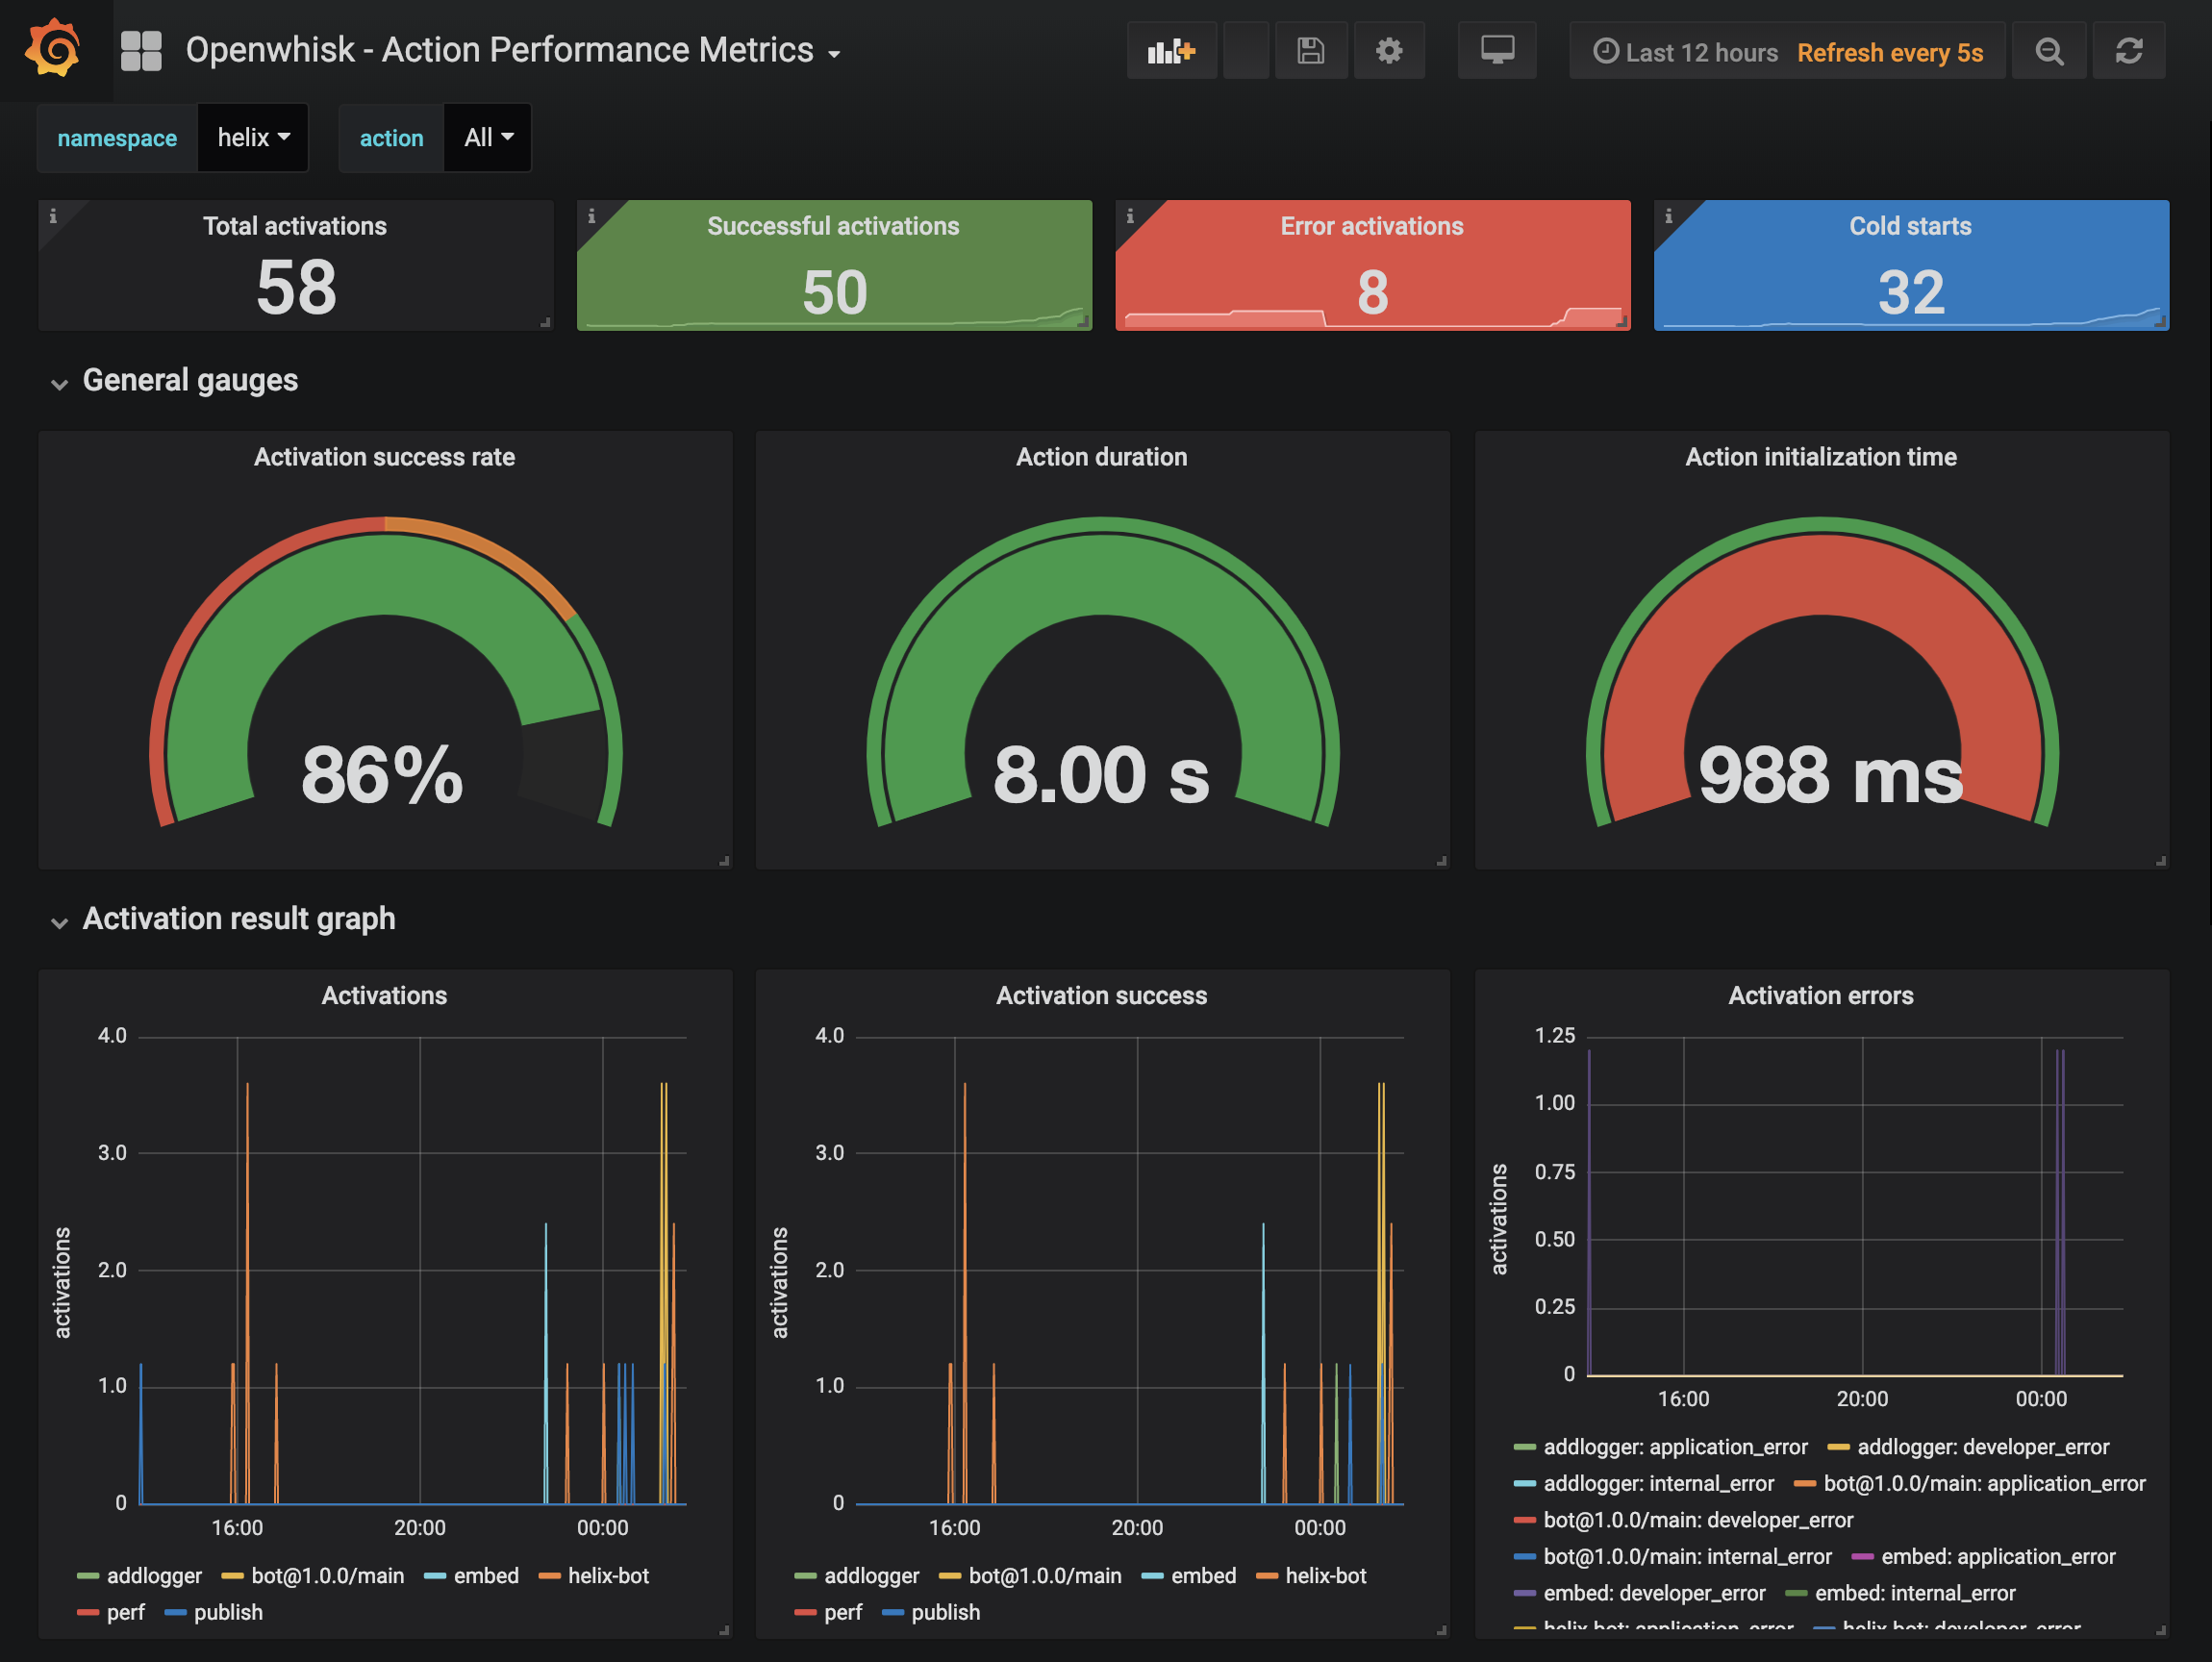
+The `Openwhisk - Action Performance Metrics` Grafana[4] dashboard is available
on localhost port `3000` at this address:
+http://localhost:3000/d/Oew1lvymk/openwhisk-action-performance-metrics
+
+The latest version of the dashboard can be found in the
"compose/dashboard/openwhisk_events.json"
+
+[1]:
https://github.com/apache/incubator-openwhisk/blob/master/docs/metrics.md#user-specific-metrics
+[2]:
https://github.com/apache/incubator-openwhisk-devtools/tree/master/docker-compose
+[3]: https://hub.docker.com/r/prom/prometheus/
+[4]: https://hub.docker.com/r/grafana/grafana/
diff --git a/core/monitoring/user-events/build.gradle
b/core/monitoring/user-events/build.gradle
new file mode 100644
index 0000000..d6ec836
--- /dev/null
+++ b/core/monitoring/user-events/build.gradle
@@ -0,0 +1,53 @@
+/*
+ * Licensed to the Apache Software Foundation (ASF) under one or more
+ * contributor license agreements. See the NOTICE file distributed with
+ * this work for additional information regarding copyright ownership.
+ * The ASF licenses this file to You under the Apache License, Version 2.0
+ * (the "License"); you may not use this file except in compliance with
+ * the License. You may obtain a copy of the License at
+ *
+ * http://www.apache.org/licenses/LICENSE-2.0
+ *
+ * Unless required by applicable law or agreed to in writing, software
+ * distributed under the License is distributed on an "AS IS" BASIS,
+ * WITHOUT WARRANTIES OR CONDITIONS OF ANY KIND, either express or implied.
+ * See the License for the specific language governing permissions and
+ * limitations under the License.
+ */
+
+apply plugin: 'scala'
+apply plugin: 'application'
+apply plugin: 'org.scoverage'
+
+ext.dockerImageName = 'user-events'
+apply from: "../../../gradle/docker.gradle"
+distDocker.dependsOn ':common:scala:distDocker', 'distTar'
+
+project.archivesBaseName = "openwhisk-user-events"
+
+repositories {
+ mavenCentral()
+}
+
+dependencies {
+ compile "org.scala-lang:scala-library:${gradle.scala.version}"
+ compile project(':common:scala')
+
+ compile 'com.typesafe.akka:akka-stream-kafka_2.12:0.22'
+
+ compile 'io.prometheus:simpleclient:0.6.0'
+ compile 'io.prometheus:simpleclient_common:0.6.0'
+
+ testCompile 'junit:junit:4.11'
+ testCompile 'org.scalatest:scalatest_2.12:3.0.1'
+ testCompile 'net.manub:scalatest-embedded-kafka_2.12:2.0.0'
+ testCompile 'com.typesafe.akka:akka-testkit_2.12:2.5.17'
+ testCompile 'com.typesafe.akka:akka-stream-testkit_2.12:2.5.17'
+ testCompile 'com.typesafe.akka:akka-http-testkit_2.12:10.1.5'
+}
+
+tasks.withType(ScalaCompile) {
+ scalaCompileOptions.additionalParameters = gradle.scala.compileFlags
+}
+
+mainClassName = "org.apache.openwhisk.core.monitoring.metrics.Main"
diff --git
a/core/monitoring/user-events/compose/grafana/dashboards/global-metrics.json
b/core/monitoring/user-events/compose/grafana/dashboards/global-metrics.json
new file mode 100644
index 0000000..77051f0
--- /dev/null
+++ b/core/monitoring/user-events/compose/grafana/dashboards/global-metrics.json
@@ -0,0 +1,422 @@
+{
+ "annotations": {
+ "list": [
+ {
+ "builtIn": 1,
+ "datasource": "-- Grafana --",
+ "enable": true,
+ "hide": true,
+ "iconColor": "rgba(0, 211, 255, 1)",
+ "name": "Annotations & Alerts",
+ "type": "dashboard"
+ }
+ ]
+ },
+ "editable": true,
+ "gnetId": null,
+ "graphTooltip": 0,
+ "links": [],
+ "panels": [
+ {
+ "cacheTimeout": null,
+ "colorBackground": true,
+ "colorValue": false,
+ "colors": [
+ "#d44a3a",
+ "rgba(237, 129, 40, 0.89)",
+ "#299c46"
+ ],
+ "datasource": "Prometheus",
+ "description": "Total number of successful activations executed",
+ "format": "none",
+ "gauge": {
+ "maxValue": 100,
+ "minValue": 0,
+ "show": false,
+ "thresholdLabels": false,
+ "thresholdMarkers": true
+ },
+ "gridPos": {
+ "h": 3,
+ "w": 4,
+ "x": 0,
+ "y": 0
+ },
+ "id": 4,
+ "interval": null,
+ "links": [],
+ "mappingType": 1,
+ "mappingTypes": [
+ {
+ "name": "value to text",
+ "value": 1
+ },
+ {
+ "name": "range to text",
+ "value": 2
+ }
+ ],
+ "maxDataPoints": 100,
+ "nullPointMode": "connected",
+ "nullText": null,
+ "postfix": "",
+ "postfixFontSize": "50%",
+ "prefix": "",
+ "prefixFontSize": "50%",
+ "rangeMaps": [
+ {
+ "from": "null",
+ "text": "N/A",
+ "to": "null"
+ }
+ ],
+ "sparkline": {
+ "fillColor": "rgba(31, 118, 189, 0.18)",
+ "full": false,
+ "lineColor": "#9ac48a",
+ "show": true
+ },
+ "tableColumn": "Value",
+ "targets": [
+ {
+ "expr":
"sum(increase(openwhisk_action_status{status=\"success\"}[${__range_s}s]))",
+ "format": "time_series",
+ "instant": true,
+ "intervalFactor": 1,
+ "refId": "A"
+ }
+ ],
+ "thresholds": "0,1",
+ "title": "Successful Activations",
+ "type": "singlestat",
+ "valueFontSize": "80%",
+ "valueMaps": [
+ {
+ "op": "=",
+ "text": "N/A",
+ "value": "null"
+ }
+ ],
+ "valueName": "total"
+ },
+ {
+ "cacheTimeout": null,
+ "colorBackground": false,
+ "colorValue": false,
+ "colors": [
+ "#299c46",
+ "rgba(237, 129, 40, 0.89)",
+ "#d44a3a"
+ ],
+ "datasource": "Prometheus",
+ "description": "Total number of cold starts",
+ "format": "none",
+ "gauge": {
+ "maxValue": 100,
+ "minValue": 0,
+ "show": false,
+ "thresholdLabels": false,
+ "thresholdMarkers": true
+ },
+ "gridPos": {
+ "h": 3,
+ "w": 4,
+ "x": 4,
+ "y": 0
+ },
+ "id": 6,
+ "interval": null,
+ "links": [],
+ "mappingType": 1,
+ "mappingTypes": [
+ {
+ "name": "value to text",
+ "value": 1
+ },
+ {
+ "name": "range to text",
+ "value": 2
+ }
+ ],
+ "maxDataPoints": 100,
+ "nullPointMode": "connected",
+ "nullText": null,
+ "postfix": "",
+ "postfixFontSize": "50%",
+ "prefix": "",
+ "prefixFontSize": "50%",
+ "rangeMaps": [
+ {
+ "from": "null",
+ "text": "N/A",
+ "to": "null"
+ }
+ ],
+ "sparkline": {
+ "fillColor": "rgba(31, 118, 189, 0.18)",
+ "full": false,
+ "lineColor": "#9ac48a",
+ "show": true
+ },
+ "tableColumn": "Value",
+ "targets": [
+ {
+ "expr":
"sum(increase(openwhisk_action_coldStarts_total[${__range_s}s]))",
+ "format": "time_series",
+ "instant": true,
+ "intervalFactor": 1,
+ "refId": "A"
+ }
+ ],
+ "thresholds": "1",
+ "title": "Cold Starts",
+ "type": "singlestat",
+ "valueFontSize": "80%",
+ "valueMaps": [
+ {
+ "op": "=",
+ "text": "N/A",
+ "value": "null"
+ }
+ ],
+ "valueName": "current"
+ },
+ {
+ "cacheTimeout": null,
+ "colorBackground": true,
+ "colorPrefix": false,
+ "colorValue": false,
+ "colors": [
+ "#299c46",
+ "rgba(237, 129, 40, 0.89)",
+ "#d44a3a"
+ ],
+ "datasource": "Prometheus",
+ "description": "Total number of error due to Runtime implementation",
+ "format": "none",
+ "gauge": {
+ "maxValue": 100,
+ "minValue": 0,
+ "show": false,
+ "thresholdLabels": false,
+ "thresholdMarkers": true
+ },
+ "gridPos": {
+ "h": 3,
+ "w": 4,
+ "x": 8,
+ "y": 0
+ },
+ "id": 5,
+ "interval": null,
+ "links": [],
+ "mappingType": 1,
+ "mappingTypes": [
+ {
+ "name": "value to text",
+ "value": 1
+ },
+ {
+ "name": "range to text",
+ "value": 2
+ }
+ ],
+ "maxDataPoints": 100,
+ "nullPointMode": "connected",
+ "nullText": null,
+ "postfix": "",
+ "postfixFontSize": "50%",
+ "prefix": "",
+ "prefixFontSize": "50%",
+ "rangeMaps": [
+ {
+ "from": "null",
+ "text": "N/A",
+ "to": "null"
+ }
+ ],
+ "sparkline": {
+ "fillColor": "rgba(31, 118, 189, 0.18)",
+ "full": false,
+ "lineColor": "#9ac48a",
+ "show": true
+ },
+ "tableColumn": "Value",
+ "targets": [
+ {
+ "expr":
"sum(increase(openwhisk_action_status{status=\"internal_error\"}[${__range_s}s]))",
+ "format": "time_series",
+ "instant": true,
+ "intervalFactor": 1,
+ "refId": "A"
+ }
+ ],
+ "thresholds": "0,1",
+ "title": "Internal Errors",
+ "type": "singlestat",
+ "valueFontSize": "80%",
+ "valueMaps": [
+ {
+ "op": "=",
+ "text": "N/A",
+ "value": "null"
+ }
+ ],
+ "valueName": "current"
+ },
+ {
+ "folderId": null,
+ "gridPos": {
+ "h": 3,
+ "w": 11,
+ "x": 12,
+ "y": 0
+ },
+ "headings": true,
+ "id": 8,
+ "limit": 10,
+ "links": [],
+ "query": "",
+ "recent": false,
+ "search": true,
+ "starred": false,
+ "tags": ["openwhisk"],
+ "title": "Related Dashboards",
+ "type": "dashlist"
+ },
+ {
+ "aliasColors": {},
+ "bars": false,
+ "dashLength": 10,
+ "dashes": false,
+ "datasource": "Prometheus",
+ "fill": 1,
+ "gridPos": {
+ "h": 8,
+ "w": 24,
+ "x": 0,
+ "y": 3
+ },
+ "id": 2,
+ "legend": {
+ "avg": false,
+ "current": false,
+ "max": false,
+ "min": false,
+ "show": false,
+ "total": false,
+ "values": false
+ },
+ "lines": true,
+ "linewidth": 1,
+ "links": [
+ {
+ "dashboard": "OpenWhisk - Top Namespaces",
+ "keepTime": true,
+ "title": "OpenWhisk - Top Namespaces",
+ "type": "dashboard",
+ "url": "/d/RnvlchiZk/openwhisk-top-namespaces"
+ }
+ ],
+ "nullPointMode": "null",
+ "percentage": false,
+ "pointradius": 5,
+ "points": false,
+ "renderer": "flot",
+ "seriesOverrides": [],
+ "spaceLength": 10,
+ "stack": false,
+ "steppedLine": false,
+ "targets": [
+ {
+ "expr": "sum(increase(openwhisk_action_activations_total[1m]))",
+ "format": "time_series",
+ "intervalFactor": 1,
+ "refId": "A"
+ }
+ ],
+ "thresholds": [],
+ "timeFrom": null,
+ "timeRegions": [],
+ "timeShift": null,
+ "title": "Activations",
+ "tooltip": {
+ "shared": true,
+ "sort": 0,
+ "value_type": "individual"
+ },
+ "type": "graph",
+ "xaxis": {
+ "buckets": null,
+ "mode": "time",
+ "name": null,
+ "show": true,
+ "values": []
+ },
+ "yaxes": [
+ {
+ "format": "short",
+ "label": null,
+ "logBase": 1,
+ "max": null,
+ "min": null,
+ "show": true
+ },
+ {
+ "format": "short",
+ "label": null,
+ "logBase": 1,
+ "max": null,
+ "min": null,
+ "show": true
+ }
+ ],
+ "yaxis": {
+ "align": false,
+ "alignLevel": null
+ }
+ }
+ ],
+ "refresh": false,
+ "schemaVersion": 16,
+ "style": "dark",
+ "tags": [
+ "openwhisk"
+ ],
+ "templating": {
+ "list": []
+ },
+ "time": {
+ "from": "now-15m",
+ "to": "now"
+ },
+ "timepicker": {
+ "refresh_intervals": [
+ "5s",
+ "10s",
+ "30s",
+ "1m",
+ "5m",
+ "15m",
+ "30m",
+ "1h",
+ "2h",
+ "1d"
+ ],
+ "time_options": [
+ "5m",
+ "15m",
+ "1h",
+ "6h",
+ "12h",
+ "24h",
+ "2d",
+ "7d",
+ "30d"
+ ]
+ },
+ "timezone": "",
+ "title": "OpenWhisk - Global Metrics",
+ "uid": "Kw4jl2iZz",
+ "version": 8
+}
\ No newline at end of file
diff --git
a/core/monitoring/user-events/compose/grafana/dashboards/openwhisk_events.json
b/core/monitoring/user-events/compose/grafana/dashboards/openwhisk_events.json
new file mode 100644
index 0000000..e96d62f
--- /dev/null
+++
b/core/monitoring/user-events/compose/grafana/dashboards/openwhisk_events.json
@@ -0,0 +1,1539 @@
+{
+ "__inputs": [
+ {
+ "name": "DS_PROMETHEUS",
+ "label": "Prometheus",
+ "description": "",
+ "type": "datasource",
+ "pluginId": "prometheus",
+ "pluginName": "Prometheus"
+ }
+ ],
+ "__requires": [
+ {
+ "type": "grafana",
+ "id": "grafana",
+ "name": "Grafana",
+ "version": "5.4.3"
+ },
+ {
+ "type": "panel",
+ "id": "graph",
+ "name": "Graph",
+ "version": "5.0.0"
+ },
+ {
+ "type": "datasource",
+ "id": "prometheus",
+ "name": "Prometheus",
+ "version": "5.0.0"
+ },
+ {
+ "type": "panel",
+ "id": "singlestat",
+ "name": "Singlestat",
+ "version": "5.0.0"
+ }
+ ],
+ "annotations": {
+ "list": [
+ {
+ "builtIn": 1,
+ "datasource": "-- Grafana --",
+ "enable": true,
+ "hide": true,
+ "iconColor": "rgba(0, 211, 255, 1)",
+ "name": "Annotations & Alerts",
+ "type": "dashboard"
+ }
+ ]
+ },
+ "description": "Action performance metrics available for the users of
Openwhisk.",
+ "editable": true,
+ "gnetId": 9564,
+ "graphTooltip": 0,
+ "id": null,
+ "iteration": 1548707435650,
+ "links": [],
+ "panels": [
+ {
+ "cacheTimeout": null,
+ "colorBackground": false,
+ "colorValue": false,
+ "colors": [
+ "#299c46",
+ "rgba(237, 129, 40, 0.89)",
+ "#d44a3a"
+ ],
+ "datasource": "Prometheus",
+ "decimals": 0,
+ "description": "Total number of activation in the selected time
interval",
+ "format": "none",
+ "gauge": {
+ "maxValue": 100,
+ "minValue": 0,
+ "show": false,
+ "thresholdLabels": false,
+ "thresholdMarkers": true
+ },
+ "gridPos": {
+ "h": 2,
+ "w": 6,
+ "x": 0,
+ "y": 0
+ },
+ "id": 28,
+ "interval": null,
+ "links": [],
+ "mappingType": 1,
+ "mappingTypes": [
+ {
+ "name": "value to text",
+ "value": 1
+ },
+ {
+ "name": "range to text",
+ "value": 2
+ }
+ ],
+ "maxDataPoints": 100,
+ "nullPointMode": "connected",
+ "nullText": null,
+ "postfix": "",
+ "postfixFontSize": "50%",
+ "prefix": "",
+ "prefixFontSize": "50%",
+ "rangeMaps": [
+ {
+ "from": "null",
+ "text": "N/A",
+ "to": "null"
+ }
+ ],
+ "sparkline": {
+ "fillColor": "rgba(249, 186, 143, 0.15)",
+ "full": false,
+ "lineColor": "#ef843c",
+ "show": false
+ },
+ "tableColumn": "",
+ "targets": [
+ {
+ "expr":
"sum(increase(openwhisk_action_activations_total{region=~\"$region\",stack=~\"$stack\",namespace=~\"$namespace\",action=~\"$action\",initiator=~\"$initiator\"}[$interval]))",
+ "format": "time_series",
+ "intervalFactor": 1,
+ "refId": "A"
+ }
+ ],
+ "thresholds": "",
+ "title": "Total activations",
+ "type": "singlestat",
+ "valueFontSize": "100%",
+ "valueMaps": [
+ {
+ "op": "=",
+ "text": "N/A",
+ "value": "null"
+ }
+ ],
+ "valueName": "current"
+ },
+ {
+ "cacheTimeout": null,
+ "colorBackground": true,
+ "colorValue": false,
+ "colors": [
+ "rgba(212, 74, 58, 0)",
+ "#508642",
+ "#299c46"
+ ],
+ "datasource": "Prometheus",
+ "decimals": 0,
+ "description": "Total number of successful activations executed",
+ "format": "none",
+ "gauge": {
+ "maxValue": 100,
+ "minValue": 0,
+ "show": false,
+ "thresholdLabels": false,
+ "thresholdMarkers": true
+ },
+ "gridPos": {
+ "h": 2,
+ "w": 6,
+ "x": 6,
+ "y": 0
+ },
+ "id": 32,
+ "interval": null,
+ "links": [],
+ "mappingType": 1,
+ "mappingTypes": [
+ {
+ "name": "value to text",
+ "value": 1
+ },
+ {
+ "name": "range to text",
+ "value": 2
+ }
+ ],
+ "maxDataPoints": 100,
+ "nullPointMode": "connected",
+ "nullText": null,
+ "postfix": "",
+ "postfixFontSize": "50%",
+ "prefix": "",
+ "prefixFontSize": "50%",
+ "rangeMaps": [
+ {
+ "from": "null",
+ "text": "N/A",
+ "to": "null"
+ }
+ ],
+ "sparkline": {
+ "fillColor": "rgba(136, 253, 150, 0.18)",
+ "full": false,
+ "lineColor": "#7eb26d",
+ "show": true
+ },
+ "tableColumn": "",
+ "targets": [
+ {
+ "expr":
"sum(increase(openwhisk_action_status{region=~\"$region\",stack=~\"$stack\",namespace=~\"$namespace\",action=~\"$action\",status=\"success\",initiator=~\"$initiator\"}[$interval]))",
+ "format": "time_series",
+ "intervalFactor": 1,
+ "refId": "A"
+ }
+ ],
+ "thresholds": "1",
+ "title": "Successful activations",
+ "type": "singlestat",
+ "valueFontSize": "80%",
+ "valueMaps": [
+ {
+ "op": "=",
+ "text": "N/A",
+ "value": "null"
+ }
+ ],
+ "valueName": "current"
+ },
+ {
+ "cacheTimeout": null,
+ "colorBackground": true,
+ "colorPostfix": false,
+ "colorPrefix": false,
+ "colorValue": false,
+ "colors": [
+ "rgba(41, 156, 70, 0)",
+ "#e24d42",
+ "#e24d42"
+ ],
+ "datasource": "Prometheus",
+ "decimals": 0,
+ "description": "Total number of error activations in the selected time
interval",
+ "format": "none",
+ "gauge": {
+ "maxValue": 100,
+ "minValue": 0,
+ "show": false,
+ "thresholdLabels": false,
+ "thresholdMarkers": true
+ },
+ "gridPos": {
+ "h": 2,
+ "w": 6,
+ "x": 12,
+ "y": 0
+ },
+ "id": 34,
+ "interval": null,
+ "links": [],
+ "mappingType": 1,
+ "mappingTypes": [
+ {
+ "name": "value to text",
+ "value": 1
+ },
+ {
+ "name": "range to text",
+ "value": 2
+ }
+ ],
+ "maxDataPoints": 100,
+ "nullPointMode": "connected",
+ "nullText": null,
+ "postfix": "",
+ "postfixFontSize": "50%",
+ "prefix": "",
+ "prefixFontSize": "50%",
+ "rangeMaps": [
+ {
+ "from": "null",
+ "text": "N/A",
+ "to": "null"
+ }
+ ],
+ "sparkline": {
+ "fillColor": "rgb(243, 113, 104)",
+ "full": false,
+ "lineColor": "rgb(255, 194, 190)",
+ "show": true
+ },
+ "tableColumn": "",
+ "targets": [
+ {
+ "expr":
"sum(increase(openwhisk_action_status{region=~\"$region\",stack=~\"$stack\",action=~\"$action\",status!=\"success\",initiator=~\"$initiator\"}[$interval]))",
+ "format": "time_series",
+ "intervalFactor": 1,
+ "refId": "A"
+ }
+ ],
+ "thresholds": "1",
+ "title": "Error activations",
+ "type": "singlestat",
+ "valueFontSize": "80%",
+ "valueMaps": [
+ {
+ "op": "=",
+ "text": "N/A",
+ "value": "null"
+ }
+ ],
+ "valueName": "current"
+ },
+ {
+ "cacheTimeout": null,
+ "colorBackground": true,
+ "colorValue": false,
+ "colors": [
+ "rgba(41, 156, 70, 0)",
+ "#1f78c1",
+ "#1f78c1"
+ ],
+ "datasource": "Prometheus",
+ "decimals": 0,
+ "description": "Total number of cold starts in the selected time
interval",
+ "format": "none",
+ "gauge": {
+ "maxValue": 100,
+ "minValue": 0,
+ "show": false,
+ "thresholdLabels": false,
+ "thresholdMarkers": true
+ },
+ "gridPos": {
+ "h": 2,
+ "w": 6,
+ "x": 18,
+ "y": 0
+ },
+ "id": 30,
+ "interval": null,
+ "links": [],
+ "mappingType": 1,
+ "mappingTypes": [
+ {
+ "name": "value to text",
+ "value": 1
+ },
+ {
+ "name": "range to text",
+ "value": 2
+ }
+ ],
+ "maxDataPoints": 100,
+ "nullPointMode": "connected",
+ "nullText": null,
+ "postfix": "",
+ "postfixFontSize": "50%",
+ "prefix": "",
+ "prefixFontSize": "50%",
+ "rangeMaps": [
+ {
+ "from": "null",
+ "text": "N/A",
+ "to": "null"
+ }
+ ],
+ "sparkline": {
+ "fillColor": "rgba(81, 149, 206, 0.48)",
+ "full": false,
+ "lineColor": "rgb(122, 181, 231)",
+ "show": true
+ },
+ "tableColumn": "",
+ "targets": [
+ {
+ "expr":
"sum(increase(openwhisk_action_coldStarts_total{region=~\"$region\",stack=~\"$stack\",namespace=~\"$namespace\",action=~\"$action\",initiator=~\"$initiator\"}[$interval]))",
+ "format": "time_series",
+ "intervalFactor": 1,
+ "refId": "A"
+ }
+ ],
+ "thresholds": "1",
+ "title": "Cold starts",
+ "type": "singlestat",
+ "valueFontSize": "80%",
+ "valueMaps": [
+ {
+ "op": "=",
+ "text": "N/A",
+ "value": "null"
+ }
+ ],
+ "valueName": "current"
+ },
+ {
+ "collapsed": false,
+ "gridPos": {
+ "h": 1,
+ "w": 24,
+ "x": 0,
+ "y": 2
+ },
+ "id": 16,
+ "panels": [],
+ "title": "General gauges",
+ "type": "row"
+ },
+ {
+ "cacheTimeout": null,
+ "colorBackground": false,
+ "colorValue": false,
+ "colors": [
+ "#d44a3a",
+ "rgba(237, 129, 40, 0.89)",
+ "#299c46"
+ ],
+ "datasource": "Prometheus",
+ "decimals": 1,
+ "format": "percent",
+ "gauge": {
+ "maxValue": 100,
+ "minValue": 0,
+ "show": true,
+ "thresholdLabels": false,
+ "thresholdMarkers": true
+ },
+ "gridPos": {
+ "h": 6,
+ "w": 6,
+ "x": 0,
+ "y": 3
+ },
+ "id": 6,
+ "interval": null,
+ "links": [],
+ "mappingType": 1,
+ "mappingTypes": [
+ {
+ "name": "value to text",
+ "value": 1
+ },
+ {
+ "name": "range to text",
+ "value": 2
+ }
+ ],
+ "maxDataPoints": 100,
+ "nullPointMode": "connected",
+ "nullText": null,
+ "postfix": "",
+ "postfixFontSize": "50%",
+ "prefix": "",
+ "prefixFontSize": "50%",
+ "rangeMaps": [
+ {
+ "from": "null",
+ "text": "N/A",
+ "to": "null"
+ }
+ ],
+ "sparkline": {
+ "fillColor": "rgba(31, 118, 189, 0.18)",
+ "full": false,
+ "lineColor": "rgb(31, 120, 193)",
+ "show": false
+ },
+ "tableColumn": "",
+ "targets": [
+ {
+ "expr":
"sum(increase(openwhisk_action_status{region=~\"$region\",stack=~\"$stack\",namespace=~\"$namespace\",action=~\"$action\",status=\"success\",initiator=~\"$initiator\"}[$interval]))
* 100 /
sum(increase(openwhisk_action_status{region=~\"$region\",stack=~\"$stack\",namespace=~\"$namespace\",action=~\"$action\"}[$interval]))",
+ "format": "time_series",
+ "intervalFactor": 1,
+ "refId": "A",
+ "target": ""
+ }
+ ],
+ "thresholds": "50,75,100",
+ "title": "Activation success rate",
+ "type": "singlestat",
+ "valueFontSize": "80%",
+ "valueMaps": [
+ {
+ "op": "=",
+ "text": "N/A",
+ "value": "null"
+ }
+ ],
+ "valueName": "current"
+ },
+ {
+ "cacheTimeout": null,
+ "colorBackground": false,
+ "colorValue": false,
+ "colors": [
+ "#299c46",
+ "rgba(237, 129, 40, 0.89)",
+ "#d44a3a"
+ ],
+ "datasource": "Prometheus",
+ "decimals": 1,
+ "format": "s",
+ "gauge": {
+ "maxValue": 60,
+ "minValue": 0,
+ "show": true,
+ "thresholdLabels": false,
+ "thresholdMarkers": true
+ },
+ "gridPos": {
+ "h": 6,
+ "w": 6,
+ "x": 6,
+ "y": 3
+ },
+ "id": 8,
+ "interval": null,
+ "links": [],
+ "mappingType": 1,
+ "mappingTypes": [
+ {
+ "name": "value to text",
+ "value": 1
+ },
+ {
+ "name": "range to text",
+ "value": 2
+ }
+ ],
+ "maxDataPoints": 100,
+ "nullPointMode": "connected",
+ "nullText": null,
+ "postfix": "",
+ "postfixFontSize": "50%",
+ "prefix": "",
+ "prefixFontSize": "50%",
+ "rangeMaps": [
+ {
+ "from": "null",
+ "text": "N/A",
+ "to": "null"
+ }
+ ],
+ "sparkline": {
+ "fillColor": "rgba(31, 118, 189, 0.18)",
+ "full": false,
+ "lineColor": "rgb(31, 120, 193)",
+ "show": false
+ },
+ "tableColumn": "",
+ "targets": [
+ {
+ "expr":
"max(rate(openwhisk_action_duration_seconds_sum{region=~\"$region\",stack=~\"$stack\",namespace=~\"$namespace\",action=~\"$action\",initiator=~\"$initiator\"}[30s])
/
rate(openwhisk_action_duration_seconds_count{region=~\"$region\",stack=~\"$stack\",namespace=~\"$namespace\",action=~\"$action\"}[30s])
> 0)",
+ "format": "time_series",
+ "instant": false,
+ "intervalFactor": 1,
+ "refId": "A",
+ "target": ""
+ }
+ ],
+ "thresholds": "20,40,60",
+ "title": "Action duration current",
+ "type": "singlestat",
+ "valueFontSize": "80%",
+ "valueMaps": [
+ {
+ "op": "=",
+ "text": "N/A",
+ "value": "null"
+ }
+ ],
+ "valueName": "current"
+ },
+ {
+ "cacheTimeout": null,
+ "colorBackground": false,
+ "colorValue": false,
+ "colors": [
+ "#d44a3a",
+ "rgba(237, 129, 40, 0.89)",
+ "#299c46"
+ ],
+ "datasource": "Prometheus",
+ "decimals": 1,
+ "format": "s",
+ "gauge": {
+ "maxValue": 100,
+ "minValue": 0,
+ "show": true,
+ "thresholdLabels": false,
+ "thresholdMarkers": true
+ },
+ "gridPos": {
+ "h": 6,
+ "w": 6,
+ "x": 12,
+ "y": 3
+ },
+ "id": 26,
+ "interval": null,
+ "links": [],
+ "mappingType": 1,
+ "mappingTypes": [
+ {
+ "name": "value to text",
+ "value": 1
+ },
+ {
+ "name": "range to text",
+ "value": 2
+ }
+ ],
+ "maxDataPoints": 100,
+ "nullPointMode": "connected",
+ "nullText": null,
+ "postfix": "",
+ "postfixFontSize": "50%",
+ "prefix": "",
+ "prefixFontSize": "50%",
+ "rangeMaps": [
+ {
+ "from": "null",
+ "text": "N/A",
+ "to": "null"
+ }
+ ],
+ "sparkline": {
+ "fillColor": "rgba(31, 118, 189, 0.18)",
+ "full": false,
+ "lineColor": "rgb(31, 120, 193)",
+ "show": false
+ },
+ "tableColumn": "",
+ "targets": [
+ {
+ "expr":
"max(rate(openwhisk_action_waitTime_seconds_sum{region=~\"$region\",stack=~\"$stack\",namespace=~\"$namespace\",action=~\"$action\",initiator=~\"$initiator\"}[30s])
/
rate(openwhisk_action_waitTime_seconds_count{region=~\"$region\",stack=~\"$stack\",namespace=~\"$namespace\",action=~\"$action\"}[30s])
> 0)",
+ "format": "time_series",
+ "interval": "",
+ "intervalFactor": 1,
+ "refId": "A"
+ }
+ ],
+ "thresholds": "1000,2500,5000",
+ "title": "Action wait time current",
+ "type": "singlestat",
+ "valueFontSize": "80%",
+ "valueMaps": [
+ {
+ "op": "=",
+ "text": "N/A",
+ "value": "null"
+ }
+ ],
+ "valueName": "current"
+ },
+ {
+ "columns": [
+ {
+ "text": "Current",
+ "value": "current"
+ }
+ ],
+ "datasource": "Prometheus",
+ "fontSize": "100%",
+ "gridPos": {
+ "h": 6,
+ "w": 6,
+ "x": 18,
+ "y": 3
+ },
+ "id": 37,
+ "links": [],
+ "pageSize": null,
+ "scroll": true,
+ "showHeader": true,
+ "sort": {
+ "col": 0,
+ "desc": true
+ },
+ "styles": [
+ {
+ "alias": "Action name",
+ "dateFormat": "YYYY-MM-DD HH:mm:ss",
+ "pattern": "Metric",
+ "type": "string"
+ },
+ {
+ "alias": "Max memory",
+ "colorMode": null,
+ "colors": [
+ "rgba(245, 54, 54, 0.9)",
+ "rgba(237, 129, 40, 0.89)",
+ "rgba(50, 172, 45, 0.97)"
+ ],
+ "dateFormat": "YYYY-MM-DD HH:mm:ss",
+ "decimals": 0,
+ "mappingType": 1,
+ "pattern": "Current",
+ "thresholds": [],
+ "type": "number",
+ "unit": "decmbytes"
+ },
+ {
+ "alias": "",
+ "colorMode": null,
+ "colors": [
+ "rgba(245, 54, 54, 0.9)",
+ "rgba(237, 129, 40, 0.89)",
+ "rgba(50, 172, 45, 0.97)"
+ ],
+ "decimals": 2,
+ "pattern": "/.*/",
+ "thresholds": [],
+ "type": "number",
+ "unit": "short"
+ }
+ ],
+ "targets": [
+ {
+ "expr":
"sum(increase(openwhisk_action_memory_sum{region=~\"$region\",stack=~\"$stack\",namespace=~\"$namespace\",action=~\"$action\",initiator=~\"$initiator\"}[$__range]))
by (action) /
sum(increase(openwhisk_action_memory_count{region=~\"$region\",stack=~\"$stack\",namespace=~\"$namespace\",action=~\"$action\"}[$__range]))
by (action) > 0",
+ "format": "time_series",
+ "instant": false,
+ "intervalFactor": 1,
+ "legendFormat": "{{action}}",
+ "refId": "A"
+ }
+ ],
+ "title": "Action memory",
+ "transform": "timeseries_aggregations",
+ "type": "table"
+ },
+ {
+ "gridPos": {
+ "h": 1,
+ "w": 24,
+ "x": 0,
+ "y": 9
+ },
+ "id": 14,
+ "title": "Activation result graph",
+ "type": "row"
+ },
+ {
+ "aliasColors": {},
+ "bars": false,
+ "dashLength": 10,
+ "dashes": false,
+ "datasource": "Prometheus",
+ "fill": 0,
+ "gridPos": {
+ "h": 9,
+ "w": 8,
+ "x": 0,
+ "y": 10
+ },
+ "id": 4,
+ "legend": {
+ "avg": false,
+ "current": false,
+ "max": false,
+ "min": false,
+ "show": true,
+ "total": false,
+ "values": false
+ },
+ "lines": true,
+ "linewidth": 1,
+ "links": [],
+ "nullPointMode": "null",
+ "percentage": false,
+ "pointradius": 5,
+ "points": false,
+ "renderer": "flot",
+ "seriesOverrides": [],
+ "spaceLength": 10,
+ "stack": false,
+ "steppedLine": false,
+ "targets": [
+ {
+ "expr":
"sum(increase(openwhisk_action_activations_total{region=~\"$region\",stack=~\"$stack\",namespace=~\"$namespace\",action=~\"$action\",initiator=~\"$initiator\"}[1m]))
by (action)",
+ "format": "time_series",
+ "interval": "",
+ "intervalFactor": 1,
+ "legendFormat": "{{action}}",
+ "refId": "A"
+ }
+ ],
+ "thresholds": [],
+ "timeFrom": null,
+ "timeRegions": [],
+ "timeShift": null,
+ "title": "Activations",
+ "tooltip": {
+ "shared": true,
+ "sort": 0,
+ "value_type": "individual"
+ },
+ "type": "graph",
+ "xaxis": {
+ "buckets": null,
+ "mode": "time",
+ "name": null,
+ "show": true,
+ "values": []
+ },
+ "yaxes": [
+ {
+ "decimals": 0,
+ "format": "short",
+ "label": "activations",
+ "logBase": 1,
+ "max": null,
+ "min": null,
+ "show": true
+ },
+ {
+ "format": "short",
+ "label": null,
+ "logBase": 1,
+ "max": null,
+ "min": null,
+ "show": true
+ }
+ ],
+ "yaxis": {
+ "align": false,
+ "alignLevel": null
+ }
+ },
+ {
+ "aliasColors": {},
+ "bars": false,
+ "dashLength": 10,
+ "dashes": false,
+ "datasource": "Prometheus",
+ "fill": 1,
+ "gridPos": {
+ "h": 9,
+ "w": 8,
+ "x": 8,
+ "y": 10
+ },
+ "id": 18,
+ "legend": {
+ "avg": false,
+ "current": false,
+ "hideEmpty": true,
+ "hideZero": true,
+ "max": false,
+ "min": false,
+ "show": true,
+ "total": false,
+ "values": false
+ },
+ "lines": true,
+ "linewidth": 1,
+ "links": [],
+ "nullPointMode": "null",
+ "percentage": false,
+ "pointradius": 5,
+ "points": false,
+ "renderer": "flot",
+ "seriesOverrides": [],
+ "spaceLength": 10,
+ "stack": false,
+ "steppedLine": false,
+ "targets": [
+ {
+ "expr":
"sum(increase(openwhisk_action_status{region=~\"$region\",stack=~\"$stack\",namespace=~\"$namespace\",action=~\"$action\",status=\"success\",initiator=~\"$initiator\"}[1m]))
by (action)",
+ "format": "time_series",
+ "instant": false,
+ "interval": "",
+ "intervalFactor": 1,
+ "legendFormat": "{{action}}",
+ "refId": "A"
+ }
+ ],
+ "thresholds": [],
+ "timeFrom": null,
+ "timeRegions": [],
+ "timeShift": null,
+ "title": "Activation success",
+ "tooltip": {
+ "shared": true,
+ "sort": 0,
+ "value_type": "individual"
+ },
+ "type": "graph",
+ "xaxis": {
+ "buckets": null,
+ "mode": "time",
+ "name": null,
+ "show": true,
+ "values": []
+ },
+ "yaxes": [
+ {
+ "decimals": 0,
+ "format": "short",
+ "label": "activations",
+ "logBase": 1,
+ "max": null,
+ "min": null,
+ "show": true
+ },
+ {
+ "format": "short",
+ "label": null,
+ "logBase": 1,
+ "max": null,
+ "min": null,
+ "show": true
+ }
+ ],
+ "yaxis": {
+ "align": false,
+ "alignLevel": null
+ }
+ },
+ {
+ "aliasColors": {},
+ "bars": false,
+ "dashLength": 10,
+ "dashes": false,
+ "datasource": "Prometheus",
+ "decimals": 1,
+ "fill": 1,
+ "gridPos": {
+ "h": 9,
+ "w": 8,
+ "x": 16,
+ "y": 10
+ },
+ "id": 20,
+ "legend": {
+ "avg": false,
+ "current": false,
+ "max": false,
+ "min": false,
+ "show": true,
+ "total": false,
+ "values": false
+ },
+ "lines": true,
+ "linewidth": 1,
+ "links": [],
+ "nullPointMode": "null",
+ "percentage": false,
+ "pointradius": 5,
+ "points": false,
+ "renderer": "flot",
+ "seriesOverrides": [],
+ "spaceLength": 10,
+ "stack": false,
+ "steppedLine": false,
+ "targets": [
+ {
+ "expr":
"sum(increase(openwhisk_action_status{region=~\"$region\",stack=~\"$stack\",namespace=~\"$namespace\",action=~\"$action\",status!=\"success\",initiator=~\"$initiator\"}[1m]))
by (action,status)",
+ "format": "time_series",
+ "instant": false,
+ "intervalFactor": 1,
+ "legendFormat": "{{action}}: {{status}}",
+ "refId": "A"
+ }
+ ],
+ "thresholds": [],
+ "timeFrom": null,
+ "timeRegions": [],
+ "timeShift": null,
+ "title": "Activation errors",
+ "tooltip": {
+ "shared": true,
+ "sort": 0,
+ "value_type": "individual"
+ },
+ "type": "graph",
+ "xaxis": {
+ "buckets": null,
+ "mode": "time",
+ "name": null,
+ "show": true,
+ "values": []
+ },
+ "yaxes": [
+ {
+ "decimals": 0,
+ "format": "short",
+ "label": "activations",
+ "logBase": 1,
+ "max": null,
+ "min": null,
+ "show": true
+ },
+ {
+ "format": "short",
+ "label": null,
+ "logBase": 1,
+ "max": null,
+ "min": null,
+ "show": true
+ }
+ ],
+ "yaxis": {
+ "align": false,
+ "alignLevel": null
+ }
+ },
+ {
+ "collapsed": false,
+ "gridPos": {
+ "h": 1,
+ "w": 24,
+ "x": 0,
+ "y": 19
+ },
+ "id": 12,
+ "panels": [],
+ "title": "Duration graph",
+ "type": "row"
+ },
+ {
+ "aliasColors": {},
+ "bars": false,
+ "dashLength": 10,
+ "dashes": false,
+ "datasource": "Prometheus",
+ "fill": 1,
+ "gridPos": {
+ "h": 8,
+ "w": 24,
+ "x": 0,
+ "y": 20
+ },
+ "id": 22,
+ "legend": {
+ "alignAsTable": false,
+ "avg": false,
+ "current": false,
+ "hideEmpty": true,
+ "hideZero": true,
+ "max": false,
+ "min": false,
+ "rightSide": false,
+ "show": true,
+ "total": false,
+ "values": false
+ },
+ "lines": true,
+ "linewidth": 1,
+ "links": [],
+ "minSpan": 6,
+ "nullPointMode": "null",
+ "percentage": false,
+ "pointradius": 5,
+ "points": false,
+ "renderer": "flot",
+ "repeat": null,
+ "repeatDirection": "h",
+ "seriesOverrides": [],
+ "spaceLength": 10,
+ "stack": false,
+ "steppedLine": false,
+ "targets": [
+ {
+ "expr":
"rate(openwhisk_action_duration_seconds_sum{region=~\"$region\",stack=~\"$stack\",namespace=~\"$namespace\",action=~\"$action\",initiator=~\"$initiator\"}[30s])
* 1000 /
rate(openwhisk_action_duration_seconds_count{region=~\"$region\",stack=~\"$stack\",namespace=~\"$namespace\",action=~\"$action\",initiator=~\"$initiator\"}[30s])
",
+ "format": "time_series",
+ "intervalFactor": 1,
+ "legendFormat": "{{action}}",
+ "refId": "A"
+ }
+ ],
+ "thresholds": [],
+ "timeFrom": null,
+ "timeRegions": [],
+ "timeShift": null,
+ "title": "Duration",
+ "tooltip": {
+ "shared": true,
+ "sort": 0,
+ "value_type": "individual"
+ },
+ "type": "graph",
+ "xaxis": {
+ "buckets": null,
+ "mode": "time",
+ "name": null,
+ "show": true,
+ "values": []
+ },
+ "yaxes": [
+ {
+ "decimals": 0,
+ "format": "ms",
+ "label": "",
+ "logBase": 1,
+ "max": null,
+ "min": null,
+ "show": true
+ },
+ {
+ "format": "short",
+ "label": null,
+ "logBase": 1,
+ "max": null,
+ "min": null,
+ "show": true
+ }
+ ],
+ "yaxis": {
+ "align": false,
+ "alignLevel": null
+ }
+ },
+ {
+ "collapsed": false,
+ "gridPos": {
+ "h": 1,
+ "w": 24,
+ "x": 0,
+ "y": 28
+ },
+ "id": 10,
+ "panels": [],
+ "title": "Init Time Graph",
+ "type": "row"
+ },
+ {
+ "aliasColors": {},
+ "bars": false,
+ "dashLength": 10,
+ "dashes": false,
+ "datasource": "Prometheus",
+ "fill": 1,
+ "gridPos": {
+ "h": 9,
+ "w": 24,
+ "x": 0,
+ "y": 29
+ },
+ "id": 24,
+ "legend": {
+ "avg": false,
+ "current": false,
+ "max": false,
+ "min": false,
+ "show": true,
+ "total": false,
+ "values": false
+ },
+ "lines": true,
+ "linewidth": 1,
+ "links": [],
+ "nullPointMode": "null",
+ "percentage": false,
+ "pointradius": 5,
+ "points": false,
+ "renderer": "flot",
+ "seriesOverrides": [],
+ "spaceLength": 10,
+ "stack": false,
+ "steppedLine": false,
+ "targets": [
+ {
+ "expr":
"rate(openwhisk_action_initTime_seconds_sum{region=~\"$region\",stack=~\"$stack\",namespace=~\"$namespace\",action=~\"$action\",initiator=~\"$initiator\"}[30s])
* 1000 /
rate(openwhisk_action_initTime_seconds_count{region=~\"$region\",stack=~\"$stack\",namespace=~\"$namespace\",action=~\"$action\",initiator=~\"$initiator\"}[30s])
",
+ "format": "time_series",
+ "instant": false,
+ "interval": "",
+ "intervalFactor": 1,
+ "legendFormat": "{{action}}",
+ "refId": "A"
+ }
+ ],
+ "thresholds": [],
+ "timeFrom": null,
+ "timeRegions": [],
+ "timeShift": null,
+ "title": "Initialization time",
+ "tooltip": {
+ "shared": true,
+ "sort": 0,
+ "value_type": "individual"
+ },
+ "type": "graph",
+ "xaxis": {
+ "buckets": null,
+ "mode": "time",
+ "name": null,
+ "show": true,
+ "values": []
+ },
+ "yaxes": [
+ {
+ "decimals": 0,
+ "format": "ms",
+ "label": "",
+ "logBase": 1,
+ "max": null,
+ "min": null,
+ "show": true
+ },
+ {
+ "format": "short",
+ "label": null,
+ "logBase": 1,
+ "max": null,
+ "min": null,
+ "show": true
+ }
+ ],
+ "yaxis": {
+ "align": false,
+ "alignLevel": null
+ }
+ },
+ {
+ "aliasColors": {},
+ "bars": false,
+ "dashLength": 10,
+ "dashes": false,
+ "datasource": "Prometheus",
+ "fill": 1,
+ "gridPos": {
+ "h": 9,
+ "w": 24,
+ "x": 0,
+ "y": 38
+ },
+ "id": 35,
+ "legend": {
+ "avg": false,
+ "current": false,
+ "max": false,
+ "min": false,
+ "show": true,
+ "total": false,
+ "values": false
+ },
+ "lines": true,
+ "linewidth": 1,
+ "links": [],
+ "nullPointMode": "null",
+ "percentage": false,
+ "pointradius": 5,
+ "points": false,
+ "renderer": "flot",
+ "seriesOverrides": [],
+ "spaceLength": 10,
+ "stack": false,
+ "steppedLine": false,
+ "targets": [
+ {
+ "expr":
"rate(openwhisk_action_waitTime_seconds_sum{region=~\"$region\",stack=~\"$stack\",namespace=~\"$namespace\",action=~\"$action\",initiator=~\"$initiator\"}[30s])
* 1000 /
rate(openwhisk_action_waitTime_seconds_count{region=~\"$region\",stack=~\"$stack\",namespace=~\"$namespace\",action=~\"$action\",initiator=~\"$initiator\"}[30s])
",
+ "format": "time_series",
+ "instant": false,
+ "interval": "",
+ "intervalFactor": 1,
+ "legendFormat": "{{action}}",
+ "refId": "A"
+ }
+ ],
+ "thresholds": [],
+ "timeFrom": null,
+ "timeRegions": [],
+ "timeShift": null,
+ "title": "Wait time",
+ "tooltip": {
+ "shared": true,
+ "sort": 0,
+ "value_type": "individual"
+ },
+ "type": "graph",
+ "xaxis": {
+ "buckets": null,
+ "mode": "time",
+ "name": null,
+ "show": true,
+ "values": []
+ },
+ "yaxes": [
+ {
+ "decimals": 0,
+ "format": "ms",
+ "label": "",
+ "logBase": 1,
+ "max": null,
+ "min": null,
+ "show": true
+ },
+ {
+ "format": "short",
+ "label": null,
+ "logBase": 1,
+ "max": null,
+ "min": null,
+ "show": true
+ }
+ ],
+ "yaxis": {
+ "align": false,
+ "alignLevel": null
+ }
+ }
+ ],
+ "refresh": "5s",
+ "schemaVersion": 16,
+ "style": "dark",
+ "tags": [],
+ "templating": {
+ "list": [
+ {
+ "allValue": "",
+ "current": {
+ "text": "All",
+ "value": "$__all"
+ },
+ "datasource": "Prometheus",
+ "definition":
"query_result(sum(increase(openwhisk_action_activations_total[$interval])) by
(region) > 0)",
+ "hide": 0,
+ "includeAll": true,
+ "label": null,
+ "multi": false,
+ "name": "region",
+ "options": [],
+ "query":
"query_result(sum(increase(openwhisk_action_activations_total[$interval])) by
(region) > 0)",
+ "refresh": 1,
+ "regex": "/.*region=\"(.*)\".*/",
+ "skipUrlSync": false,
+ "sort": 2,
+ "tagValuesQuery": "",
+ "tags": [],
+ "tagsQuery": "",
+ "type": "query",
+ "useTags": false
+ },
+ {
+ "allValue": "",
+ "current": {
+ "text": "All",
+ "value": "$__all"
+ },
+ "datasource": "Prometheus",
+ "definition":
"query_result(sum(increase(openwhisk_action_activations_total[$interval])) by
(stack) > 0)",
+ "hide": 0,
+ "includeAll": true,
+ "label": null,
+ "multi": false,
+ "name": "stack",
+ "options": [],
+ "query":
"query_result(sum(increase(openwhisk_action_activations_total[$interval])) by
(stack) > 0)",
+ "refresh": 1,
+ "regex": "/.*stack=\"(.*)\".*/",
+ "skipUrlSync": false,
+ "sort": 1,
+ "tagValuesQuery": "",
+ "tags": [],
+ "tagsQuery": "",
+ "type": "query",
+ "useTags": false
+ },
+ {
+ "allValue": null,
+ "current": {
+ "text": "14257_51772",
+ "value": "14257_51772"
+ },
+ "datasource": "Prometheus",
+ "definition":
"query_result(sum(increase(openwhisk_action_activations_total{namespace=~\"$namespace\"}[$interval]))
by (initiator) > 0)",
+ "hide": 0,
+ "includeAll": true,
+ "label": null,
+ "multi": false,
+ "name": "initiator",
+ "options": [],
+ "query":
"query_result(sum(increase(openwhisk_action_activations_total{namespace=~\"$namespace\"}[$interval]))
by (initiator) > 0)",
+ "refresh": 1,
+ "regex": "/.*initiator=\"(.*)\".*/",
+ "skipUrlSync": false,
+ "sort": 1,
+ "tagValuesQuery": "",
+ "tags": [],
+ "tagsQuery": "",
+ "type": "query",
+ "useTags": false
+ },
+ {
+ "allValue": null,
+ "current": {
+ "text": "14257_51772",
+ "value": "14257_51772"
+ },
+ "datasource": "Prometheus",
+ "definition":
"query_result(sum(increase(openwhisk_action_activations_total[$interval])) by
(namespace))",
+ "hide": 0,
+ "includeAll": false,
+ "label": null,
+ "multi": false,
+ "name": "namespace",
+ "options": [],
+ "query":
"query_result(sum(increase(openwhisk_action_activations_total[$interval])) by
(namespace))",
+ "refresh": 1,
+ "regex": "/.*namespace=\"(.*)\".*/",
+ "skipUrlSync": false,
+ "sort": 1,
+ "tagValuesQuery": "",
+ "tags": [],
+ "tagsQuery": "",
+ "type": "query",
+ "useTags": false
+ },
+ {
+ "allValue": "",
+ "current": {
+ "text": "All",
+ "value": "$__all"
+ },
+ "datasource": "Prometheus",
+ "definition":
"query_result(sum(increase(openwhisk_action_activations_total{namespace=~\"$namespace\"}[$interval]))
by (action) > 0)",
+ "hide": 0,
+ "includeAll": true,
+ "label": null,
+ "multi": false,
+ "name": "action",
+ "options": [],
+ "query":
"query_result(sum(increase(openwhisk_action_activations_total{namespace=~\"$namespace\"}[$interval]))
by (action) > 0)",
+ "refresh": 1,
+ "regex": "/.*action=\"(.*)\".*/",
+ "skipUrlSync": false,
+ "sort": 1,
+ "tagValuesQuery": "",
+ "tags": [],
+ "tagsQuery": "",
+ "type": "query",
+ "useTags": false
+ },
+ {
+ "auto": true,
+ "auto_count": 1,
+ "auto_min": "1m",
+ "current": {
+ "text": "auto",
+ "value": "$__auto_interval_interval"
+ },
+ "hide": 2,
+ "label": null,
+ "name": "interval",
+ "options": [
+ {
+ "selected": true,
+ "text": "auto",
+ "value": "$__auto_interval_interval"
+ },
+ {
+ "selected": false,
+ "text": "1m",
+ "value": "1m"
+ },
+ {
+ "selected": false,
+ "text": "10m",
+ "value": "10m"
+ },
+ {
+ "selected": false,
+ "text": "30m",
+ "value": "30m"
+ },
+ {
+ "selected": false,
+ "text": "1h",
+ "value": "1h"
+ },
+ {
+ "selected": false,
+ "text": "6h",
+ "value": "6h"
+ },
+ {
+ "selected": false,
+ "text": "12h",
+ "value": "12h"
+ },
+ {
+ "selected": false,
+ "text": "1d",
+ "value": "1d"
+ },
+ {
+ "selected": false,
+ "text": "7d",
+ "value": "7d"
+ },
+ {
+ "selected": false,
+ "text": "14d",
+ "value": "14d"
+ },
+ {
+ "selected": false,
+ "text": "30d",
+ "value": "30d"
+ }
+ ],
+ "query": "1m,10m,30m,1h,6h,12h,1d,7d,14d,30d",
+ "refresh": 2,
+ "skipUrlSync": false,
+ "type": "interval"
+ }
+ ]
+ },
+ "time": {
+ "from": "now-15m",
+ "to": "now"
+ },
+ "tags": [
+ "openwhisk"
+ ],
+ "timepicker": {
+ "refresh_intervals": [
+ "5s",
+ "10s",
+ "30s",
+ "1m",
+ "5m",
+ "15m",
+ "30m",
+ "1h",
+ "2h",
+ "1d"
+ ],
+ "time_options": [
+ "5m",
+ "15m",
+ "1h",
+ "6h",
+ "12h",
+ "24h",
+ "2d",
+ "7d",
+ "30d"
+ ]
+ },
+ "timezone": "",
+ "title": "Openwhisk - Action Performance Metrics",
+ "uid": "Oew1lvymk",
+ "version": 1
+}
\ No newline at end of file
diff --git
a/core/monitoring/user-events/compose/grafana/dashboards/top-namespaces.json
b/core/monitoring/user-events/compose/grafana/dashboards/top-namespaces.json
new file mode 100644
index 0000000..e00db15
--- /dev/null
+++ b/core/monitoring/user-events/compose/grafana/dashboards/top-namespaces.json
@@ -0,0 +1,473 @@
+{
+ "__inputs": [
+ {
+ "name": "DS_PROMETHEUS",
+ "label": "Prometheus",
+ "description": "",
+ "type": "datasource",
+ "pluginId": "prometheus",
+ "pluginName": "Prometheus"
+ }
+ ],
+ "__requires": [
+ {
+ "type": "grafana",
+ "id": "grafana",
+ "name": "Grafana",
+ "version": "6.1.6"
+ },
+ {
+ "type": "datasource",
+ "id": "prometheus",
+ "name": "Prometheus",
+ "version": "1.0.0"
+ },
+ {
+ "type": "panel",
+ "id": "table",
+ "name": "Table",
+ "version": ""
+ }
+ ],
+ "annotations": {
+ "list": [
+ {
+ "builtIn": 1,
+ "datasource": "-- Grafana --",
+ "enable": true,
+ "hide": true,
+ "iconColor": "rgba(0, 211, 255, 1)",
+ "name": "Annotations & Alerts",
+ "type": "dashboard"
+ }
+ ]
+ },
+ "editable": true,
+ "gnetId": null,
+ "graphTooltip": 0,
+ "id": null,
+ "links": [],
+ "panels": [
+ {
+ "columns": [],
+ "datasource": "Prometheus",
+ "description": "Top namespaces by activation count",
+ "fontSize": "100%",
+ "gridPos": {
+ "h": 10,
+ "w": 12,
+ "x": 0,
+ "y": 0
+ },
+ "id": 2,
+ "links": [],
+ "pageSize": null,
+ "scroll": true,
+ "showHeader": true,
+ "sort": {
+ "col": 0,
+ "desc": false
+ },
+ "styles": [
+ {
+ "alias": "Time",
+ "dateFormat": "YYYY-MM-DD HH:mm:ss",
+ "pattern": "Time",
+ "type": "hidden"
+ },
+ {
+ "alias": "Namespace",
+ "colorMode": null,
+ "colors": [
+ "rgba(245, 54, 54, 0.9)",
+ "rgba(237, 129, 40, 0.89)",
+ "rgba(50, 172, 45, 0.97)"
+ ],
+ "dateFormat": "YYYY-MM-DD HH:mm:ss",
+ "decimals": 2,
+ "link": true,
+ "linkTargetBlank": false,
+ "linkTooltip": "Metrics related to ${__cell}",
+ "linkUrl":
"d/Oew1lvymk/openwhisk-action-performance-metrics?var-namespace=${__cell}&from=${__from}&to=${__to}",
+ "mappingType": 1,
+ "pattern": "namespace",
+ "thresholds": [],
+ "type": "string",
+ "unit": "short"
+ },
+ {
+ "alias": "Activation Count",
+ "colorMode": null,
+ "colors": [
+ "rgba(245, 54, 54, 0.9)",
+ "rgba(237, 129, 40, 0.89)",
+ "rgba(50, 172, 45, 0.97)"
+ ],
+ "dateFormat": "YYYY-MM-DD HH:mm:ss",
+ "decimals": 2,
+ "mappingType": 1,
+ "pattern": "Value",
+ "thresholds": [],
+ "type": "number",
+ "unit": "short"
+ },
+ {
+ "alias": "",
+ "colorMode": null,
+ "colors": [
+ "rgba(245, 54, 54, 0.9)",
+ "rgba(237, 129, 40, 0.89)",
+ "rgba(50, 172, 45, 0.97)"
+ ],
+ "decimals": 2,
+ "pattern": "/.*/",
+ "thresholds": [],
+ "type": "number",
+ "unit": "short"
+ }
+ ],
+ "targets": [
+ {
+ "expr": "topk(10, sum
by(namespace)(increase(openwhisk_action_activations_total[${__range_s}s])))",
+ "format": "table",
+ "hide": false,
+ "instant": true,
+ "intervalFactor": 1,
+ "refId": "A"
+ }
+ ],
+ "title": "Top Namespaces",
+ "transform": "table",
+ "type": "table"
+ },
+ {
+ "columns": [],
+ "datasource": "Prometheus",
+ "description": "Top memory sizes specified (in MB)",
+ "fontSize": "100%",
+ "gridPos": {
+ "h": 10,
+ "w": 5,
+ "x": 12,
+ "y": 0
+ },
+ "id": 4,
+ "links": [],
+ "pageSize": null,
+ "scroll": true,
+ "showHeader": true,
+ "sort": {
+ "col": 0,
+ "desc": false
+ },
+ "styles": [
+ {
+ "alias": "Time",
+ "dateFormat": "YYYY-MM-DD HH:mm:ss",
+ "pattern": "Time",
+ "type": "hidden"
+ },
+ {
+ "alias": "Namespace",
+ "colorMode": null,
+ "colors": [
+ "rgba(245, 54, 54, 0.9)",
+ "rgba(237, 129, 40, 0.89)",
+ "rgba(50, 172, 45, 0.97)"
+ ],
+ "dateFormat": "YYYY-MM-DD HH:mm:ss",
+ "decimals": 2,
+ "link": true,
+ "linkTargetBlank": false,
+ "linkUrl":
"d/Oew1lvymk/openwhisk-action-performance-metrics?var-namespace=${__cell}",
+ "mappingType": 1,
+ "pattern": "namespace",
+ "thresholds": [],
+ "type": "string",
+ "unit": "short"
+ },
+ {
+ "alias": "Activation Count",
+ "colorMode": null,
+ "colors": [
+ "rgba(245, 54, 54, 0.9)",
+ "rgba(237, 129, 40, 0.89)",
+ "rgba(50, 172, 45, 0.97)"
+ ],
+ "dateFormat": "YYYY-MM-DD HH:mm:ss",
+ "decimals": 2,
+ "mappingType": 1,
+ "pattern": "Value",
+ "thresholds": [],
+ "type": "number",
+ "unit": "short"
+ },
+ {
+ "alias": "",
+ "colorMode": null,
+ "colors": [
+ "rgba(245, 54, 54, 0.9)",
+ "rgba(237, 129, 40, 0.89)",
+ "rgba(50, 172, 45, 0.97)"
+ ],
+ "decimals": 2,
+ "pattern": "/.*/",
+ "thresholds": [],
+ "type": "number",
+ "unit": "short"
+ }
+ ],
+ "targets": [
+ {
+ "expr": "topk(10, sum
by(memory)(increase(openwhisk_action_activations_total[${__range_s}s])))",
+ "format": "table",
+ "hide": false,
+ "instant": true,
+ "intervalFactor": 1,
+ "refId": "A"
+ }
+ ],
+ "title": "Memory",
+ "transform": "table",
+ "type": "table"
+ },
+ {
+ "columns": [],
+ "datasource": "Prometheus",
+ "description": "Top activation 'kind'",
+ "fontSize": "100%",
+ "gridPos": {
+ "h": 10,
+ "w": 5,
+ "x": 17,
+ "y": 0
+ },
+ "id": 5,
+ "links": [],
+ "pageSize": null,
+ "scroll": true,
+ "showHeader": true,
+ "sort": {
+ "col": 0,
+ "desc": false
+ },
+ "styles": [
+ {
+ "alias": "Time",
+ "dateFormat": "YYYY-MM-DD HH:mm:ss",
+ "pattern": "Time",
+ "type": "hidden"
+ },
+ {
+ "alias": "Namespace",
+ "colorMode": null,
+ "colors": [
+ "rgba(245, 54, 54, 0.9)",
+ "rgba(237, 129, 40, 0.89)",
+ "rgba(50, 172, 45, 0.97)"
+ ],
+ "dateFormat": "YYYY-MM-DD HH:mm:ss",
+ "decimals": 2,
+ "link": true,
+ "linkTargetBlank": false,
+ "linkUrl":
"d/Oew1lvymk/openwhisk-action-performance-metrics?var-namespace=${__cell}",
+ "mappingType": 1,
+ "pattern": "namespace",
+ "thresholds": [],
+ "type": "string",
+ "unit": "short"
+ },
+ {
+ "alias": "Activation Count",
+ "colorMode": null,
+ "colors": [
+ "rgba(245, 54, 54, 0.9)",
+ "rgba(237, 129, 40, 0.89)",
+ "rgba(50, 172, 45, 0.97)"
+ ],
+ "dateFormat": "YYYY-MM-DD HH:mm:ss",
+ "decimals": 2,
+ "mappingType": 1,
+ "pattern": "Value",
+ "thresholds": [],
+ "type": "number",
+ "unit": "short"
+ },
+ {
+ "alias": "",
+ "colorMode": null,
+ "colors": [
+ "rgba(245, 54, 54, 0.9)",
+ "rgba(237, 129, 40, 0.89)",
+ "rgba(50, 172, 45, 0.97)"
+ ],
+ "decimals": 2,
+ "pattern": "/.*/",
+ "thresholds": [],
+ "type": "number",
+ "unit": "short"
+ }
+ ],
+ "targets": [
+ {
+ "expr": "topk(10, sum
by(kind)(increase(openwhisk_action_activations_total[${__range_s}s])))",
+ "format": "table",
+ "hide": false,
+ "instant": true,
+ "intervalFactor": 1,
+ "refId": "A"
+ }
+ ],
+ "title": "Kind",
+ "transform": "table",
+ "type": "table"
+ },
+ {
+ "columns": [],
+ "datasource": "Prometheus",
+ "fontSize": "100%",
+ "gridPos": {
+ "h": 8,
+ "w": 22,
+ "x": 0,
+ "y": 10
+ },
+ "id": 3,
+ "links": [],
+ "pageSize": null,
+ "scroll": true,
+ "showHeader": true,
+ "sort": {
+ "col": 0,
+ "desc": false
+ },
+ "styles": [
+ {
+ "alias": "Time",
+ "dateFormat": "YYYY-MM-DD HH:mm:ss",
+ "pattern": "Time",
+ "type": "hidden"
+ },
+ {
+ "alias": "Namespace",
+ "colorMode": null,
+ "colors": [
+ "rgba(245, 54, 54, 0.9)",
+ "rgba(237, 129, 40, 0.89)",
+ "rgba(50, 172, 45, 0.97)"
+ ],
+ "dateFormat": "YYYY-MM-DD HH:mm:ss",
+ "decimals": 2,
+ "mappingType": 1,
+ "pattern": "namespace",
+ "thresholds": [],
+ "type": "string",
+ "unit": "short"
+ },
+ {
+ "alias": "Action",
+ "colorMode": null,
+ "colors": [
+ "rgba(245, 54, 54, 0.9)",
+ "rgba(237, 129, 40, 0.89)",
+ "rgba(50, 172, 45, 0.97)"
+ ],
+ "dateFormat": "YYYY-MM-DD HH:mm:ss",
+ "decimals": 2,
+ "link": true,
+ "linkTooltip": "Action ${__cell} details",
+ "linkUrl":
"d/Oew1lvymk/openwhisk-action-performance-metrics?var-namespace=${__cell_2}&var-action=${__cell}&from=${__from}&to=${__to}",
+ "mappingType": 1,
+ "pattern": "action",
+ "thresholds": [],
+ "type": "string",
+ "unit": "short"
+ },
+ {
+ "alias": "Activation Count",
+ "colorMode": null,
+ "colors": [
+ "rgba(245, 54, 54, 0.9)",
+ "rgba(237, 129, 40, 0.89)",
+ "rgba(50, 172, 45, 0.97)"
+ ],
+ "dateFormat": "YYYY-MM-DD HH:mm:ss",
+ "decimals": 2,
+ "mappingType": 1,
+ "pattern": "Value",
+ "thresholds": [],
+ "type": "number",
+ "unit": "short"
+ },
+ {
+ "alias": "",
+ "colorMode": null,
+ "colors": [
+ "rgba(245, 54, 54, 0.9)",
+ "rgba(237, 129, 40, 0.89)",
+ "rgba(50, 172, 45, 0.97)"
+ ],
+ "decimals": 2,
+ "pattern": "/.*/",
+ "thresholds": [],
+ "type": "number",
+ "unit": "short"
+ }
+ ],
+ "targets": [
+ {
+ "expr": "topk(10, sum
by(namespace,action,kind,memory)(increase(openwhisk_action_activations_total[${__range_s}s])))",
+ "format": "table",
+ "hide": false,
+ "instant": true,
+ "intervalFactor": 1,
+ "refId": "A"
+ }
+ ],
+ "title": "Top Actions",
+ "transform": "table",
+ "type": "table"
+ }
+ ],
+ "schemaVersion": 18,
+ "style": "dark",
+ "tags": [
+ "openwhisk"
+ ],
+ "templating": {
+ "list": []
+ },
+ "time": {
+ "from": "now-15m",
+ "to": "now"
+ },
+ "timepicker": {
+ "refresh_intervals": [
+ "5s",
+ "10s",
+ "30s",
+ "1m",
+ "5m",
+ "15m",
+ "30m",
+ "1h",
+ "2h",
+ "1d"
+ ],
+ "time_options": [
+ "5m",
+ "15m",
+ "1h",
+ "6h",
+ "12h",
+ "24h",
+ "2d",
+ "7d",
+ "30d"
+ ]
+ },
+ "timezone": "",
+ "title": "OpenWhisk - Top Namespaces",
+ "uid": "RnvlchiZk",
+ "version": 1
+}
\ No newline at end of file
diff --git
a/core/monitoring/user-events/compose/grafana/provisioning/dashboards/dashboard.yml
b/core/monitoring/user-events/compose/grafana/provisioning/dashboards/dashboard.yml
new file mode 100644
index 0000000..a6ea486
--- /dev/null
+++
b/core/monitoring/user-events/compose/grafana/provisioning/dashboards/dashboard.yml
@@ -0,0 +1,28 @@
+#
+# Licensed to the Apache Software Foundation (ASF) under one or more
+# contributor license agreements. See the NOTICE file distributed with
+# this work for additional information regarding copyright ownership.
+# The ASF licenses this file to You under the Apache License, Version 2.0
+# (the "License"); you may not use this file except in compliance with
+# the License. You may obtain a copy of the License at
+#
+# http://www.apache.org/licenses/LICENSE-2.0
+#
+# Unless required by applicable law or agreed to in writing, software
+# distributed under the License is distributed on an "AS IS" BASIS,
+# WITHOUT WARRANTIES OR CONDITIONS OF ANY KIND, either express or implied.
+# See the License for the specific language governing permissions and
+# limitations under the License.
+#
+
+apiVersion: 1
+
+providers:
+- name: 'Prometheus'
+ orgId: 1
+ folder: ''
+ type: file
+ disableDeletion: false
+ editable: true
+ options:
+ path: /var/lib/grafana/dashboards
diff --git
a/core/monitoring/user-events/compose/grafana/provisioning/datasources/datasource.yml
b/core/monitoring/user-events/compose/grafana/provisioning/datasources/datasource.yml
new file mode 100644
index 0000000..b67b13d
--- /dev/null
+++
b/core/monitoring/user-events/compose/grafana/provisioning/datasources/datasource.yml
@@ -0,0 +1,67 @@
+#
+# Licensed to the Apache Software Foundation (ASF) under one or more
+# contributor license agreements. See the NOTICE file distributed with
+# this work for additional information regarding copyright ownership.
+# The ASF licenses this file to You under the Apache License, Version 2.0
+# (the "License"); you may not use this file except in compliance with
+# the License. You may obtain a copy of the License at
+#
+# http://www.apache.org/licenses/LICENSE-2.0
+#
+# Unless required by applicable law or agreed to in writing, software
+# distributed under the License is distributed on an "AS IS" BASIS,
+# WITHOUT WARRANTIES OR CONDITIONS OF ANY KIND, either express or implied.
+# See the License for the specific language governing permissions and
+# limitations under the License.
+#
+
+# config file version
+apiVersion: 1
+
+# list of datasources that should be deleted from the database
+deleteDatasources:
+ - name: Prometheus
+ orgId: 1
+
+# list of datasources to insert/update depending
+# whats available in the database
+datasources:
+ # <string, required> name of the datasource. Required
+- name: Prometheus
+ # <string, required> datasource type. Required
+ type: prometheus
+ # <string, required> access mode. direct or proxy. Required
+ access: proxy
+ # <int> org id. will default to orgId 1 if not specified
+ orgId: 1
+ # <string> url
+ url: http://prometheus:9090
+ # <string> database password, if used
+ password:
+ # <string> database user, if used
+ user:
+ # <string> database name, if used
+ database:
+ # <bool> enable/disable basic auth
+ basicAuth: true
+ # <string> basic auth username
+ basicAuthUser: admin
+ # <string> basic auth password
+ basicAuthPassword: foobar
+ # <bool> enable/disable with credentials headers
+ withCredentials:
+ # <bool> mark as default datasource. Max one per org
+ isDefault: true
+ # <map> fields that will be converted to json and stored in json_data
+ jsonData:
+ graphiteVersion: "1.1"
+ tlsAuth: false
+ tlsAuthWithCACert: false
+ # <string> json object of data that will be encrypted.
+ secureJsonData:
+ tlsCACert: "..."
+ tlsClientCert: "..."
+ tlsClientKey: "..."
+ version: 1
+ # <bool> allow users to edit datasources from the UI.
+ editable: true
diff --git a/core/monitoring/user-events/compose/prometheus/prometheus.yml
b/core/monitoring/user-events/compose/prometheus/prometheus.yml
new file mode 100644
index 0000000..453ab57
--- /dev/null
+++ b/core/monitoring/user-events/compose/prometheus/prometheus.yml
@@ -0,0 +1,30 @@
+#
+# Licensed to the Apache Software Foundation (ASF) under one or more
+# contributor license agreements. See the NOTICE file distributed with
+# this work for additional information regarding copyright ownership.
+# The ASF licenses this file to You under the Apache License, Version 2.0
+# (the "License"); you may not use this file except in compliance with
+# the License. You may obtain a copy of the License at
+#
+# http://www.apache.org/licenses/LICENSE-2.0
+#
+# Unless required by applicable law or agreed to in writing, software
+# distributed under the License is distributed on an "AS IS" BASIS,
+# WITHOUT WARRANTIES OR CONDITIONS OF ANY KIND, either express or implied.
+# See the License for the specific language governing permissions and
+# limitations under the License.
+#
+
+global:
+ scrape_interval: 10s
+ evaluation_interval: 10s
+
+scrape_configs:
+ - job_name: 'prometheus-server'
+ static_configs:
+ - targets: ['localhost:9090']
+
+ - job_name: 'openwhisk-metrics'
+ static_configs:
+ - targets: ['user-events:9095']
+
diff --git a/core/monitoring/user-events/images/demo_landing.png
b/core/monitoring/user-events/images/demo_landing.png
new file mode 100644
index 0000000..9cfcf23
Binary files /dev/null and
b/core/monitoring/user-events/images/demo_landing.png differ
diff --git a/core/monitoring/user-events/init.sh
b/core/monitoring/user-events/init.sh
new file mode 100644
index 0000000..9da8864
--- /dev/null
+++ b/core/monitoring/user-events/init.sh
@@ -0,0 +1,25 @@
+#!/bin/bash
+
+#
+# Licensed to the Apache Software Foundation (ASF) under one or more
+# contributor license agreements. See the NOTICE file distributed with
+# this work for additional information regarding copyright ownership.
+# The ASF licenses this file to You under the Apache License, Version 2.0
+# (the "License"); you may not use this file except in compliance with
+# the License. You may obtain a copy of the License at
+#
+# http://www.apache.org/licenses/LICENSE-2.0
+#
+# Unless required by applicable law or agreed to in writing, software
+# distributed under the License is distributed on an "AS IS" BASIS,
+# WITHOUT WARRANTIES OR CONDITIONS OF ANY KIND, either express or implied.
+# See the License for the specific language governing permissions and
+# limitations under the License.
+#
+
+./copyJMXFiles.sh
+
+export CACHE_INVALIDATOR_OPTS
+CACHE_INVALIDATOR_OPTS="$CACHE_INVALIDATOR_OPTS $(./transformEnvironment.sh)"
+
+exec user-events/bin/user-events "$@"
diff --git a/core/monitoring/user-events/src/main/resources/application.conf
b/core/monitoring/user-events/src/main/resources/application.conf
new file mode 100644
index 0000000..8c8cd3e
--- /dev/null
+++ b/core/monitoring/user-events/src/main/resources/application.conf
@@ -0,0 +1,52 @@
+#
+# Licensed to the Apache Software Foundation (ASF) under one or more
+# contributor license agreements. See the NOTICE file distributed with
+# this work for additional information regarding copyright ownership.
+# The ASF licenses this file to You under the Apache License, Version 2.0
+# (the "License"); you may not use this file except in compliance with
+# the License. You may obtain a copy of the License at
+#
+# http://www.apache.org/licenses/LICENSE-2.0
+#
+# Unless required by applicable law or agreed to in writing, software
+# distributed under the License is distributed on an "AS IS" BASIS,
+# WITHOUT WARRANTIES OR CONDITIONS OF ANY KIND, either express or implied.
+# See the License for the specific language governing permissions and
+# limitations under the License.
+#
+
+akka.kafka.consumer {
+ # Properties defined by org.apache.kafka.clients.consumer.ConsumerConfig
+ # can be defined in this configuration section.
+ kafka-clients {
+ group.id = "kamon"
+
+ auto.offset.reset = "earliest"
+
+ # Disable auto-commit by default
+ enable.auto.commit = false
+
+ bootstrap.servers = ${?KAFKA_HOSTS}
+ }
+}
+
+kamon {
+ metric {
+ tick-interval = 15 seconds
+ }
+ prometheus {
+ # We expose the metrics endpoint over akka http. So default server is
disabled
+ start-embedded-http-server = no
+ }
+
+ system-metrics {
+ # disable the host metrics as we are only interested in JVM metrics
+ host.enabled = false
+ }
+
+ environment {
+ # Identifier for this service. For keeping it backward compatible setting
to natch previous
+ # statsd name
+ service = "user-events"
+ }
+}
diff --git a/core/monitoring/user-events/src/main/resources/reference.conf
b/core/monitoring/user-events/src/main/resources/reference.conf
new file mode 100644
index 0000000..6f7d1c2
--- /dev/null
+++ b/core/monitoring/user-events/src/main/resources/reference.conf
@@ -0,0 +1,27 @@
+#
+# Licensed to the Apache Software Foundation (ASF) under one or more
+# contributor license agreements. See the NOTICE file distributed with
+# this work for additional information regarding copyright ownership.
+# The ASF licenses this file to You under the Apache License, Version 2.0
+# (the "License"); you may not use this file except in compliance with
+# the License. You may obtain a copy of the License at
+#
+# http://www.apache.org/licenses/LICENSE-2.0
+#
+# Unless required by applicable law or agreed to in writing, software
+# distributed under the License is distributed on an "AS IS" BASIS,
+# WITHOUT WARRANTIES OR CONDITIONS OF ANY KIND, either express or implied.
+# See the License for the specific language governing permissions and
+# limitations under the License.
+#
+
+whisk {
+ user-events {
+ # Server port
+ port = 9095
+
+ # Enables KamonRecorder so as to enable sending metrics to Kamon supported
backends
+ # like DataDog
+ enable-kamon = false
+ }
+}
diff --git a/core/monitoring/user-events/src/main/resources/whisk-logback.xml
b/core/monitoring/user-events/src/main/resources/whisk-logback.xml
new file mode 100644
index 0000000..983f5ef
--- /dev/null
+++ b/core/monitoring/user-events/src/main/resources/whisk-logback.xml
@@ -0,0 +1,25 @@
+<!--
+ ~ Licensed to the Apache Software Foundation (ASF) under one or more
+ ~ contributor license agreements. See the NOTICE file distributed with
+ ~ this work for additional information regarding copyright ownership.
+ ~ The ASF licenses this file to You under the Apache License, Version 2.0
+ ~ (the "License"); you may not use this file except in compliance with
+ ~ the License. You may obtain a copy of the License at
+ ~
+ ~ http://www.apache.org/licenses/LICENSE-2.0
+ ~
+ ~ Unless required by applicable law or agreed to in writing, software
+ ~ distributed under the License is distributed on an "AS IS" BASIS,
+ ~ WITHOUT WARRANTIES OR CONDITIONS OF ANY KIND, either express or implied.
+ ~ See the License for the specific language governing permissions and
+ ~ limitations under the License.
+ -->
+
+<included>
+ <contextListener class="ch.qos.logback.classic.jul.LevelChangePropagator">
+ <resetJUL>true</resetJUL>
+ </contextListener>
+
+ <!-- Kafka -->
+ <logger name="org.apache.kafka" level="ERROR" />
+</included>
\ No newline at end of file
diff --git
a/core/monitoring/user-events/src/main/scala/org/apache/openwhisk/core/monitoring/metrics/EventConsumer.scala
b/core/monitoring/user-events/src/main/scala/org/apache/openwhisk/core/monitoring/metrics/EventConsumer.scala
new file mode 100644
index 0000000..7b8c594
--- /dev/null
+++
b/core/monitoring/user-events/src/main/scala/org/apache/openwhisk/core/monitoring/metrics/EventConsumer.scala
@@ -0,0 +1,145 @@
+/*
+ * Licensed to the Apache Software Foundation (ASF) under one or more
+ * contributor license agreements. See the NOTICE file distributed with
+ * this work for additional information regarding copyright ownership.
+ * The ASF licenses this file to You under the Apache License, Version 2.0
+ * (the "License"); you may not use this file except in compliance with
+ * the License. You may obtain a copy of the License at
+ *
+ * http://www.apache.org/licenses/LICENSE-2.0
+ *
+ * Unless required by applicable law or agreed to in writing, software
+ * distributed under the License is distributed on an "AS IS" BASIS,
+ * WITHOUT WARRANTIES OR CONDITIONS OF ANY KIND, either express or implied.
+ * See the License for the specific language governing permissions and
+ * limitations under the License.
+ */
+
+package org.apache.openwhisk.core.monitoring.metrics
+
+import java.lang.management.ManagementFactory
+
+import akka.Done
+import akka.actor.ActorSystem
+import akka.kafka.ConsumerMessage.CommittableOffsetBatch
+import akka.kafka.scaladsl.Consumer
+import akka.kafka.scaladsl.Consumer.DrainingControl
+import akka.kafka.{ConsumerSettings, Subscriptions}
+import akka.stream.ActorMaterializer
+import akka.stream.scaladsl.{Keep, Sink}
+import javax.management.ObjectName
+import org.apache.kafka.clients.consumer.ConsumerConfig
+import kamon.Kamon
+import kamon.metric.MeasurementUnit
+
+import scala.concurrent.{ExecutionContext, Future}
+import scala.concurrent.duration._
+import org.apache.openwhisk.core.connector.{Activation, EventMessage, Metric}
+import org.apache.openwhisk.core.entity.ActivationResponse
+
+trait MetricRecorder {
+ def processActivation(activation: Activation, initiatorNamespace: String):
Unit
+ def processMetric(metric: Metric, initiatorNamespace: String): Unit
+}
+
+case class EventConsumer(settings: ConsumerSettings[String, String],
recorders: Seq[MetricRecorder])(
+ implicit system: ActorSystem,
+ materializer: ActorMaterializer) {
+ import EventConsumer._
+
+ private implicit val ec: ExecutionContext = system.dispatcher
+
+ //Record the rate of events received
+ private val activationCounter =
Kamon.counter("openwhisk.userevents.global.activations")
+ private val metricCounter =
Kamon.counter("openwhisk.userevents.global.metric")
+
+ private val statusCounter =
Kamon.counter("openwhisk.userevents.global.status")
+ private val coldStartCounter =
Kamon.counter("openwhisk.userevents.global.coldStarts")
+
+ private val statusSuccess = statusCounter.refine("status" ->
ActivationResponse.statusSuccess)
+ private val statusFailure = statusCounter.refine("status" -> "failure")
+ private val statusApplicationError = statusCounter.refine("status" ->
ActivationResponse.statusApplicationError)
+ private val statusDeveloperError = statusCounter.refine("status" ->
ActivationResponse.statusDeveloperError)
+ private val statusInternalError = statusCounter.refine("status" ->
ActivationResponse.statusWhiskError)
+
+ private val waitTime =
Kamon.histogram("openwhisk.userevents.global.waitTime",
MeasurementUnit.time.milliseconds)
+ private val initTime =
Kamon.histogram("openwhisk.userevents.global.initTime",
MeasurementUnit.time.milliseconds)
+ private val duration =
Kamon.histogram("openwhisk.userevents.global.duration",
MeasurementUnit.time.milliseconds)
+
+ private val lagGauge = Kamon.gauge("openwhisk.userevents.consumer.lag")
+
+ def shutdown(): Future[Done] = {
+ lagRecorder.cancel()
+ control.drainAndShutdown()(system.dispatcher)
+ }
+
+ def isRunning: Boolean = !control.isShutdown.isCompleted
+
+ //TODO Use RestartSource
+ private val control: DrainingControl[Done] = Consumer
+ .committableSource(updatedSettings, Subscriptions.topics(userEventTopic))
+ .map { msg =>
+ processEvent(msg.record.value())
+ msg.committableOffset
+ }
+ .batch(max = 20, CommittableOffsetBatch(_))(_.updated(_))
+ .mapAsync(3)(_.commitScaladsl())
+ .toMat(Sink.ignore)(Keep.both)
+ .mapMaterializedValue(DrainingControl.apply)
+ .run()
+
+ private val lagRecorder =
+ system.scheduler.schedule(10.seconds,
10.seconds)(lagGauge.set(consumerLag))
+
+ private def processEvent(value: String): Unit = {
+ EventMessage
+ .parse(value)
+ .map { e =>
+ e.eventType match {
+ case Activation.typeName => activationCounter.increment()
+ case Metric.typeName => metricCounter.increment()
+ }
+ e
+ }
+ .foreach { e =>
+ e.body match {
+ case a: Activation =>
+ recorders.foreach(_.processActivation(a, e.namespace))
+ updateGlobalMetrics(a)
+ case m: Metric =>
+ recorders.foreach(_.processMetric(m, e.namespace))
+ }
+ }
+ }
+
+ private def updateGlobalMetrics(a: Activation): Unit = {
+ a.status match {
+ case ActivationResponse.statusSuccess =>
statusSuccess.increment()
+ case ActivationResponse.statusApplicationError =>
statusApplicationError.increment()
+ case ActivationResponse.statusDeveloperError =>
statusDeveloperError.increment()
+ case ActivationResponse.statusWhiskError =>
statusInternalError.increment()
+ case _ => //Ignore for now
+ }
+
+ if (a.status != ActivationResponse.statusSuccess) statusFailure.increment()
+ if (a.isColdStart) {
+ coldStartCounter.increment()
+ initTime.record(a.initTime.toMillis)
+ }
+
+ waitTime.record(a.waitTime.toMillis)
+ duration.record(a.duration.toMillis)
+ }
+
+ private def updatedSettings =
settings.withProperty(ConsumerConfig.CLIENT_ID_CONFIG, id)
+}
+
+object EventConsumer {
+ val userEventTopic = "events"
+ val id = "event-consumer"
+
+ private val server = ManagementFactory.getPlatformMBeanServer
+ private val name = new
ObjectName(s"kafka.consumer:type=consumer-fetch-manager-metrics,client-id=$id")
+
+ def consumerLag: Long = server.getAttribute(name,
"records-lag-max").asInstanceOf[Double].toLong.max(0)
+}
diff --git
a/core/monitoring/user-events/src/main/scala/org/apache/openwhisk/core/monitoring/metrics/KamonRecorder.scala
b/core/monitoring/user-events/src/main/scala/org/apache/openwhisk/core/monitoring/metrics/KamonRecorder.scala
new file mode 100644
index 0000000..d0c0c67
--- /dev/null
+++
b/core/monitoring/user-events/src/main/scala/org/apache/openwhisk/core/monitoring/metrics/KamonRecorder.scala
@@ -0,0 +1,111 @@
+/*
+ * Licensed to the Apache Software Foundation (ASF) under one or more
+ * contributor license agreements. See the NOTICE file distributed with
+ * this work for additional information regarding copyright ownership.
+ * The ASF licenses this file to You under the Apache License, Version 2.0
+ * (the "License"); you may not use this file except in compliance with
+ * the License. You may obtain a copy of the License at
+ *
+ * http://www.apache.org/licenses/LICENSE-2.0
+ *
+ * Unless required by applicable law or agreed to in writing, software
+ * distributed under the License is distributed on an "AS IS" BASIS,
+ * WITHOUT WARRANTIES OR CONDITIONS OF ANY KIND, either express or implied.
+ * See the License for the specific language governing permissions and
+ * limitations under the License.
+ */
+
+package org.apache.openwhisk.core.monitoring.metrics
+
+import akka.event.slf4j.SLF4JLogging
+import org.apache.openwhisk.core.connector.{Activation, Metric}
+import kamon.Kamon
+import kamon.metric.MeasurementUnit
+
+import scala.collection.concurrent.TrieMap
+
+trait KamonMetricNames extends MetricNames {
+ val activationMetric = "openwhisk.action.activations"
+ val coldStartMetric = "openwhisk.action.coldStarts"
+ val waitTimeMetric = "openwhisk.action.waitTime"
+ val initTimeMetric = "openwhisk.action.initTime"
+ val durationMetric = "openwhisk.action.duration"
+ val statusMetric = "openwhisk.action.status"
+
+ val concurrentLimitMetric = "openwhisk.action.limit.concurrent"
+ val timedLimitMetric = "openwhisk.action.limit.timed"
+}
+
+object KamonRecorder extends MetricRecorder with KamonMetricNames with
SLF4JLogging {
+ private val activationMetrics = new TrieMap[String, ActivationKamonMetrics]
+ private val limitMetrics = new TrieMap[String, LimitKamonMetrics]
+
+ override def processActivation(activation: Activation, initiatorNamespace:
String): Unit = {
+ lookup(activation, initiatorNamespace).record(activation)
+ }
+
+ override def processMetric(metric: Metric, initiatorNamespace: String): Unit
= {
+ val limitMetric = limitMetrics.getOrElseUpdate(initiatorNamespace,
LimitKamonMetrics(initiatorNamespace))
+ limitMetric.record(metric)
+ }
+
+ def lookup(activation: Activation, initiatorNamespace: String):
ActivationKamonMetrics = {
+ val name = activation.name
+ val kind = activation.kind
+ val memory = activation.memory.toString
+ val namespace = activation.namespace
+ val action = activation.action
+ activationMetrics.getOrElseUpdate(name, {
+ ActivationKamonMetrics(namespace, action, kind, memory,
initiatorNamespace)
+ })
+ }
+
+ case class LimitKamonMetrics(namespace: String) {
+ private val concurrentLimit =
Kamon.counter(concurrentLimitMetric).refine(`actionNamespace` -> namespace)
+ private val timedLimit =
Kamon.counter(timedLimitMetric).refine(`actionNamespace` -> namespace)
+
+ def record(m: Metric): Unit = {
+ m.metricName match {
+ case "ConcurrentRateLimit" => concurrentLimit.increment()
+ case "TimedRateLimit" => timedLimit.increment()
+ case x => log.warn(s"Unknown limit $x")
+ }
+ }
+ }
+
+ case class ActivationKamonMetrics(namespace: String,
+ action: String,
+ kind: String,
+ memory: String,
+ initiator: String) {
+ private val activationTags =
+ Map(
+ `actionNamespace` -> namespace,
+ `initiatorNamespace` -> initiator,
+ `actionName` -> action,
+ `actionKind` -> kind,
+ `actionMemory` -> memory)
+ private val tags = Map(`actionNamespace` -> namespace,
`initiatorNamespace` -> initiator, `actionName` -> action)
+
+ private val activations =
Kamon.counter(activationMetric).refine(activationTags)
+ private val coldStarts = Kamon.counter(coldStartMetric).refine(tags)
+ private val waitTime = Kamon.histogram(waitTimeMetric,
MeasurementUnit.time.milliseconds).refine(tags)
+ private val initTime = Kamon.histogram(initTimeMetric,
MeasurementUnit.time.milliseconds).refine(tags)
+ private val duration = Kamon.histogram(durationMetric,
MeasurementUnit.time.milliseconds).refine(tags)
+
+ def record(a: Activation): Unit = {
+ activations.increment()
+
+ if (a.isColdStart) {
+ coldStarts.increment()
+ initTime.record(a.initTime.toMillis)
+ }
+
+ //waitTime may be zero for activations which are part of sequence
+ waitTime.record(a.waitTime.toMillis)
+ duration.record(a.duration.toMillis)
+
+ Kamon.counter(statusMetric).refine(tags + ("status" ->
a.status)).increment()
+ }
+ }
+}
diff --git
a/core/monitoring/user-events/src/main/scala/org/apache/openwhisk/core/monitoring/metrics/Main.scala
b/core/monitoring/user-events/src/main/scala/org/apache/openwhisk/core/monitoring/metrics/Main.scala
new file mode 100644
index 0000000..9c1b932
--- /dev/null
+++
b/core/monitoring/user-events/src/main/scala/org/apache/openwhisk/core/monitoring/metrics/Main.scala
@@ -0,0 +1,45 @@
+/*
+ * Licensed to the Apache Software Foundation (ASF) under one or more
+ * contributor license agreements. See the NOTICE file distributed with
+ * this work for additional information regarding copyright ownership.
+ * The ASF licenses this file to You under the Apache License, Version 2.0
+ * (the "License"); you may not use this file except in compliance with
+ * the License. You may obtain a copy of the License at
+ *
+ * http://www.apache.org/licenses/LICENSE-2.0
+ *
+ * Unless required by applicable law or agreed to in writing, software
+ * distributed under the License is distributed on an "AS IS" BASIS,
+ * WITHOUT WARRANTIES OR CONDITIONS OF ANY KIND, either express or implied.
+ * See the License for the specific language governing permissions and
+ * limitations under the License.
+ */
+
+package org.apache.openwhisk.core.monitoring.metrics
+
+import akka.actor.ActorSystem
+import akka.http.scaladsl.Http
+import akka.stream.ActorMaterializer
+import kamon.Kamon
+
+import scala.concurrent.duration.DurationInt
+import scala.concurrent.{Await, ExecutionContextExecutor, Future}
+
+object Main {
+ def main(args: Array[String]): Unit = {
+ Kamon.loadReportersFromConfig()
+ implicit val system: ActorSystem = ActorSystem("events-actor-system")
+ implicit val materializer: ActorMaterializer = ActorMaterializer()
+ val binding = OpenWhiskEvents.start(system.settings.config)
+ addShutdownHook(binding)
+ }
+
+ private def addShutdownHook(binding: Future[Http.ServerBinding])(implicit
actorSystem: ActorSystem,
+
materializer: ActorMaterializer): Unit = {
+ implicit val ec: ExecutionContextExecutor = actorSystem.dispatcher
+ sys.addShutdownHook {
+ Await.result(binding.map(_.unbind()), 30.seconds)
+ Await.result(actorSystem.whenTerminated, 30.seconds)
+ }
+ }
+}
diff --git a/settings.gradle
b/core/monitoring/user-events/src/main/scala/org/apache/openwhisk/core/monitoring/metrics/MetricNames.scala
similarity index 53%
copy from settings.gradle
copy to
core/monitoring/user-events/src/main/scala/org/apache/openwhisk/core/monitoring/metrics/MetricNames.scala
index 02e46b8..d82b49b 100644
--- a/settings.gradle
+++
b/core/monitoring/user-events/src/main/scala/org/apache/openwhisk/core/monitoring/metrics/MetricNames.scala
@@ -15,35 +15,23 @@
* limitations under the License.
*/
-include 'common:scala'
-
-include 'core:controller'
-include 'core:invoker'
-include 'core:cosmosdb:cache-invalidator'
-include 'core:standalone'
-
-include 'tests'
-include 'tests:performance:gatling_tests'
-
-include 'tools:actionProxy'
-include 'tools:ow-utils'
-include 'tools:dev'
-
-include 'tools:admin'
-
-rootProject.name = 'openwhisk'
-
-gradle.ext.scala = [
- version: '2.12.9',
- compileFlags: ['-feature', '-unchecked', '-deprecation',
'-Xfatal-warnings', '-Ywarn-unused-import']
-]
-
-gradle.ext.scalafmt = [
- version: '1.5.0',
- config: new File(rootProject.projectDir, '.scalafmt.conf')
-]
-
-gradle.ext.akka = [version : '2.5.22']
-gradle.ext.akka_http = [version : '10.1.8']
-
-gradle.ext.curator = [version:'4.0.0']
+package org.apache.openwhisk.core.monitoring.metrics
+
+trait MetricNames {
+ val actionNamespace = "namespace"
+ val initiatorNamespace = "initiator"
+ val actionName = "action"
+ val actionStatus = "status"
+ val actionMemory = "memory"
+ val actionKind = "kind"
+
+ def activationMetric: String
+ def coldStartMetric: String
+ def waitTimeMetric: String
+ def initTimeMetric: String
+ def durationMetric: String
+ def statusMetric: String
+
+ def concurrentLimitMetric: String
+ def timedLimitMetric: String
+}
diff --git
a/core/monitoring/user-events/src/main/scala/org/apache/openwhisk/core/monitoring/metrics/OpenWhiskEvents.scala
b/core/monitoring/user-events/src/main/scala/org/apache/openwhisk/core/monitoring/metrics/OpenWhiskEvents.scala
new file mode 100644
index 0000000..8e963e5
--- /dev/null
+++
b/core/monitoring/user-events/src/main/scala/org/apache/openwhisk/core/monitoring/metrics/OpenWhiskEvents.scala
@@ -0,0 +1,65 @@
+/*
+ * Licensed to the Apache Software Foundation (ASF) under one or more
+ * contributor license agreements. See the NOTICE file distributed with
+ * this work for additional information regarding copyright ownership.
+ * The ASF licenses this file to You under the Apache License, Version 2.0
+ * (the "License"); you may not use this file except in compliance with
+ * the License. You may obtain a copy of the License at
+ *
+ * http://www.apache.org/licenses/LICENSE-2.0
+ *
+ * Unless required by applicable law or agreed to in writing, software
+ * distributed under the License is distributed on an "AS IS" BASIS,
+ * WITHOUT WARRANTIES OR CONDITIONS OF ANY KIND, either express or implied.
+ * See the License for the specific language governing permissions and
+ * limitations under the License.
+ */
+
+package org.apache.openwhisk.core.monitoring.metrics
+
+import akka.actor.{ActorSystem, CoordinatedShutdown}
+import akka.event.slf4j.SLF4JLogging
+import akka.http.scaladsl.Http
+import akka.kafka.ConsumerSettings
+import akka.stream.ActorMaterializer
+import com.typesafe.config.Config
+import kamon.Kamon
+import kamon.prometheus.PrometheusReporter
+import kamon.system.SystemMetrics
+import org.apache.kafka.common.serialization.StringDeserializer
+import pureconfig.loadConfigOrThrow
+
+import scala.concurrent.Future
+
+object OpenWhiskEvents extends SLF4JLogging {
+
+ case class MetricConfig(port: Int, enableKamon: Boolean)
+
+ def start(config: Config)(implicit system: ActorSystem,
+ materializer: ActorMaterializer):
Future[Http.ServerBinding] = {
+ Kamon.reconfigure(config)
+ val prometheusReporter = new PrometheusReporter()
+ Kamon.addReporter(prometheusReporter)
+ SystemMetrics.startCollecting()
+
+ val metricConfig = loadConfigOrThrow[MetricConfig](config,
"whisk.user-events")
+
+ val prometheusRecorder = PrometheusRecorder(prometheusReporter)
+ val recorders = if (metricConfig.enableKamon) Seq(prometheusRecorder,
KamonRecorder) else Seq(prometheusRecorder)
+ val eventConsumer =
EventConsumer(eventConsumerSettings(defaultConsumerConfig(config)), recorders)
+
+
CoordinatedShutdown(system).addTask(CoordinatedShutdown.PhaseBeforeServiceUnbind,
"shutdownConsumer") { () =>
+ eventConsumer.shutdown()
+ }
+ val port = metricConfig.port
+ val api = new PrometheusEventsApi(eventConsumer, prometheusRecorder)
+ val httpBinding = Http().bindAndHandle(api.routes, "0.0.0.0", port)
+ httpBinding.foreach(_ => log.info(s"Started the http server on
http://localhost:$port";))(system.dispatcher)
+ httpBinding
+ }
+
+ def eventConsumerSettings(config: Config): ConsumerSettings[String, String] =
+ ConsumerSettings(config, new StringDeserializer, new StringDeserializer)
+
+ def defaultConsumerConfig(globalConfig: Config): Config =
globalConfig.getConfig("akka.kafka.consumer")
+}
diff --git
a/core/monitoring/user-events/src/main/scala/org/apache/openwhisk/core/monitoring/metrics/PrometheusEventsApi.scala
b/core/monitoring/user-events/src/main/scala/org/apache/openwhisk/core/monitoring/metrics/PrometheusEventsApi.scala
new file mode 100644
index 0000000..b4b9a2b
--- /dev/null
+++
b/core/monitoring/user-events/src/main/scala/org/apache/openwhisk/core/monitoring/metrics/PrometheusEventsApi.scala
@@ -0,0 +1,49 @@
+/*
+ * Licensed to the Apache Software Foundation (ASF) under one or more
+ * contributor license agreements. See the NOTICE file distributed with
+ * this work for additional information regarding copyright ownership.
+ * The ASF licenses this file to You under the Apache License, Version 2.0
+ * (the "License"); you may not use this file except in compliance with
+ * the License. You may obtain a copy of the License at
+ *
+ * http://www.apache.org/licenses/LICENSE-2.0
+ *
+ * Unless required by applicable law or agreed to in writing, software
+ * distributed under the License is distributed on an "AS IS" BASIS,
+ * WITHOUT WARRANTIES OR CONDITIONS OF ANY KIND, either express or implied.
+ * See the License for the specific language governing permissions and
+ * limitations under the License.
+ */
+
+package org.apache.openwhisk.core.monitoring.metrics
+
+import akka.http.scaladsl.model.StatusCodes.ServiceUnavailable
+import akka.http.scaladsl.model.{ContentType, MessageEntity}
+import akka.http.scaladsl.server.Directives._
+import akka.http.scaladsl.server.Route
+
+trait PrometheusExporter {
+ def getReport(): MessageEntity
+}
+
+object PrometheusExporter {
+ val textV4: ContentType = ContentType.parse("text/plain; version=0.0.4;
charset=utf-8").right.get
+}
+
+class PrometheusEventsApi(consumer: EventConsumer, prometheus:
PrometheusExporter) {
+ val routes: Route = {
+ get {
+ path("ping") {
+ if (consumer.isRunning) {
+ complete("pong")
+ } else {
+ complete(ServiceUnavailable -> "Consumer not running")
+ }
+ } ~ path("metrics") {
+ encodeResponse {
+ complete(prometheus.getReport())
+ }
+ }
+ }
+ }
+}
diff --git
a/core/monitoring/user-events/src/main/scala/org/apache/openwhisk/core/monitoring/metrics/PrometheusRecorder.scala
b/core/monitoring/user-events/src/main/scala/org/apache/openwhisk/core/monitoring/metrics/PrometheusRecorder.scala
new file mode 100644
index 0000000..42be2e4
--- /dev/null
+++
b/core/monitoring/user-events/src/main/scala/org/apache/openwhisk/core/monitoring/metrics/PrometheusRecorder.scala
@@ -0,0 +1,250 @@
+/*
+ * Licensed to the Apache Software Foundation (ASF) under one or more
+ * contributor license agreements. See the NOTICE file distributed with
+ * this work for additional information regarding copyright ownership.
+ * The ASF licenses this file to You under the Apache License, Version 2.0
+ * (the "License"); you may not use this file except in compliance with
+ * the License. You may obtain a copy of the License at
+ *
+ * http://www.apache.org/licenses/LICENSE-2.0
+ *
+ * Unless required by applicable law or agreed to in writing, software
+ * distributed under the License is distributed on an "AS IS" BASIS,
+ * WITHOUT WARRANTIES OR CONDITIONS OF ANY KIND, either express or implied.
+ * See the License for the specific language governing permissions and
+ * limitations under the License.
+ */
+
+package org.apache.openwhisk.core.monitoring.metrics
+
+import java.io.StringWriter
+import java.util
+import java.util.concurrent.TimeUnit
+
+import akka.event.slf4j.SLF4JLogging
+import akka.http.scaladsl.model.{HttpEntity, MessageEntity}
+import akka.stream.scaladsl.{Concat, Source}
+import akka.util.ByteString
+import org.apache.openwhisk.core.connector.{Activation, Metric}
+import io.prometheus.client.exporter.common.TextFormat
+import io.prometheus.client.{CollectorRegistry, Counter, Gauge, Histogram}
+import kamon.prometheus.PrometheusReporter
+import org.apache.openwhisk.core.entity.ActivationResponse
+
+import scala.collection.JavaConverters._
+import scala.collection.concurrent.TrieMap
+import scala.concurrent.duration.Duration
+
+trait PrometheusMetricNames extends MetricNames {
+ val activationMetric = "openwhisk_action_activations_total"
+ val coldStartMetric = "openwhisk_action_coldStarts_total"
+ val waitTimeMetric = "openwhisk_action_waitTime_seconds"
+ val initTimeMetric = "openwhisk_action_initTime_seconds"
+ val durationMetric = "openwhisk_action_duration_seconds"
+ val statusMetric = "openwhisk_action_status"
+ val memoryMetric = "openwhisk_action_memory"
+
+ val concurrentLimitMetric = "openwhisk_action_limit_concurrent_total"
+ val timedLimitMetric = "openwhisk_action_limit_timed_total"
+}
+
+case class PrometheusRecorder(kamon: PrometheusReporter)
+ extends MetricRecorder
+ with PrometheusExporter
+ with SLF4JLogging {
+ import PrometheusRecorder._
+ private val activationMetrics = new TrieMap[String, ActivationPromMetrics]
+ private val limitMetrics = new TrieMap[String, LimitPromMetrics]
+
+ override def processActivation(activation: Activation, initiatorNamespace:
String): Unit = {
+ lookup(activation, initiatorNamespace).record(activation)
+ }
+
+ override def processMetric(metric: Metric, initiatorNamespace: String): Unit
= {
+ val limitMetric = limitMetrics.getOrElseUpdate(initiatorNamespace,
LimitPromMetrics(initiatorNamespace))
+ limitMetric.record(metric)
+ }
+
+ override def getReport(): MessageEntity =
+ HttpEntity(PrometheusExporter.textV4, createSource())
+
+ private def lookup(activation: Activation, initiatorNamespace: String):
ActivationPromMetrics = {
+ //TODO Unregister unused actions
+ val name = activation.name
+ val kind = activation.kind
+ val memory = activation.memory.toString
+ val namespace = activation.namespace
+ val action = activation.action
+ activationMetrics.getOrElseUpdate(name, {
+ ActivationPromMetrics(namespace, action, kind, memory,
initiatorNamespace)
+ })
+ }
+
+ case class LimitPromMetrics(namespace: String) {
+ private val concurrentLimit = concurrentLimitCounter.labels(namespace)
+ private val timedLimit = timedLimitCounter.labels(namespace)
+
+ def record(m: Metric): Unit = {
+ m.metricName match {
+ case "ConcurrentRateLimit" => concurrentLimit.inc()
+ case "TimedRateLimit" => timedLimit.inc()
+ case x => log.warn(s"Unknown limit $x")
+ }
+ }
+ }
+
+ case class ActivationPromMetrics(namespace: String,
+ action: String,
+ kind: String,
+ memory: String,
+ initiatorNamespace: String) {
+ private val activations = activationCounter.labels(namespace,
initiatorNamespace, action, kind, memory)
+ private val coldStarts = coldStartCounter.labels(namespace,
initiatorNamespace, action)
+ private val waitTime = waitTimeHisto.labels(namespace, initiatorNamespace,
action)
+ private val initTime = initTimeHisto.labels(namespace, initiatorNamespace,
action)
+ private val duration = durationHisto.labels(namespace, initiatorNamespace,
action)
+
+ private val gauge = memoryGauge.labels(namespace, initiatorNamespace,
action)
+
+ private val statusSuccess =
+ statusCounter.labels(namespace, initiatorNamespace, action,
ActivationResponse.statusSuccess)
+ private val statusApplicationError =
+ statusCounter.labels(namespace, initiatorNamespace, action,
ActivationResponse.statusApplicationError)
+ private val statusDeveloperError =
+ statusCounter.labels(namespace, initiatorNamespace, action,
ActivationResponse.statusDeveloperError)
+ private val statusInternalError =
+ statusCounter.labels(namespace, initiatorNamespace, action,
ActivationResponse.statusWhiskError)
+
+ def record(a: Activation): Unit = {
+ gauge.observe(a.memory)
+
+ activations.inc()
+
+ if (a.isColdStart) {
+ coldStarts.inc()
+ initTime.observe(seconds(a.initTime))
+ }
+
+ //waitTime may be zero for activations which are part of sequence
+ waitTime.observe(seconds(a.waitTime))
+ duration.observe(seconds(a.duration))
+
+ a.status match {
+ case ActivationResponse.statusSuccess => statusSuccess.inc()
+ case ActivationResponse.statusApplicationError =>
statusApplicationError.inc()
+ case ActivationResponse.statusDeveloperError =>
statusDeveloperError.inc()
+ case ActivationResponse.statusWhiskError =>
statusInternalError.inc()
+ case x =>
statusCounter.labels(namespace, initiatorNamespace, action, x).inc()
+ }
+ }
+ }
+
+ //Returns a floating point number
+ private def seconds(time: Duration): Double = time.toUnit(TimeUnit.SECONDS)
+
+ private def createSource() =
+ Source.combine(createJavaClientSource(),
createKamonSource())(Concat(_)).map(ByteString(_))
+
+ /**
+ * Enables streaming the prometheus metric data without building the whole
report in memory
+ */
+ private def createJavaClientSource() =
+ Source
+ .fromIterator(() =>
CollectorRegistry.defaultRegistry.metricFamilySamples().asScala)
+ .map { sample =>
+ //Stream string representation of one sample at a time
+ val writer = new StringWriter()
+ TextFormat.write004(writer, singletonEnumeration(sample))
+ writer.toString
+ }
+
+ private def createKamonSource() = Source.single(kamon.scrapeData())
+
+ private def singletonEnumeration[A](value: A) = new util.Enumeration[A] {
+ private var done = false
+ override def hasMoreElements: Boolean = !done
+ override def nextElement(): A = {
+ if (done) throw new NoSuchElementException
+ done = true
+ value
+ }
+ }
+}
+
+object PrometheusRecorder extends PrometheusMetricNames {
+ private val activationCounter =
+ counter(
+ activationMetric,
+ "Activation Count",
+ actionNamespace,
+ initiatorNamespace,
+ actionName,
+ actionKind,
+ actionMemory)
+ private val coldStartCounter =
+ counter(coldStartMetric, "Cold start counts", actionNamespace,
initiatorNamespace, actionName)
+ private val statusCounter =
+ counter(
+ statusMetric,
+ "Activation failure status type",
+ actionNamespace,
+ initiatorNamespace,
+ actionName,
+ actionStatus)
+ private val waitTimeHisto =
+ histogram(waitTimeMetric, "Internal system hold time", actionNamespace,
initiatorNamespace, actionName)
+ private val initTimeHisto =
+ histogram(
+ initTimeMetric,
+ "Time it took to initialize an action, e.g. docker init",
+ actionNamespace,
+ initiatorNamespace,
+ actionName)
+ private val durationHisto =
+ histogram(
+ durationMetric,
+ "Actual time the action code was running",
+ actionNamespace,
+ initiatorNamespace,
+ actionName)
+ private val memoryGauge =
+ histogram(
+ memoryMetric,
+ "Memory consumption of the action containers",
+ actionNamespace,
+ initiatorNamespace,
+ actionName)
+
+ private val concurrentLimitCounter =
+ counter(concurrentLimitMetric, "a user has exceeded its limit for
concurrent invocations", actionNamespace)
+
+ private val timedLimitCounter =
+ counter(
+ timedLimitMetric,
+ "the user has reached its per minute limit for the number of
invocations",
+ actionNamespace)
+
+ private def counter(name: String, help: String, tags: String*) =
+ Counter
+ .build()
+ .name(name)
+ .help(help)
+ .labelNames(tags: _*)
+ .register()
+
+ private def gauge(name: String, help: String, tags: String*) =
+ Gauge
+ .build()
+ .name(name)
+ .help(help)
+ .labelNames(tags: _*)
+ .register()
+
+ private def histogram(name: String, help: String, tags: String*) =
+ Histogram
+ .build()
+ .name(name)
+ .help(help)
+ .labelNames(tags: _*)
+ .register()
+}
diff --git
a/core/monitoring/user-events/src/test/scala/org/apache/openwhisk/core/monitoring/metrics/ApiTests.scala
b/core/monitoring/user-events/src/test/scala/org/apache/openwhisk/core/monitoring/metrics/ApiTests.scala
new file mode 100644
index 0000000..a2cd5f7
--- /dev/null
+++
b/core/monitoring/user-events/src/test/scala/org/apache/openwhisk/core/monitoring/metrics/ApiTests.scala
@@ -0,0 +1,64 @@
+/*
+ * Licensed to the Apache Software Foundation (ASF) under one or more
+ * contributor license agreements. See the NOTICE file distributed with
+ * this work for additional information regarding copyright ownership.
+ * The ASF licenses this file to You under the Apache License, Version 2.0
+ * (the "License"); you may not use this file except in compliance with
+ * the License. You may obtain a copy of the License at
+ *
+ * http://www.apache.org/licenses/LICENSE-2.0
+ *
+ * Unless required by applicable law or agreed to in writing, software
+ * distributed under the License is distributed on an "AS IS" BASIS,
+ * WITHOUT WARRANTIES OR CONDITIONS OF ANY KIND, either express or implied.
+ * See the License for the specific language governing permissions and
+ * limitations under the License.
+ */
+
+package org.apache.openwhisk.core.monitoring.metrics
+
+import akka.http.scaladsl.model.headers.HttpEncodings._
+import akka.http.scaladsl.model.headers.{`Accept-Encoding`,
`Content-Encoding`, HttpEncoding, HttpEncodings}
+import akka.http.scaladsl.model.{HttpCharsets, HttpEntity, HttpResponse}
+import akka.http.scaladsl.testkit.ScalatestRouteTest
+import org.junit.runner.RunWith
+import org.scalatest.concurrent.ScalaFutures
+import org.scalatest.junit.JUnitRunner
+import org.scalatest.matchers.Matcher
+import org.scalatest.{FlatSpec, Matchers}
+
+import scala.concurrent.duration.DurationInt
+
+@RunWith(classOf[JUnitRunner])
+class ApiTests extends FlatSpec with Matchers with ScalatestRouteTest with
EventsTestHelper with ScalaFutures {
+ implicit val timeoutConfig = PatienceConfig(1.minute)
+ behavior of "EventsApi"
+
+ it should "respond ping request" in {
+ val consumer = createConsumer(56754, system.settings.config)
+ val api = new PrometheusEventsApi(consumer, createExporter())
+ Get("/ping") ~> api.routes ~> check {
+ //Due to retries using a random port does not immediately result in
failure
+ handled shouldBe true
+ }
+ consumer.shutdown().futureValue
+ }
+
+ it should "respond metrics request" in {
+ val consumer = createConsumer(56754, system.settings.config)
+ val api = new PrometheusEventsApi(consumer, createExporter())
+ Get("/metrics") ~> `Accept-Encoding`(gzip) ~> api.routes ~> check {
+ contentType.charsetOption shouldBe Some(HttpCharsets.`UTF-8`)
+ contentType.mediaType.params("version") shouldBe "0.0.4"
+ response should haveContentEncoding(gzip)
+ }
+ consumer.shutdown().futureValue
+ }
+
+ private def haveContentEncoding(encoding: HttpEncoding):
Matcher[HttpResponse] =
+ be(encoding) compose {
+ (_:
HttpResponse).header[`Content-Encoding`].map(_.encodings.head).getOrElse(HttpEncodings.identity)
+ }
+
+ private def createExporter(): PrometheusExporter = () =>
HttpEntity(PrometheusExporter.textV4, "foo".getBytes)
+}
diff --git
a/core/monitoring/user-events/src/test/scala/org/apache/openwhisk/core/monitoring/metrics/EventsTestHelper.scala
b/core/monitoring/user-events/src/test/scala/org/apache/openwhisk/core/monitoring/metrics/EventsTestHelper.scala
new file mode 100644
index 0000000..71b8d2e
--- /dev/null
+++
b/core/monitoring/user-events/src/test/scala/org/apache/openwhisk/core/monitoring/metrics/EventsTestHelper.scala
@@ -0,0 +1,45 @@
+/*
+ * Licensed to the Apache Software Foundation (ASF) under one or more
+ * contributor license agreements. See the NOTICE file distributed with
+ * this work for additional information regarding copyright ownership.
+ * The ASF licenses this file to You under the Apache License, Version 2.0
+ * (the "License"); you may not use this file except in compliance with
+ * the License. You may obtain a copy of the License at
+ *
+ * http://www.apache.org/licenses/LICENSE-2.0
+ *
+ * Unless required by applicable law or agreed to in writing, software
+ * distributed under the License is distributed on an "AS IS" BASIS,
+ * WITHOUT WARRANTIES OR CONDITIONS OF ANY KIND, either express or implied.
+ * See the License for the specific language governing permissions and
+ * limitations under the License.
+ */
+
+package org.apache.openwhisk.core.monitoring.metrics
+
+import java.net.ServerSocket
+
+import akka.actor.ActorSystem
+import akka.stream.ActorMaterializer
+import com.typesafe.config.Config
+import kamon.prometheus.PrometheusReporter
+
+trait EventsTestHelper {
+
+ protected def createConsumer(kport: Int,
+ globalConfig: Config,
+ recorder: MetricRecorder =
PrometheusRecorder(new PrometheusReporter))(
+ implicit system: ActorSystem,
+ materializer: ActorMaterializer) = {
+ val settings = OpenWhiskEvents
+
.eventConsumerSettings(OpenWhiskEvents.defaultConsumerConfig(globalConfig))
+ .withBootstrapServers(s"localhost:$kport")
+ EventConsumer(settings, Seq(recorder))
+ }
+
+ protected def freePort(): Int = {
+ val socket = new ServerSocket(0)
+ try socket.getLocalPort
+ finally if (socket != null) socket.close()
+ }
+}
diff --git
a/core/monitoring/user-events/src/test/scala/org/apache/openwhisk/core/monitoring/metrics/KafkaSpecBase.scala
b/core/monitoring/user-events/src/test/scala/org/apache/openwhisk/core/monitoring/metrics/KafkaSpecBase.scala
new file mode 100644
index 0000000..3549159
--- /dev/null
+++
b/core/monitoring/user-events/src/test/scala/org/apache/openwhisk/core/monitoring/metrics/KafkaSpecBase.scala
@@ -0,0 +1,56 @@
+/*
+ * Licensed to the Apache Software Foundation (ASF) under one or more
+ * contributor license agreements. See the NOTICE file distributed with
+ * this work for additional information regarding copyright ownership.
+ * The ASF licenses this file to You under the Apache License, Version 2.0
+ * (the "License"); you may not use this file except in compliance with
+ * the License. You may obtain a copy of the License at
+ *
+ * http://www.apache.org/licenses/LICENSE-2.0
+ *
+ * Unless required by applicable law or agreed to in writing, software
+ * distributed under the License is distributed on an "AS IS" BASIS,
+ * WITHOUT WARRANTIES OR CONDITIONS OF ANY KIND, either express or implied.
+ * See the License for the specific language governing permissions and
+ * limitations under the License.
+ */
+
+package org.apache.openwhisk.core.monitoring.metrics
+
+import akka.actor.ActorSystem
+import akka.stream.ActorMaterializer
+import akka.testkit.TestKit
+import net.manub.embeddedkafka.EmbeddedKafka
+import org.scalatest._
+import org.scalatest.concurrent.{Eventually, IntegrationPatience, ScalaFutures}
+import org.slf4j.{Logger, LoggerFactory}
+
+import scala.concurrent.duration.{DurationInt, FiniteDuration}
+
+abstract class KafkaSpecBase
+ extends TestKit(ActorSystem("test"))
+ with Suite
+ with Matchers
+ with ScalaFutures
+ with FlatSpecLike
+ with EmbeddedKafka
+ with IntegrationPatience
+ with BeforeAndAfterAll
+ with BeforeAndAfterEach
+ with Eventually
+ with EventsTestHelper { this: Suite =>
+ val log: Logger = LoggerFactory.getLogger(getClass)
+ implicit val timeoutConfig = PatienceConfig(1.minute)
+
+ implicit val materializer = ActorMaterializer()
+
+ def sleep(time: FiniteDuration, msg: String = ""): Unit = {
+ log.info(s"sleeping $time $msg")
+ Thread.sleep(time.toMillis)
+ }
+
+ override protected def afterAll(): Unit = {
+ super.afterAll()
+ shutdown()
+ }
+}
diff --git
a/core/monitoring/user-events/src/test/scala/org/apache/openwhisk/core/monitoring/metrics/KamonRecorderTests.scala
b/core/monitoring/user-events/src/test/scala/org/apache/openwhisk/core/monitoring/metrics/KamonRecorderTests.scala
new file mode 100644
index 0000000..e25d938
--- /dev/null
+++
b/core/monitoring/user-events/src/test/scala/org/apache/openwhisk/core/monitoring/metrics/KamonRecorderTests.scala
@@ -0,0 +1,157 @@
+/*
+ * Licensed to the Apache Software Foundation (ASF) under one or more
+ * contributor license agreements. See the NOTICE file distributed with
+ * this work for additional information regarding copyright ownership.
+ * The ASF licenses this file to You under the Apache License, Version 2.0
+ * (the "License"); you may not use this file except in compliance with
+ * the License. You may obtain a copy of the License at
+ *
+ * http://www.apache.org/licenses/LICENSE-2.0
+ *
+ * Unless required by applicable law or agreed to in writing, software
+ * distributed under the License is distributed on an "AS IS" BASIS,
+ * WITHOUT WARRANTIES OR CONDITIONS OF ANY KIND, either express or implied.
+ * See the License for the specific language governing permissions and
+ * limitations under the License.
+ */
+
+package org.apache.openwhisk.core.monitoring.metrics
+
+import java.time.Duration
+
+import com.typesafe.config.{Config, ConfigFactory}
+import kamon.metric.{PeriodSnapshot, PeriodSnapshotAccumulator}
+import kamon.util.Registration
+import kamon.{Kamon, MetricReporter}
+import net.manub.embeddedkafka.EmbeddedKafkaConfig
+import org.junit.runner.RunWith
+import org.scalatest.BeforeAndAfterEach
+import org.scalatest.junit.JUnitRunner
+import org.apache.openwhisk.core.connector.{Activation, EventMessage}
+import org.apache.openwhisk.core.entity.{ActivationResponse, Subject, UUID}
+
+import scala.concurrent.duration._
+
+@RunWith(classOf[JUnitRunner])
+class KamonRecorderTests extends KafkaSpecBase with BeforeAndAfterEach with
KamonMetricNames {
+ val sleepAfterProduce: FiniteDuration = 4.seconds
+ var reporterReg: Registration = _
+
+ override protected def beforeEach(): Unit = {
+ super.beforeEach()
+ TestReporter.reset()
+ val newConfig = ConfigFactory.parseString("""kamon {
+ | metric {
+ | tick-interval = 50 ms
+ | optimistic-tick-alignment = no
+ | }
+ |}""".stripMargin).withFallback(ConfigFactory.load())
+ Kamon.reconfigure(newConfig)
+ reporterReg = Kamon.addReporter(TestReporter)
+ }
+
+ override protected def afterEach(): Unit = {
+ reporterReg.cancel()
+ Kamon.reconfigure(ConfigFactory.load())
+ super.afterEach()
+ }
+
+ behavior of "KamonConsumer"
+
+ val namespace = "whisk.system"
+ val initiator = "testNS"
+ val actionWithCustomPackage = "apimgmt/createApi"
+ val actionWithDefaultPackage = "createApi"
+ val kind = "nodejs:10"
+ val memory = 256
+
+ it should "push user events to kamon" in {
+ val kconfig = EmbeddedKafkaConfig(kafkaPort = 0, zooKeeperPort = 0)
+ withRunningKafkaOnFoundPort(kconfig) { implicit actualConfig =>
+ createCustomTopic(EventConsumer.userEventTopic)
+
+ val consumer = createConsumer(actualConfig.kafkaPort,
system.settings.config, KamonRecorder)
+
+ publishStringMessageToKafka(
+ EventConsumer.userEventTopic,
+ newActivationEvent(s"$namespace/$actionWithCustomPackage").serialize)
+
+ publishStringMessageToKafka(
+ EventConsumer.userEventTopic,
+ newActivationEvent(s"$namespace/$actionWithDefaultPackage").serialize)
+
+ sleep(sleepAfterProduce, "sleeping post produce")
+ consumer.shutdown().futureValue
+ sleep(4.second, "sleeping for Kamon reporters to get invoked")
+
+ // Custom package
+ TestReporter.counter(activationMetric, actionWithCustomPackage).size
shouldBe 1
+ TestReporter
+ .counter(activationMetric, actionWithCustomPackage)
+ .filter((t) => t.tags.get(actionMemory).get == memory.toString)
+ .size shouldBe 1
+ TestReporter
+ .counter(activationMetric, actionWithCustomPackage)
+ .filter((t) => t.tags.get(actionKind).get == kind)
+ .size shouldBe 1
+ TestReporter
+ .counter(statusMetric, actionWithCustomPackage)
+ .filter((t) => t.tags.get(actionStatus).get ==
ActivationResponse.statusDeveloperError)
+ .size shouldBe 1
+ TestReporter.counter(coldStartMetric, actionWithCustomPackage).size
shouldBe 1
+ TestReporter.histogram(waitTimeMetric, actionWithCustomPackage).size
shouldBe 1
+ TestReporter.histogram(initTimeMetric, actionWithCustomPackage).size
shouldBe 1
+ TestReporter.histogram(durationMetric, actionWithCustomPackage).size
shouldBe 1
+
+ // Default package
+ TestReporter.histogram(durationMetric, actionWithDefaultPackage).size
shouldBe 1
+ }
+ }
+
+ private def newActivationEvent(name: String) =
+ EventMessage(
+ namespace,
+ Activation(name, 2, 3.millis, 5.millis, 11.millis, kind, false, memory,
None),
+ Subject("testuser"),
+ initiator,
+ UUID("test"),
+ Activation.typeName)
+
+ private object TestReporter extends MetricReporter {
+ var snapshotAccumulator = new
PeriodSnapshotAccumulator(Duration.ofDays(1), Duration.ZERO)
+ override def reportPeriodSnapshot(snapshot: PeriodSnapshot): Unit = {
+ snapshotAccumulator.add(snapshot)
+ }
+
+ override def start(): Unit = {}
+ override def stop(): Unit = {}
+ override def reconfigure(config: Config): Unit = {}
+
+ def reset(): Unit = {
+ snapshotAccumulator = new PeriodSnapshotAccumulator(Duration.ofDays(1),
Duration.ZERO)
+ }
+
+ def counter(name: String, action: String) = {
+ System.out.println()
+ snapshotAccumulator
+ .peek()
+ .metrics
+ .counters
+ .filter(_.name == name)
+ .filter((t) => t.tags.get(actionNamespace).get == namespace)
+ .filter((t) => t.tags.get(initiatorNamespace).get == initiator)
+ .filter((t) => t.tags.get(actionName).get == action)
+ }
+
+ def histogram(name: String, action: String) = {
+ snapshotAccumulator
+ .peek()
+ .metrics
+ .histograms
+ .filter(_.name == name)
+ .filter((t) => t.tags.get(actionNamespace).get == namespace)
+ .filter((t) => t.tags.get(initiatorNamespace).get == initiator)
+ .filter((t) => t.tags.get(actionName).get == action)
+ }
+ }
+}
diff --git
a/core/monitoring/user-events/src/test/scala/org/apache/openwhisk/core/monitoring/metrics/OpenWhiskEventsTests.scala
b/core/monitoring/user-events/src/test/scala/org/apache/openwhisk/core/monitoring/metrics/OpenWhiskEventsTests.scala
new file mode 100644
index 0000000..0354c42
--- /dev/null
+++
b/core/monitoring/user-events/src/test/scala/org/apache/openwhisk/core/monitoring/metrics/OpenWhiskEventsTests.scala
@@ -0,0 +1,84 @@
+/*
+ * Licensed to the Apache Software Foundation (ASF) under one or more
+ * contributor license agreements. See the NOTICE file distributed with
+ * this work for additional information regarding copyright ownership.
+ * The ASF licenses this file to You under the Apache License, Version 2.0
+ * (the "License"); you may not use this file except in compliance with
+ * the License. You may obtain a copy of the License at
+ *
+ * http://www.apache.org/licenses/LICENSE-2.0
+ *
+ * Unless required by applicable law or agreed to in writing, software
+ * distributed under the License is distributed on an "AS IS" BASIS,
+ * WITHOUT WARRANTIES OR CONDITIONS OF ANY KIND, either express or implied.
+ * See the License for the specific language governing permissions and
+ * limitations under the License.
+ */
+
+package org.apache.openwhisk.core.monitoring.metrics
+
+import akka.http.scaladsl.Http
+import akka.http.scaladsl.model.{HttpRequest, StatusCodes}
+import akka.http.scaladsl.unmarshalling.Unmarshal
+import com.typesafe.config.ConfigFactory
+import kamon.Kamon
+import net.manub.embeddedkafka.EmbeddedKafkaConfig
+import org.junit.runner.RunWith
+import org.scalatest.junit.JUnitRunner
+import scala.concurrent.duration._
+
+import scala.util.Try
+
+@RunWith(classOf[JUnitRunner])
+class OpenWhiskEventsTests extends KafkaSpecBase {
+ behavior of "Server"
+
+ it should "start working http server" in {
+ val kconfig = EmbeddedKafkaConfig(kafkaPort = 0, zooKeeperPort = 0)
+ withRunningKafkaOnFoundPort(kconfig) { implicit actualConfig =>
+ val kafkaPort = actualConfig.kafkaPort
+ val httpPort = freePort()
+ val globalConfig = system.settings.config
+ val config = ConfigFactory.parseString(s"""
+ | akka.kafka.consumer.kafka-clients {
+ | bootstrap.servers = "localhost:$kafkaPort"
+ | }
+ | kamon {
+ | metric {
+ | tick-interval = 50 ms
+ | optimistic-tick-alignment = no
+ | }
+ | }
+ | whisk {
+ | user-events {
+ | port = $httpPort
+ | }
+ | }
+ """.stripMargin).withFallback(globalConfig)
+
+ val binding = OpenWhiskEvents.start(config).futureValue
+ val res = get("localhost", httpPort, "/ping")
+ res shouldBe Some(StatusCodes.OK, "pong")
+
+ //Check if metrics using Kamon API gets included in consolidated
Prometheus
+ Kamon.counter("fooTest").increment(42)
+ sleep(1.second)
+ val metricRes = get("localhost", httpPort, "/metrics")
+ metricRes.get._2 should include("fooTest")
+
+ binding.unbind().futureValue
+ }
+ }
+
+ def get(host: String, port: Int, path: String = "/") = {
+ val response = Try {
+ Http()
+ .singleRequest(HttpRequest(uri = s"http://$host:$port$path";))
+ .futureValue
+ }.toOption
+
+ response.map { res =>
+ (res.status, Unmarshal(res).to[String].futureValue)
+ }
+ }
+}
diff --git
a/core/monitoring/user-events/src/test/scala/org/apache/openwhisk/core/monitoring/metrics/PrometheusRecorderTests.scala
b/core/monitoring/user-events/src/test/scala/org/apache/openwhisk/core/monitoring/metrics/PrometheusRecorderTests.scala
new file mode 100644
index 0000000..a2c9732
--- /dev/null
+++
b/core/monitoring/user-events/src/test/scala/org/apache/openwhisk/core/monitoring/metrics/PrometheusRecorderTests.scala
@@ -0,0 +1,122 @@
+/*
+ * Licensed to the Apache Software Foundation (ASF) under one or more
+ * contributor license agreements. See the NOTICE file distributed with
+ * this work for additional information regarding copyright ownership.
+ * The ASF licenses this file to You under the Apache License, Version 2.0
+ * (the "License"); you may not use this file except in compliance with
+ * the License. You may obtain a copy of the License at
+ *
+ * http://www.apache.org/licenses/LICENSE-2.0
+ *
+ * Unless required by applicable law or agreed to in writing, software
+ * distributed under the License is distributed on an "AS IS" BASIS,
+ * WITHOUT WARRANTIES OR CONDITIONS OF ANY KIND, either express or implied.
+ * See the License for the specific language governing permissions and
+ * limitations under the License.
+ */
+
+package org.apache.openwhisk.core.monitoring.metrics
+
+import io.prometheus.client.CollectorRegistry
+import net.manub.embeddedkafka.EmbeddedKafkaConfig
+import org.junit.runner.RunWith
+import org.scalatest.BeforeAndAfterEach
+import org.scalatest.junit.JUnitRunner
+import org.apache.openwhisk.core.connector.{Activation, EventMessage}
+import org.apache.openwhisk.core.entity.{ActivationResponse, Subject, UUID}
+
+import scala.concurrent.duration._
+
+@RunWith(classOf[JUnitRunner])
+class PrometheusRecorderTests extends KafkaSpecBase with BeforeAndAfterEach
with PrometheusMetricNames {
+ val sleepAfterProduce: FiniteDuration = 4.seconds
+
+ behavior of "PrometheusConsumer"
+ val namespace = "whisk.system"
+ val initiator = "testNS"
+ val actionWithCustomPackage = "apimgmt/createApiOne"
+ val actionWithDefaultPackage = "createApi"
+ val kind = "nodejs:10"
+ val memory = "256"
+
+ it should "push user events to kamon" in {
+ val kconfig = EmbeddedKafkaConfig(kafkaPort = 0, zooKeeperPort = 0)
+ withRunningKafkaOnFoundPort(kconfig) { implicit actualConfig =>
+ createCustomTopic(EventConsumer.userEventTopic)
+
+ val consumer = createConsumer(actualConfig.kafkaPort,
system.settings.config)
+ publishStringMessageToKafka(
+ EventConsumer.userEventTopic,
+ newActivationEvent(s"$namespace/$actionWithCustomPackage", kind,
memory, initiator).serialize)
+
+ publishStringMessageToKafka(
+ EventConsumer.userEventTopic,
+ newActivationEvent(s"$namespace/$actionWithDefaultPackage", kind,
memory, initiator).serialize)
+
+ // Custom package
+ sleep(sleepAfterProduce, "sleeping post produce")
+ consumer.shutdown().futureValue
+ counterTotal(activationMetric, actionWithCustomPackage) shouldBe 1
+ counter(coldStartMetric, actionWithCustomPackage) shouldBe 1
+ counterStatus(statusMetric, actionWithCustomPackage,
ActivationResponse.statusDeveloperError) shouldBe 1
+
+ histogramCount(waitTimeMetric, actionWithCustomPackage) shouldBe 1
+ histogramSum(waitTimeMetric, actionWithCustomPackage) shouldBe (0.03 +-
0.001)
+
+ histogramCount(initTimeMetric, actionWithCustomPackage) shouldBe 1
+ histogramSum(initTimeMetric, actionWithCustomPackage) shouldBe (433.433
+- 0.01)
+
+ histogramCount(durationMetric, actionWithCustomPackage) shouldBe 1
+ histogramSum(durationMetric, actionWithCustomPackage) shouldBe (1.254 +-
0.01)
+
+ gauge(memoryMetric, actionWithCustomPackage) shouldBe 1
+
+ // Default package
+ counterTotal(activationMetric, actionWithDefaultPackage) shouldBe 1
+ }
+ }
+
+ private def newActivationEvent(name: String, kind: String, memory: String,
initiator: String) =
+ EventMessage(
+ "test",
+ Activation(name, 2, 1254.millis, 30.millis, 433433.millis, kind, false,
memory.toInt, None),
+ Subject("testuser"),
+ initiator,
+ UUID("test"),
+ Activation.typeName)
+
+ private def gauge(name: String, action: String) =
+ CollectorRegistry.defaultRegistry.getSampleValue(
+ s"${name}_count",
+ Array("namespace", "initiator", "action"),
+ Array(namespace, initiator, action))
+
+ private def counter(name: String, action: String) =
+ CollectorRegistry.defaultRegistry.getSampleValue(
+ name,
+ Array("namespace", "initiator", "action"),
+ Array(namespace, initiator, action))
+
+ private def counterTotal(name: String, action: String) =
+ CollectorRegistry.defaultRegistry.getSampleValue(
+ name,
+ Array("namespace", "initiator", "action", "kind", "memory"),
+ Array(namespace, initiator, action, kind, memory))
+
+ private def counterStatus(name: String, action: String, status: String) =
+ CollectorRegistry.defaultRegistry.getSampleValue(
+ name,
+ Array("namespace", "initiator", "action", "status"),
+ Array(namespace, initiator, action, status))
+
+ private def histogramCount(name: String, action: String) =
+ CollectorRegistry.defaultRegistry.getSampleValue(
+ s"${name}_count",
+ Array("namespace", "initiator", "action"),
+ Array(namespace, initiator, action))
+
+ private def histogramSum(name: String, action: String) =
+ CollectorRegistry.defaultRegistry
+ .getSampleValue(s"${name}_sum", Array("namespace", "initiator",
"action"), Array(namespace, initiator, action))
+ .doubleValue()
+}
diff --git a/docs/metrics.md b/docs/metrics.md
index 9d00b38..19b6b94 100644
--- a/docs/metrics.md
+++ b/docs/metrics.md
@@ -331,3 +331,6 @@ Metric:
```
{"body":{"metricName":"ConcurrentInvocations","metricValue":1},"eventType":"Metric","source":"controller0","subject":"guest","timestamp":1524476104419,"userId":"23bc46b1-71f6-4ed5-8c54-816aa4f8c502","namespace":"guest"}
```
+
+### User-events consumer service
+All user metrics can be consumed and published to various services such as
Prometheus, Datadog etc via Kamon by using the [user-events
service](https://github.com/apache/openwhisk/tree/master/core/monitoring/user-events/README.md).
diff --git a/settings.gradle b/settings.gradle
index 02e46b8..fc9b0b4 100644
--- a/settings.gradle
+++ b/settings.gradle
@@ -21,6 +21,7 @@ include 'core:controller'
include 'core:invoker'
include 'core:cosmosdb:cache-invalidator'
include 'core:standalone'
+include 'core:monitoring:user-events'
include 'tests'
include 'tests:performance:gatling_tests'
diff --git a/tests/build.gradle b/tests/build.gradle
index 4590e77..5def20f 100644
--- a/tests/build.gradle
+++ b/tests/build.gradle
@@ -205,6 +205,7 @@ dependencies {
compile project(':core:controller')
compile project(':core:invoker')
compile project(':core:cosmosdb:cache-invalidator')
+ compile project(':core:monitoring:user-events')
compile project(':tools:admin')
swaggerCodegen 'io.swagger:swagger-codegen-cli:2.3.1'
diff --git
a/tests/src/test/scala/org/apache/openwhisk/common/UserEventTests.scala
b/tests/src/test/scala/org/apache/openwhisk/common/UserEventTests.scala
index f321254..fa3fa88 100644
--- a/tests/src/test/scala/org/apache/openwhisk/common/UserEventTests.scala
+++ b/tests/src/test/scala/org/apache/openwhisk/common/UserEventTests.scala
@@ -74,13 +74,13 @@ class UserEventTests extends FlatSpec with Matchers with
WskTestHelpers with Str
case (_, _, _, msg) => EventMessage.parse(new String(msg,
StandardCharsets.UTF_8))
}
received.map(event => {
- event.body match {
+ event.get.body match {
case a: Activation =>
Seq(a.statusCode) should contain oneOf (0, 1, 2, 3)
- event.source should fullyMatch regex "(invoker|controller)\\d+".r
+ event.get.source should fullyMatch regex
"(invoker|controller)\\d+".r
case m: Metric =>
Seq(m.metricName) should contain oneOf ("ConcurrentInvocations",
"ConcurrentRateLimit", "TimedRateLimit")
- event.source should fullyMatch regex "controller\\d+".r
+ event.get.source should fullyMatch regex "controller\\d+".r
}
})
// produce at least 2 events - an Activation and a
'ConcurrentInvocations' Metric
diff --git
a/tests/src/test/scala/org/apache/openwhisk/core/connector/test/EventMessageTests.scala
b/tests/src/test/scala/org/apache/openwhisk/core/connector/test/EventMessageTests.scala
index bf59c67..031304b 100644
---
a/tests/src/test/scala/org/apache/openwhisk/core/connector/test/EventMessageTests.scala
+++
b/tests/src/test/scala/org/apache/openwhisk/core/connector/test/EventMessageTests.scala
@@ -18,6 +18,7 @@
package org.apache.openwhisk.core.connector.test
import java.time.Instant
+import java.util.concurrent.TimeUnit
import org.junit.runner.RunWith
import org.scalatest.{FlatSpec, Matchers}
@@ -57,7 +58,7 @@ class EventMessageTests extends FlatSpec with Matchers {
it should "transform an activation into an event body" in {
Activation.from(fullActivation) shouldBe Success(
- Activation("ns2/a", 0, 123, 5, 10, "testkind", false, 128,
Some("sequence")))
+ Activation("ns2/a", 0, toDuration(123), toDuration(5), toDuration(10),
"testkind", false, 128, Some("sequence")))
}
it should "fail transformation if needed annotations are missing" in {
@@ -75,6 +76,9 @@ class EventMessageTests extends FlatSpec with Matchers {
WhiskActivation.pathAnnotation,
"ns2/a"))
- Activation.from(a) shouldBe Success(Activation("ns2/a", 0, 0, 0, 0,
"testkind", false, 0, None))
+ Activation.from(a) shouldBe Success(
+ Activation("ns2/a", 0, toDuration(0), toDuration(0), toDuration(0),
"testkind", false, 0, None))
}
+
+ def toDuration(milliseconds: Long) = new FiniteDuration(milliseconds,
TimeUnit.MILLISECONDS)
}
diff --git a/tools/jenkins/apache/dockerhub.groovy
b/tools/jenkins/apache/dockerhub.groovy
index 4b075f3..3072fec 100644
--- a/tools/jenkins/apache/dockerhub.groovy
+++ b/tools/jenkins/apache/dockerhub.groovy
@@ -29,7 +29,7 @@ node('xenial&&!H21&&!H22&&!H11&&!ubuntu-eu3') {
withCredentials([usernamePassword(credentialsId: 'openwhisk_dockerhub',
passwordVariable: 'DOCKER_PASSWORD', usernameVariable: 'DOCKER_USER')]) {
sh 'docker login -u ${DOCKER_USER} -p ${DOCKER_PASSWORD}'
}
- def PUSH_CMD = "./gradlew :core:controller:distDocker
:core:invoker:distDocker :tools:ow-utils:distDocker -PdockerRegistry=docker.io
-PdockerImagePrefix=openwhisk"
+ def PUSH_CMD = "./gradlew :core:controller:distDocker
:core:invoker:distDocker :core:monitoring:user-events:distDocker
:tools:ow-utils:distDocker -PdockerRegistry=docker.io
-PdockerImagePrefix=openwhisk"
def gitCommit = sh(returnStdout: true, script: 'git rev-parse
HEAD').trim()
def shortCommit = gitCommit.take(7)
sh "./gradlew clean"