BewareMyPower commented on PR #988:
URL: https://github.com/apache/pulsar-client-go/pull/988#issuecomment-1461328085
## Performance test setup
Run a Pulsar 2.11.0 standalone locally with
`acknowledgmentAtBatchIndexLevelEnabled=true`.
Build the `perf` binary:
```bash
cd perf
go build
```
Run the consumer in terminal 1:
```bash
./perf consume --profile \
-s sub \
--enable-batch-index-ack \
my-topic
```
Run the producer in terminal, the throughput is about 20 MB/s:
```bash
./perf produce \
--batching-num-messages=10 \
--size 105 \
--rate 200000 \
my-topic
```
## Test result
### Before this patch
```
INFO[13:31:17.584] Stats - Publish rate: 150038.6 msg/s - 120.2 Mbps -
Latency ms: 50% 3.1 -95% 13.0 - 99% 48.9
- 99.9% 48.9 - max 48.9
INFO[13:31:27.581] Stats - Publish rate: 179909.8 msg/s - 144.1 Mbps -
Latency ms: 50% 2.4 -95% 8.7 - 99% 26.2
- 99.9% 26.2 - max 26.2
INFO[13:31:37.581] Stats - Publish rate: 188957.1 msg/s - 151.4 Mbps -
Latency ms: 50% 2.3 -95% 7.8 - 99% 15.9
- 99.9% 15.9 - max 15.9
```
```
INFO[13:31:11.592] Stats - Consume rate: 22956.0 msg/s - 18.4 Mbps
INFO[13:31:21.592] Stats - Consume rate: 46805.3 msg/s - 37.5 Mbps
INFO[13:31:31.593] Stats - Consume rate: 47494.7 msg/s - 38.0 Mbps
INFO[13:31:41.594] Stats - Consume rate: 48100.3 msg/s - 38.5 Mbps
INFO[13:31:51.592] Stats - Consume rate: 59705.8 msg/s - 47.8 Mbps
INFO[13:32:01.597] Stats - Consume rate: 61694.0 msg/s - 49.4 Mbps
INFO[13:32:11.592] Stats - Consume rate: 58100.2 msg/s - 46.5 Mbps
INFO[13:32:21.592] Stats - Consume rate: 60818.2 msg/s - 48.7 Mbps
INFO[13:32:31.596] Stats - Consume rate: 60681.5 msg/s - 48.6 Mbps
```
The consumer can not catch up the producer even if the produce rate is only
20 MB/s. So it fell back to catch up read and the broker reads messages
directly with BK.
### After this patch
```
INFO[13:27:33.212] Stats - Publish rate: 165290.5 msg/s - 132.4 Mbps -
Latency ms: 50% 2.9 -95% 11.3 - 99% 58.2
- 99.9% 58.2 - max 58.2
INFO[13:27:43.213] Stats - Publish rate: 197230.3 msg/s - 158.0 Mbps -
Latency ms: 50% 2.4 -95% 5.5 - 99% 22.2
- 99.9% 22.2 - max 22.2
INFO[13:27:53.212] Stats - Publish rate: 193150.6 msg/s - 154.7 Mbps -
Latency ms: 50% 2.5 -95% 5.9 - 99% 17.6
- 99.9% 17.6 - max 17.6
INFO[13:28:03.212] Stats - Publish rate: 170759.9 msg/s - 136.8 Mbps -
Latency ms: 50% 2.6 -95% 5.7 - 99% 23.4
- 99.9% 23.4 - max 23.4
INFO[13:28:13.212] Stats - Publish rate: 149780.3 msg/s - 120.0 Mbps -
Latency ms: 50% 2.9 -95% 6.4 - 99% 61.2
- 99.9% 61.2 - max 61.2
INFO[13:28:23.212] Stats - Publish rate: 157285.9 msg/s - 126.0 Mbps -
Latency ms: 50% 2.7 -95% 6.2 - 99% 14.2
- 99.9% 14.2 - max 14.2
```
```
INFO[13:27:34.523] Stats - Consume rate: 180047.6 msg/s - 144.2 Mbps
INFO[13:27:44.524] Stats - Consume rate: 197120.2 msg/s - 157.9 Mbps
INFO[13:27:54.523] Stats - Consume rate: 193490.8 msg/s - 155.0 Mbps
INFO[13:28:04.523] Stats - Consume rate: 165149.2 msg/s - 132.3 Mbps
INFO[13:28:14.523] Stats - Consume rate: 150062.6 msg/s - 120.2 Mbps
INFO[13:28:24.523] Stats - Consume rate: 154697.5 msg/s - 123.9 Mbps
```
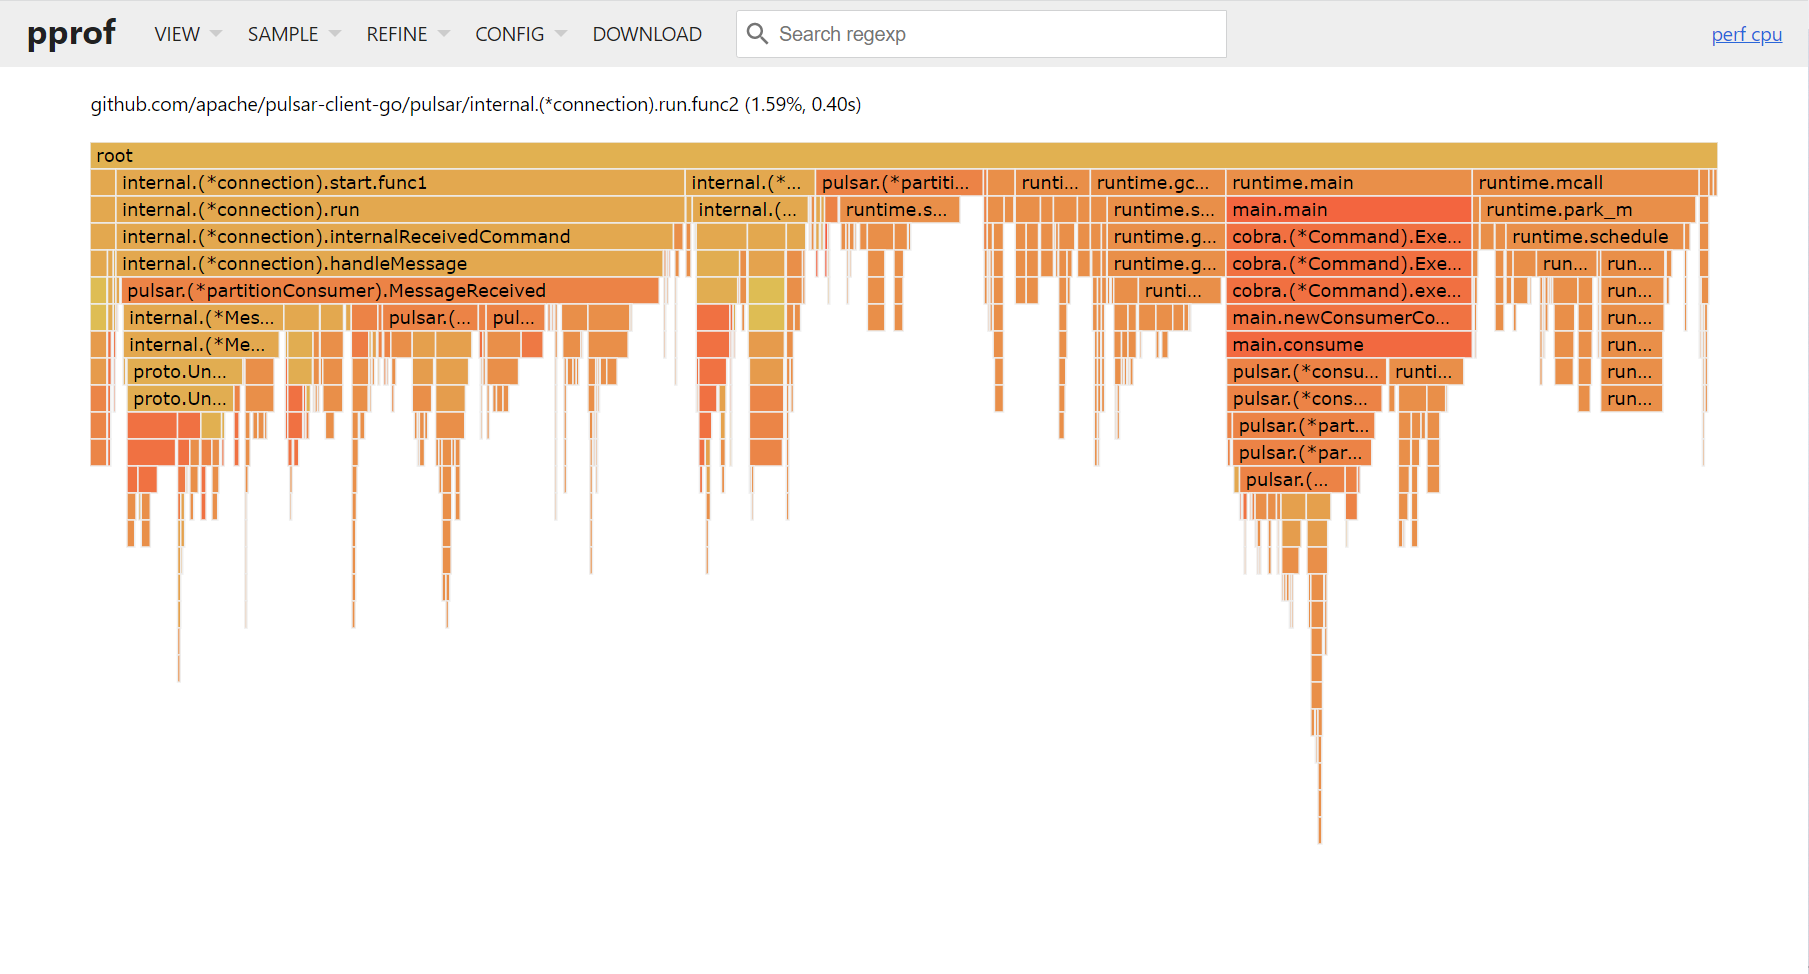
### Flame Graph
Before this patch:


We can see `internalSendRequest` takes about 40% of the total, which also
leads to the result that `runEventLoop` method also takes 8.87% of the total.
After this patch:
--
This is an automated message from the Apache Git Service.
To respond to the message, please log on to GitHub and use the
URL above to go to the specific comment.
To unsubscribe, e-mail: [email protected]
For queries about this service, please contact Infrastructure at:
[email protected]