On Mon, 17 May 2021 22:08:01 GMT, Paul Sandoz <[email protected]> wrote:
>> I see your concern. I made some additional benchmarks and added them here. >> First, CountSized, which just gets the stream size without actual traversal. >> We can see how the performance changes depending on number of stream >> operations. I also added an optional type profile pollution that makes >> `exactOutputSize` virtual method polymorphic. Here's the results: >> >> Baseline (The `count10Skip` test added just to ensure that patch works) >> >> Benchmark (pollute) (size) Mode Cnt Score Error Units >> count0 false 10000 avgt 100 15,648 ± 0,182 ns/op >> count2 false 10000 avgt 100 31,252 ± 0,113 ns/op >> count4 false 10000 avgt 100 47,683 ± 0,165 ns/op >> count6 false 10000 avgt 100 64,417 ± 0,203 ns/op >> count8 false 10000 avgt 100 80,813 ± 0,265 ns/op >> count10 false 10000 avgt 100 101,057 ± 0,295 ns/op >> count10Skip false 10000 avgt 100 497967,375 ± 5946,108 ns/op >> count0 true 10000 avgt 100 18,843 ± 0,103 ns/op >> count2 true 10000 avgt 100 33,716 ± 0,152 ns/op >> count4 true 10000 avgt 100 49,062 ± 0,208 ns/op >> count6 true 10000 avgt 100 66,773 ± 0,237 ns/op >> count8 true 10000 avgt 100 82,727 ± 0,354 ns/op >> count10 true 10000 avgt 100 104,499 ± 0,299 ns/op >> count10Skip true 10000 avgt 100 501723,220 ± 6361,932 ns/op >> >> Type pollution adds some near-constant ~2ns overhead to the non-patched >> version as well. >> >> Patched: >> >> Benchmark (pollute) (size) Mode Cnt Score Error Units >> count0 false 10000 avgt 100 15,363 ± 0,086 ns/op >> count2 false 10000 avgt 100 33,736 ± 0,138 ns/op >> count4 false 10000 avgt 100 51,470 ± 0,205 ns/op >> count6 false 10000 avgt 100 70,407 ± 0,262 ns/op >> count8 false 10000 avgt 100 89,865 ± 0,262 ns/op >> count10 false 10000 avgt 100 114,423 ± 0,363 ns/op >> count10Skip false 10000 avgt 100 139,963 ± 0,550 ns/op >> count0 true 10000 avgt 100 26,538 ± 0,084 ns/op >> count2 true 10000 avgt 100 46,089 ± 0,191 ns/op >> count4 true 10000 avgt 100 66,560 ± 0,315 ns/op >> count6 true 10000 avgt 100 87,852 ± 0,288 ns/op >> count8 true 10000 avgt 100 109,037 ± 0,391 ns/op >> count10 true 10000 avgt 100 139,759 ± 0,382 ns/op >> count10Skip true 10000 avgt 100 156,963 ± 1,862 ns/op >> >> So indeed we have some performance drawback in patched version. Here's a >> chart: >> >>  >> I've calculated linear regression on (patched-baseline) times, depending on >> the number of ops. It's `y = 1.288x - 0.7078` for clean type profile and `y >> = 2.6174x + 6.9489` for polluted type profile. So, in the worst case, we >> have circa 2.6ns per operation plus 7ns constant overhead. >> >> However, using Stream API without actually iterating the stream is very rare >> case. And if we iterate, the performance will be dominated by the number of >> iterations. I tried to model this case with SumSized benchmark (replacing >> count with sum, for 5 and 10 stream elements), but got very confusing >> results. >> >> Baseline: >> >> Benchmark (pollute) (size) Mode Cnt Score Error Units >> sum0 true 5 avgt 100 126,425 ± 0,793 ns/op >> sum2 true 5 avgt 100 195,113 ± 1,359 ns/op >> sum4 true 5 avgt 100 304,111 ± 8,302 ns/op >> sum6 true 5 avgt 100 414,841 ± 3,215 ns/op >> sum8 true 5 avgt 100 507,421 ± 4,781 ns/op >> sum10 true 5 avgt 100 633,635 ± 7,105 ns/op >> sum0 false 5 avgt 100 45,781 ± 0,258 ns/op >> sum2 false 5 avgt 100 86,720 ± 0,573 ns/op >> sum4 false 5 avgt 100 195,777 ± 1,145 ns/op >> sum6 false 5 avgt 100 291,261 ± 2,091 ns/op >> sum8 false 5 avgt 100 376,094 ± 3,283 ns/op >> sum10 false 5 avgt 100 492,082 ± 7,914 ns/op >> sum0 true 10 avgt 100 127,989 ± 0,758 ns/op >> sum2 true 10 avgt 100 219,991 ± 3,081 ns/op >> sum4 true 10 avgt 100 374,148 ± 7,426 ns/op >> sum6 true 10 avgt 100 557,829 ± 3,959 ns/op >> sum8 true 10 avgt 100 698,135 ± 4,915 ns/op >> sum10 true 10 avgt 100 904,851 ± 14,458 ns/op >> sum0 false 10 avgt 100 43,861 ± 0,107 ns/op >> sum2 false 10 avgt 100 105,049 ± 0,276 ns/op >> sum4 false 10 avgt 100 294,639 ± 1,499 ns/op >> sum6 false 10 avgt 100 439,340 ± 4,223 ns/op >> sum8 false 10 avgt 100 577,025 ± 5,760 ns/op >> sum10 false 10 avgt 100 729,391 ± 6,045 ns/op >> >> >> Patched: >> >> Benchmark (pollute) (size) Mode Cnt Score Error Units >> sum0 true 5 avgt 100 68,466 ± 0,167 ns/op >> sum2 true 5 avgt 100 107,240 ± 0,261 ns/op >> sum4 true 5 avgt 100 209,469 ± 1,098 ns/op >> sum6 true 5 avgt 100 300,873 ± 2,020 ns/op >> sum8 true 5 avgt 100 378,654 ± 2,620 ns/op >> sum10 true 5 avgt 100 473,769 ± 3,665 ns/op >> sum0 false 5 avgt 100 49,435 ± 2,702 ns/op >> sum2 false 5 avgt 100 96,237 ± 2,906 ns/op >> sum4 false 5 avgt 100 195,196 ± 0,961 ns/op >> sum6 false 5 avgt 100 286,542 ± 1,874 ns/op >> sum8 false 5 avgt 100 371,664 ± 3,416 ns/op >> sum10 false 5 avgt 100 457,178 ± 3,776 ns/op >> sum0 true 10 avgt 100 69,223 ± 0,195 ns/op >> sum2 true 10 avgt 100 120,507 ± 0,752 ns/op >> sum4 true 10 avgt 100 291,328 ± 5,581 ns/op >> sum6 true 10 avgt 100 439,136 ± 3,787 ns/op >> sum8 true 10 avgt 100 569,188 ± 6,440 ns/op >> sum10 true 10 avgt 100 709,916 ± 5,022 ns/op >> sum0 false 10 avgt 100 46,347 ± 0,174 ns/op >> sum2 false 10 avgt 100 109,131 ± 2,381 ns/op >> sum4 false 10 avgt 100 296,566 ± 2,079 ns/op >> sum6 false 10 avgt 100 430,852 ± 2,629 ns/op >> sum8 false 10 avgt 100 562,795 ± 4,442 ns/op >> sum10 false 10 avgt 100 716,229 ± 5,659 ns/op >> >> >> Or, in graphical form: >> 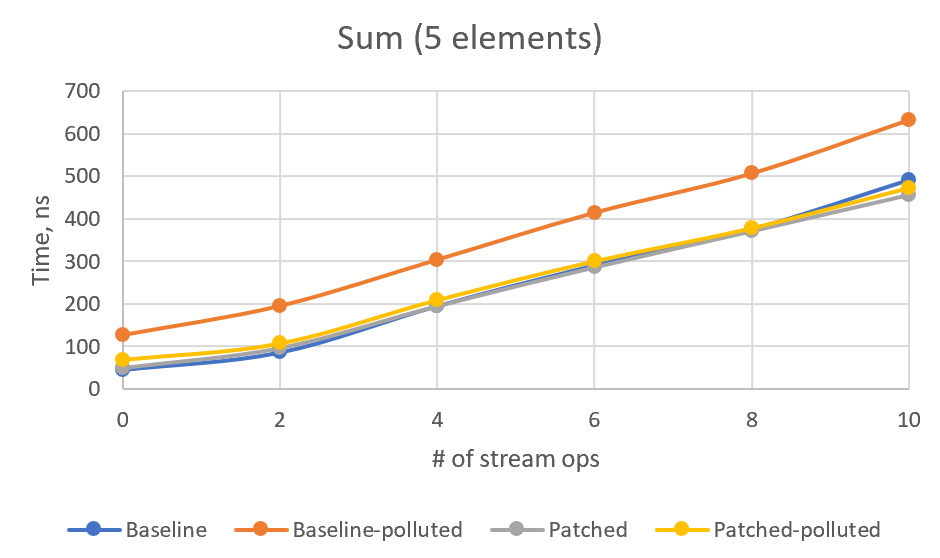 >> 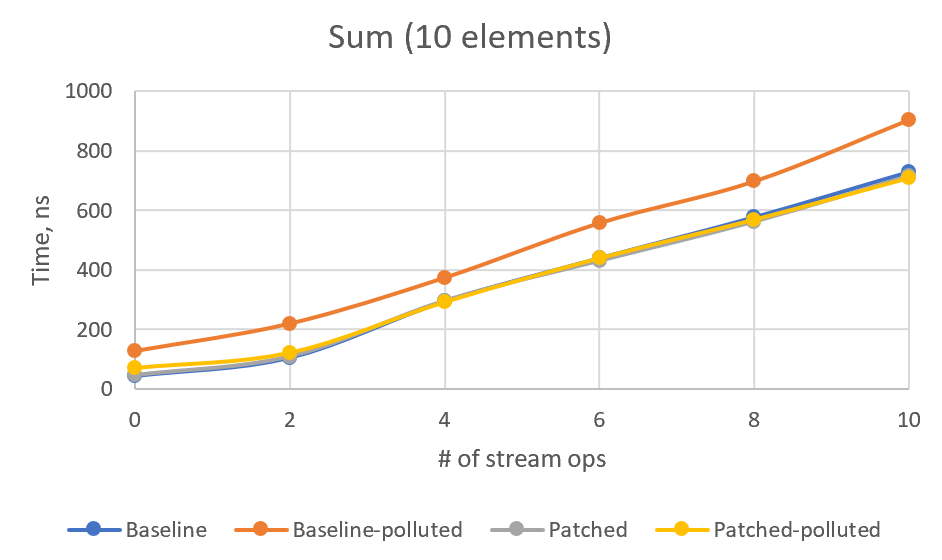 >> >> For some reason, non-patched polluted version is the slowest, and I cannot >> see any stable overhead in patched version. For 4+ intermediate ops, patched >> version numbers are always better than the corresponding non-patched ones. I >> would be glad if somebody explains these numbers or point to a flaw in this >> benchmark. >> >> What do you think, @PaulSandoz? Is it acceptable overhead or should I >> experiment with the new Stream flag? > > @amaembo this dropped of my radar, but the Skara reminder made it visible > again! > > Thank you for the detailed analysis. I cannot explain the results of when > triggering profile pollution over the kinds of stream. > I think we have good sense that the performance is not unduly perturbed for > small streams (there is more work done elsewhere than determining the actual > size of the sized stream). > > Implementation-wise I still find it a little awkward that the operation is > responsible for calling the prior op in the pipeline, and we see the > consequences of that in the Slice op implementation that predicates on > `isParallel`. > > It might be cleaner if the op is presented with some exact size and adjusts > it, something more pure e.g. for SliceOp: > > long exactOutputSize(long sourceSize) { > return calcSize(sourceSize, skip, normalizedLimit); > } > > The default impl would be: > > long exactOutputSize(long sourceSize) { > return sourceSize; > } > > > Then the pipeline helper is responsible for traversing the pipeline (be it > sequentially or in parallel, in the latter case the above method would not > get called since the slice op becomes the source spliterator for the next > stages). > > To do that efficiently does I think require a new flag, set by an op and only > meaningful when SIZED is set (and cleared when SIZED is cleared, although > perhaps we only need to do that splitting stages for parallel execution, see > `AbstractPipeline.sourceSpliterator`). @PaulSandoz I added a new flag and updated `exactOutputSize` per your suggestion, implementing the explicit iteration inside `AbstractPipeline#exactOutputSizeIfKnown`, along with `isParallel()` check. I'm not sure how to clear the new flag automatically but this is not so necessary, as it's not used if `SIZED` is not set. Also, I skipped the `sourceStage` (starting from `sourceState.nextStage`), to save one virtual call, as current implementation never has the source stage that adjusts the size. ------------- PR: https://git.openjdk.java.net/jdk/pull/3427