nawelittle opened a new issue #9884: Select xAxis to draw value. URL: https://github.com/apache/incubator-echarts/issues/9884 ## General Questions Is it possible to choose the x axis where I want to draw the values? , I need that the bars have 2 different colors and are on 2 different axes ### Expected Behavior 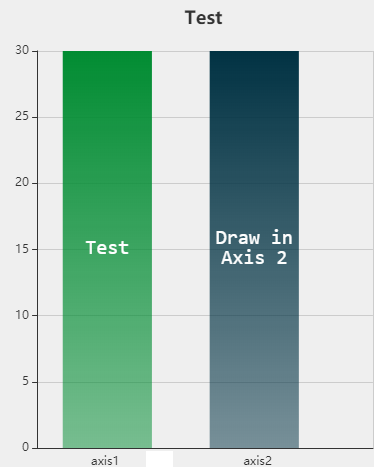 ### Current Behavior  the two series are being drawn on the axis1 ### Online Example http://jsfiddle.net/kfbp5j9z/1/ ## Environment - ECharts version;ECharts 版本: 4.1.0
----------------------------------------------------------------
This is an automated message from the Apache Git Service.
To respond to the message, please log on GitHub and use the
URL above to go to the specific comment.

For queries about this service, please contact Infrastructure at:
[email protected]


With regards,
Apache Git Services

---------------------------------------------------------------------
To unsubscribe, e-mail: [email protected]
For additional commands, e-mail: [email protected]