lixiangfei opened a new issue #10994: 折线图在数据进行切换的时候显示异常 URL: https://github.com/apache/incubator-echarts/issues/10994 ### Version 4.1.0-release ### Steps to reproduce 业务场景 需要从后台根据时间粒度选择7天的数据 选择1分钟展示没有问题,然后选择5分钟粒度数据,图表展示异常 ### What is expected? 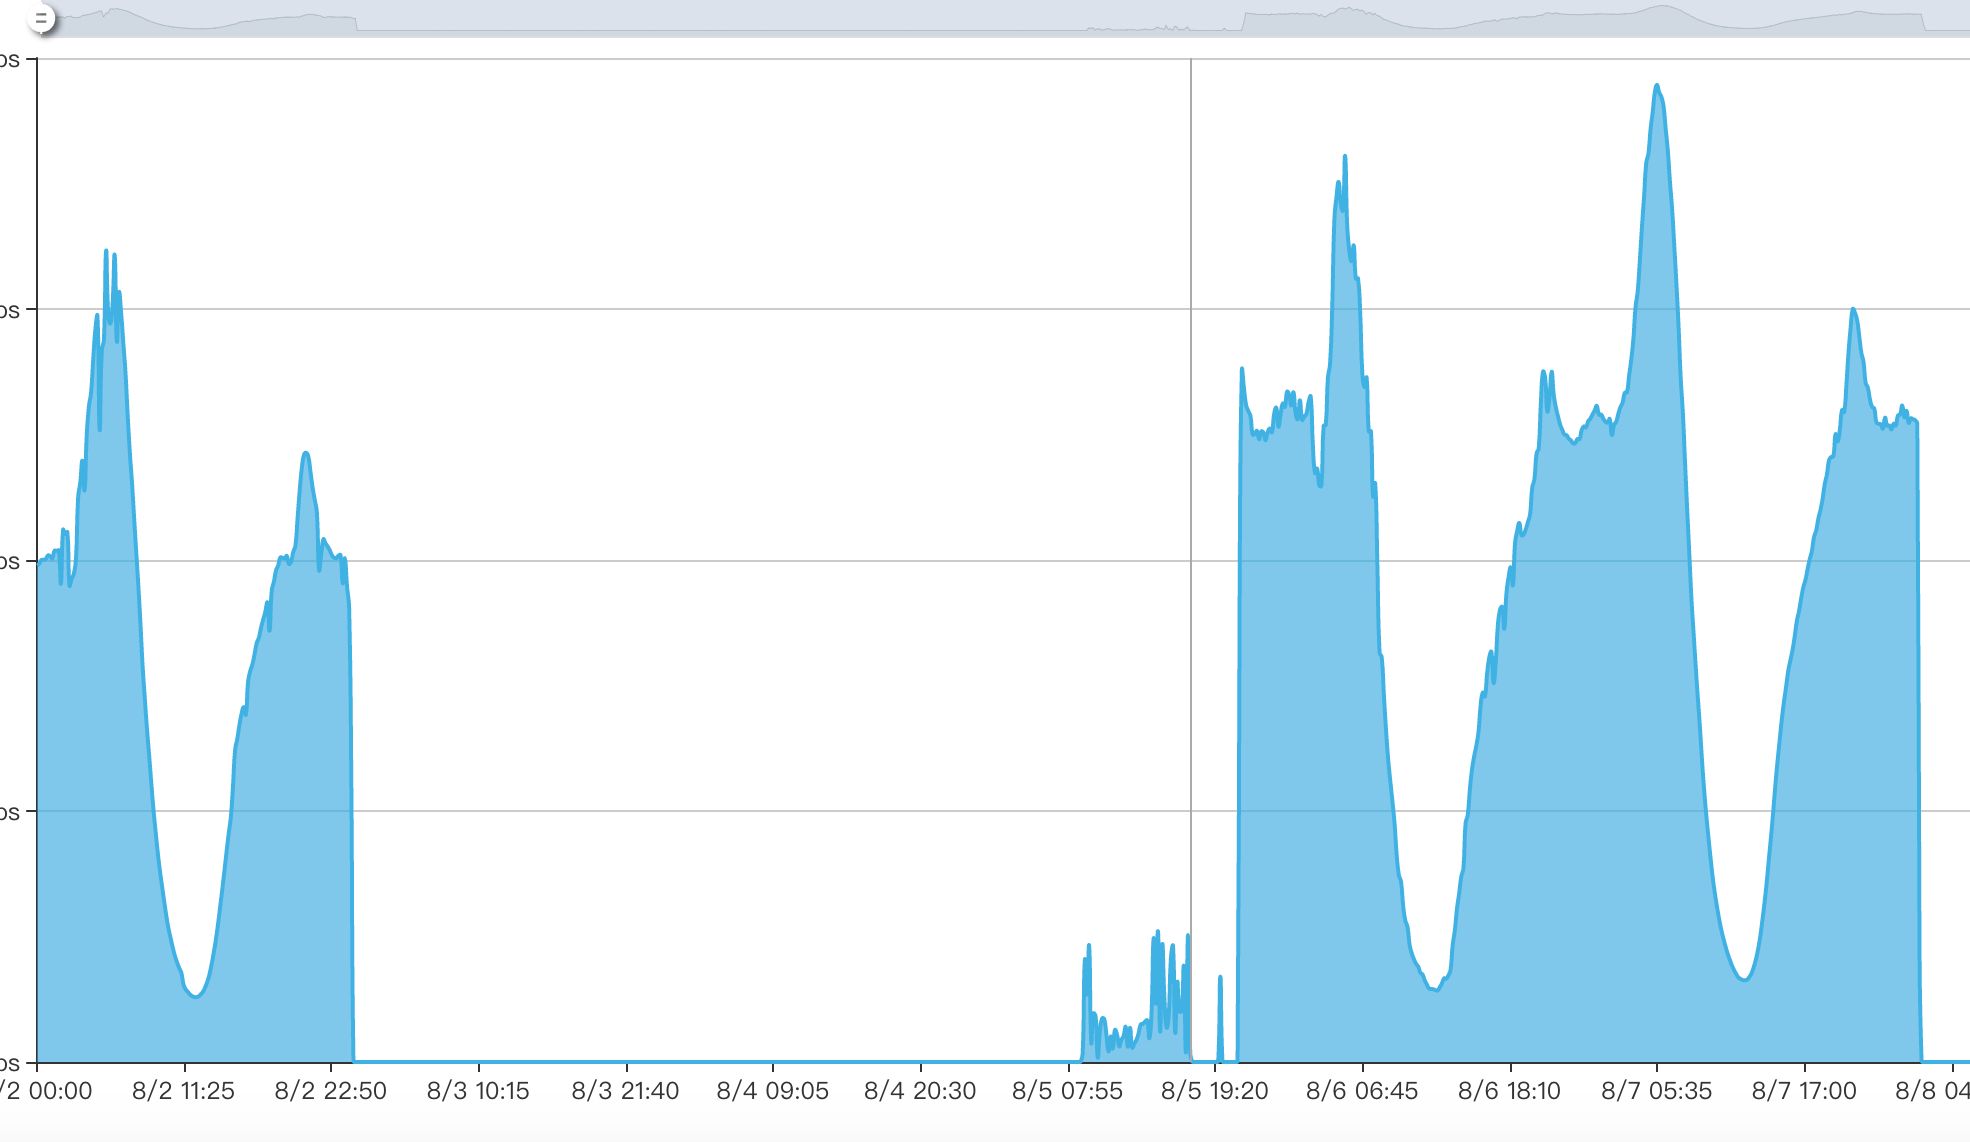 ### What is actually happening? 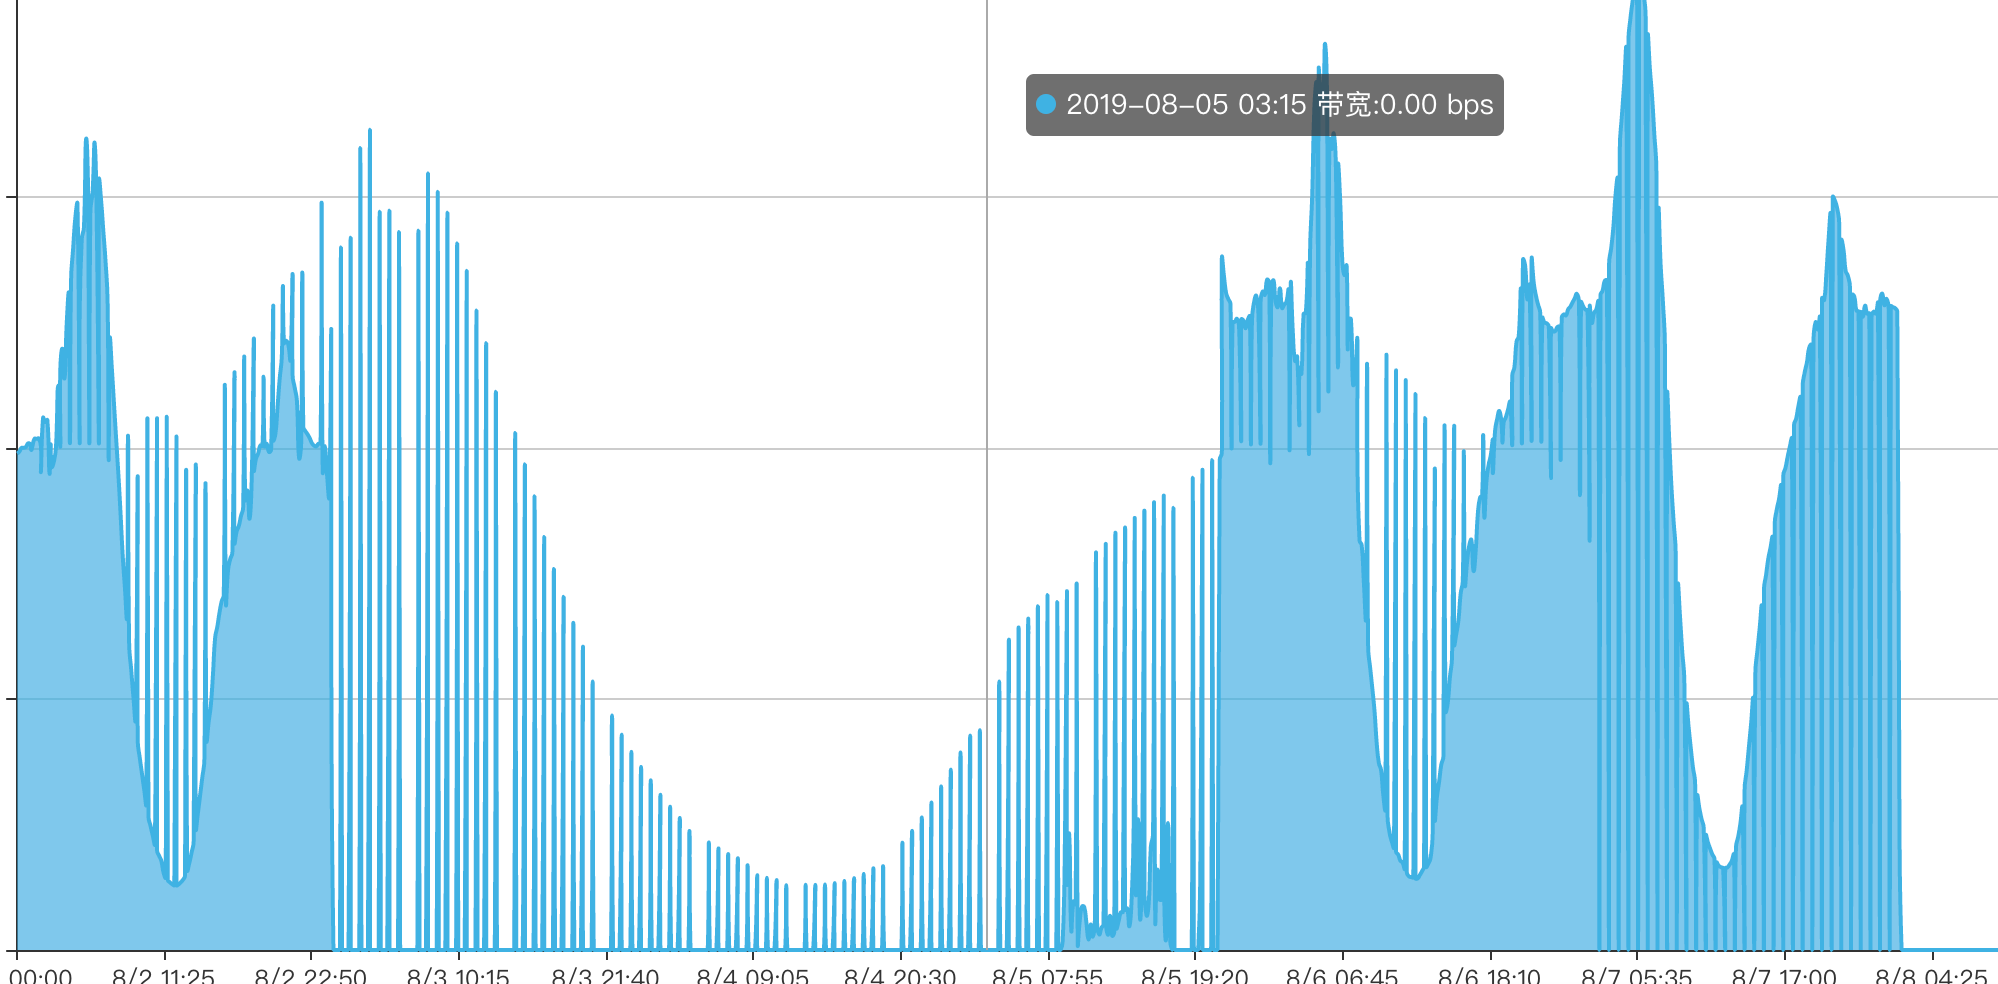 --- 看图表是好多数据为0时候垂直的直线,有zoom配置, zoom缩放一下后正常显示 grid: { left: '3%', right: '4%', bottom: '3%', containLabel: true, }, dataZoom: [ { type: 'inside', start: 0, end: 100, filterMode: 'empty', }, { start: 0, end: 100, top: 30, height: 20, filterMode: 'empty', handleIcon: 'M10.7,11.9v-1.3H9.3v1.3c-4.9,0.3-8.8,4.4-8.8,9.4c0,5,3.9,9.1,8.8,9.4v1.3h1.3v-1.3c4.9-0.3,8.8-4.4,8.8-9.4C19.5,16.3,15.6,12.2,10.7,11.9z M13.3,24.4H6.7V23h6.6V24.4z M13.3,19.6H6.7v-1.4h6.6V19.6z', handleSize: '80%', handleStyle: { color: '#fff', shadowBlur: 3, shadowColor: 'rgba(0, 0, 0, 0.6)', shadowOffsetX: 2, shadowOffsetY: 2, }, }, ], xAxis: { type: 'category', boundaryGap: false, data: [], axisLabel: { formatter: function(value: string) { return formatDate(value) }, }, }, yAxis: { type: 'value', axisLabel: { formatter: function(value: number) { let formatter: Function = currAction === Action_AvailBandwidth ? formatBpsData : formatQpsData return formatter(value, ' ', 0) }, }, }, toolbox: { x: 'center', show: true, feature: { dataZoom: { yAxisIndex: 'none', title: { dataZoom: '区域缩放', dataZoomReset: '区域缩放后退', }, }, }, }, series: [], } <!-- This issue is generated by echarts-issue-helper. DO NOT REMOVE -->
----------------------------------------------------------------
This is an automated message from the Apache Git Service.
To respond to the message, please log on to GitHub and use the
URL above to go to the specific comment.

For queries about this service, please contact Infrastructure at:
[email protected]


With regards,
Apache Git Services

---------------------------------------------------------------------
To unsubscribe, e-mail: [email protected]
For additional commands, e-mail: [email protected]


