Haosvit opened a new issue, #16852:
URL: https://github.com/apache/echarts/issues/16852
### Version 5.3.2 ### Link to Minimal Reproduction https://echarts.apache.org/examples/en/editor.html?c=line-simple&version=5.3.2 ### Steps to Reproduce 1. Use this option: ```js option = { dataZoom: [ { filterMode: 'none', type: 'inside', xAxisIndex: [0] }, { filterMode: 'none', type: 'inside', yAxisIndex: [0] } ], xAxis: { type: 'category', data: ['Mon', 'Tue'] }, yAxis: { type: 'value' }, series: [ { data: [ { value: 20, itemStyle: { color: 'green' } }, { value: 200, itemStyle: { color: 'red' } } ], type: 'bar' } ] }; ``` 2. Zoom in while mouse is over the smaller bar (green) to a zoom level where y axis has range about [5, 43]. ### Current Behavior Bars are overlapping each other. 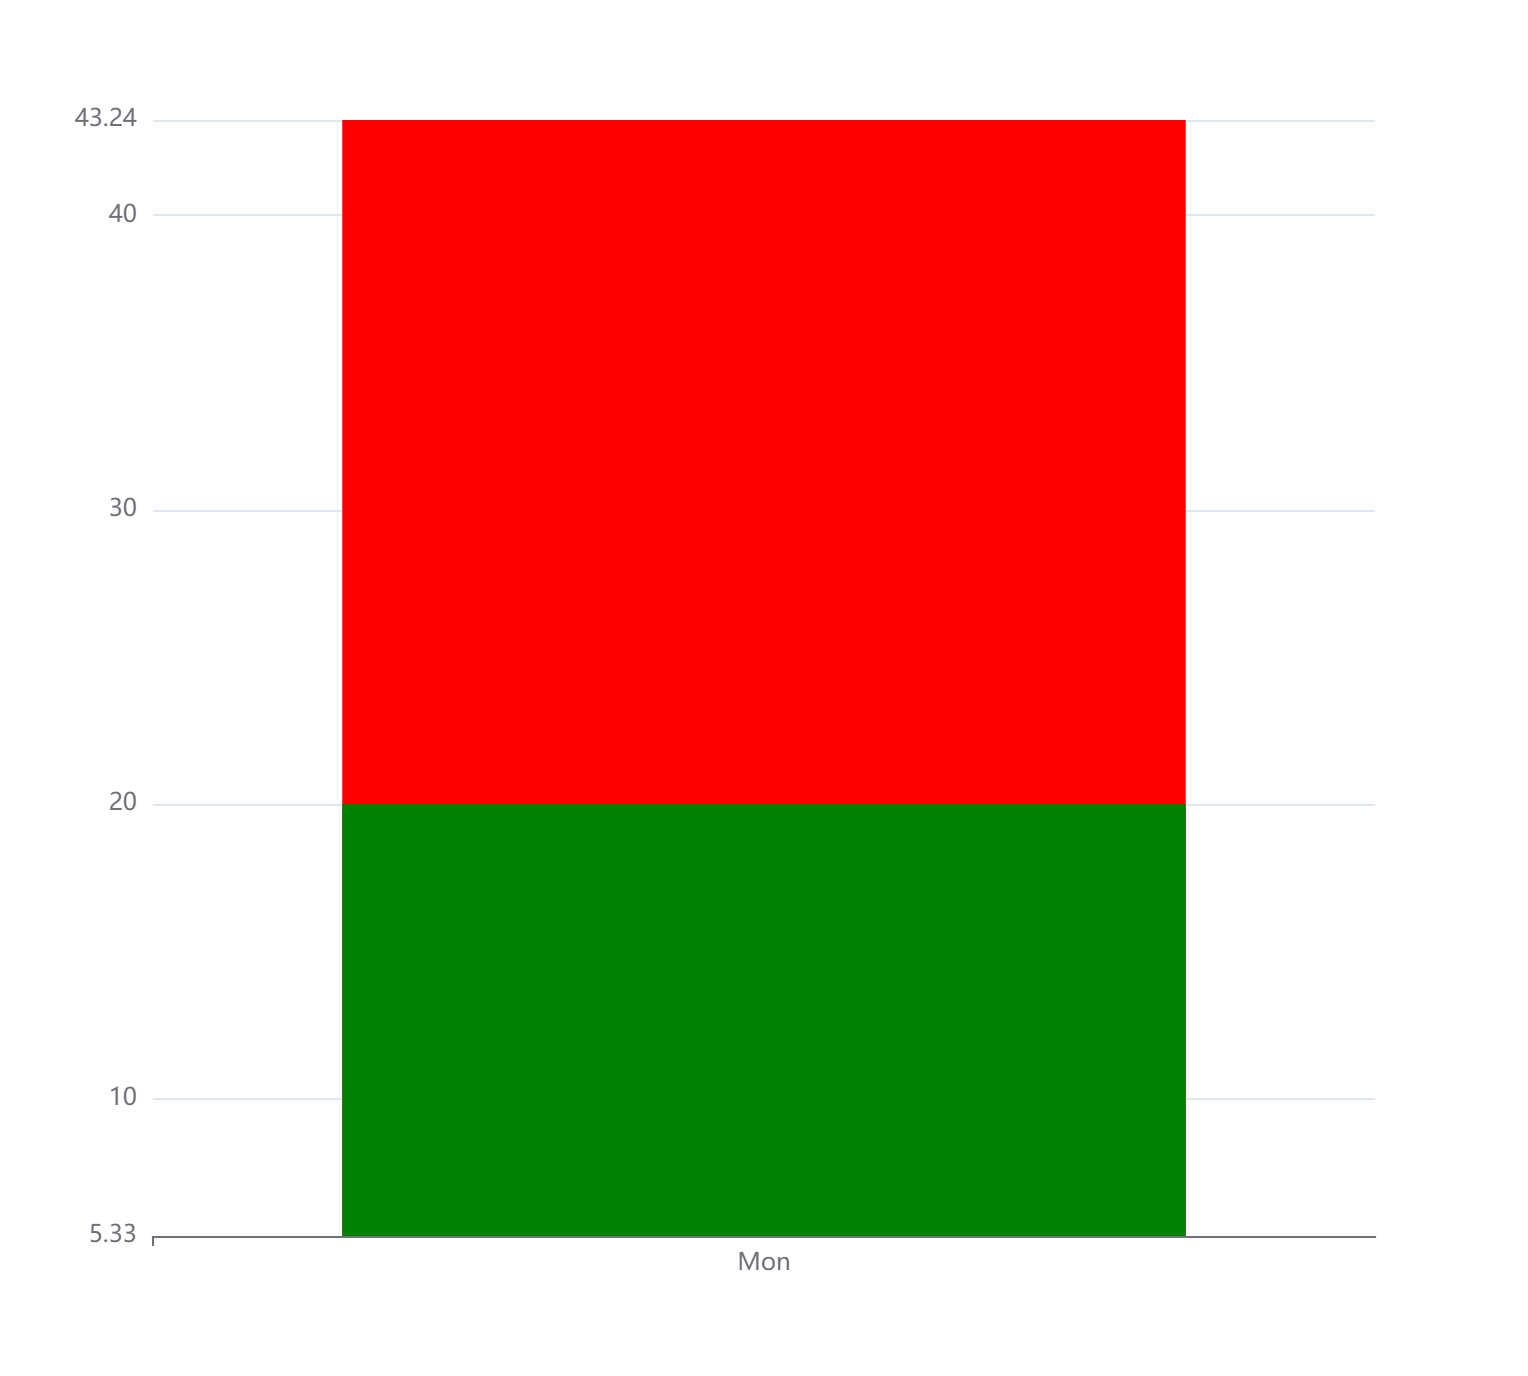 ### Expected Behavior Bars are not overlapping each other. In this example, only green bar is visible in the chart area. ### Environment ```markdown - OS: Windows 10. - Browser: Version 100.0.4896.75 (Official Build) (64-bit) - Framework: ``` ### Any additional comments? _No response_ -- This is an automated message from the Apache Git Service. To respond to the message, please log on to GitHub and use the URL above to go to the specific comment. To unsubscribe, e-mail: [email protected] For queries about this service, please contact Infrastructure at: [email protected] --------------------------------------------------------------------- To unsubscribe, e-mail: [email protected] For additional commands, e-mail: [email protected]