Github user revans2 commented on a diff in the pull request:
https://github.com/apache/storm/pull/850#discussion_r43937323
--- Diff: docs/documentation/storm-metrics-profiling-internal-actions.md ---
@@ -0,0 +1,70 @@
+# Storm Metrics for Profiling Various Storm Internal Actions
+
+With the addition of these metrics, Storm users can collect, view, and
analyze the performance of various internal actions. The actions that are
profiled include thrift rpc calls and http quests within the storm daemons. For
instance, in the Storm Nimbus daemon, the following thrift calls defined in the
Nimbus$Iface are profiled:
+
+- submitTopology
+- submitTopologyWithOpts
+- killTopology
+- killTopologyWithOpts
+- activate
+- deactivate
+- rebalance
+- setLogConfig
+- getLogConfig
+
+Various HTTP GET and POST requests are marked for profiling as well such
as the GET and POST requests for the Storm UI daemon (ui/core.cj)
+To implement these metrics the following packages are used:
+- io.dropwizard.metrics
+- metrics-clojure
+
+## How it works
+
+By using packages io.dropwizard.metrics and metrics-clojure (clojure
wrapper for the metrics Java API), we can mark functions to profile by
declaring (defmeter num-some-func-calls) and then adding the (mark!
num-some-func-calls) to where the function is invoked. For example:
+
+ (defmeter num-some-func-calls)
+ (defn some-func [args]
+ (mark! num-some-func-calls)
+ (body))
+
+What essentially the mark! API call does is increment a counter that
represents how many times a certain action occured. For instantanous
measurements user can use gauges. For example:
+
+ (defgauge nimbus:num-supervisors
+ (fn [] (.size (.supervisors (:storm-cluster-state nimbus) nil))))
+
+The above example will get the number of supervisors in the cluster. This
metric is not accumlative like one previously discussed.
+
+A metrics reporting server needs to also be activated to collect the
metrics. You can do this by calling the following function:
+
+ (defn start-metrics-reporters []
+ (jmx/start (jmx/reporter {})))
+
+## How to collect the metrics
+
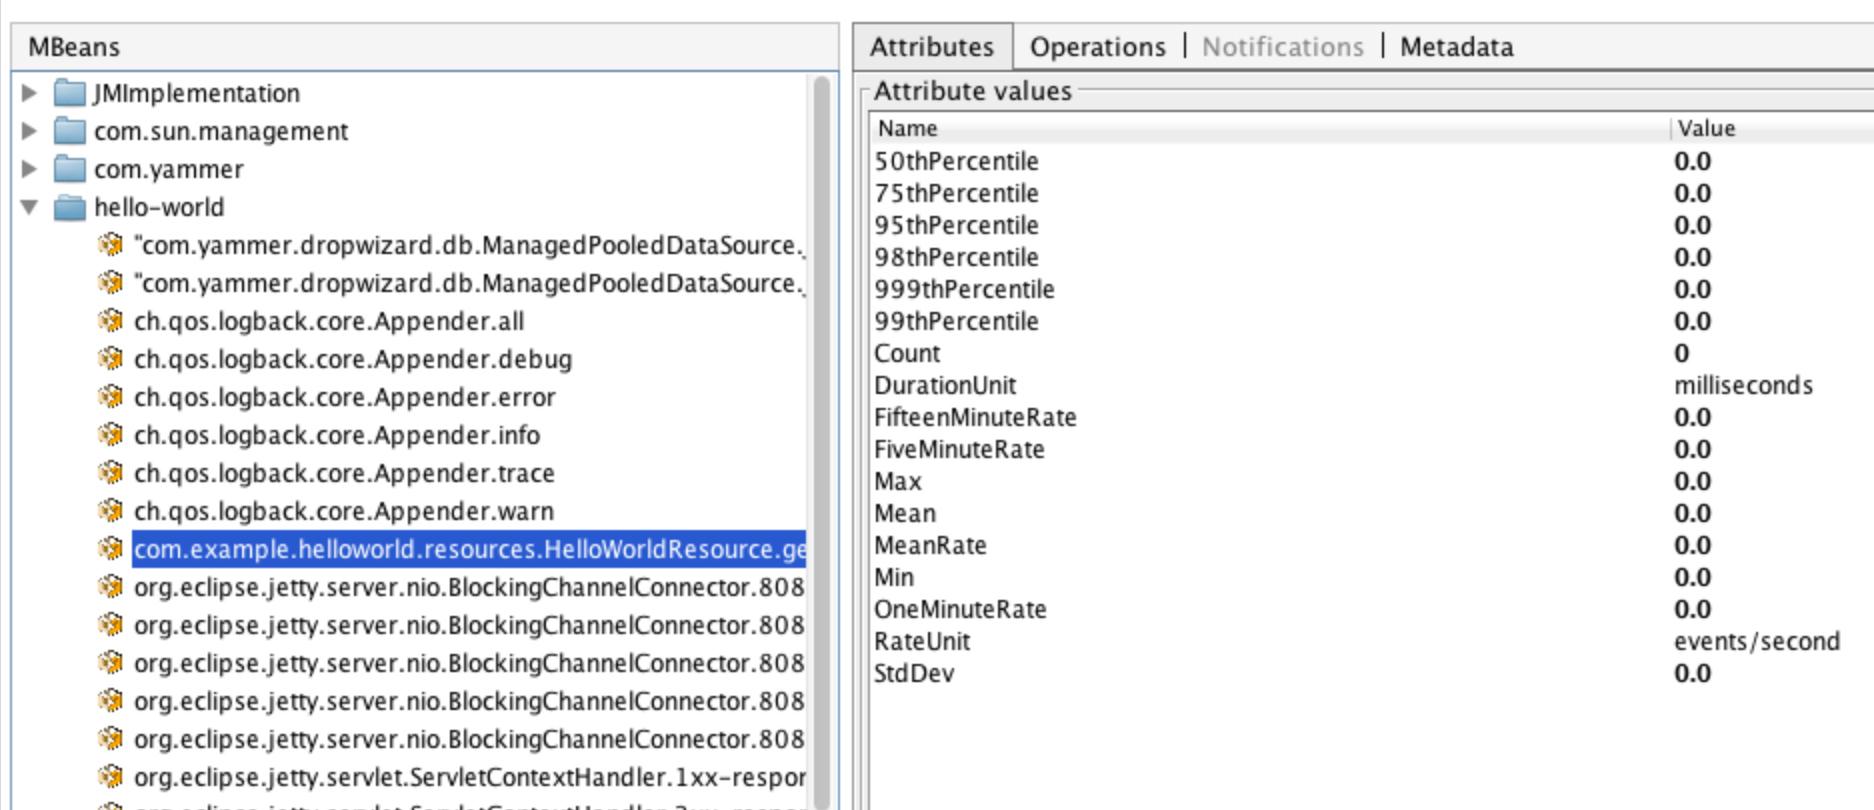
+Metrics can be reported via JMX or HTTP. A user can use JConsole or
VisualVM to connect to the jvm process and view the stats.
+
+To view the metrics in a GUI use VisualVM or JConsole. Screenshot of
using VisualVm for metrics:
+
+
--- End diff --
Can we host our own image instead of relying on an image on some external
server?
---
If your project is set up for it, you can reply to this email and have your
reply appear on GitHub as well. If your project does not have this feature
enabled and wishes so, or if the feature is enabled but not working, please
contact infrastructure at [email protected] or file a JIRA ticket
with INFRA.
---