Github user revans2 commented on the issue:
https://github.com/apache/storm/pull/2241
My benchmark results with Throughput Vs Latency.
A side note on testing methodology. I strongly disagree with some of the
statements made about testing methodology. I am happy to have a discussion
with anyone about why Throughput Vs Latency is the way it is. If we want to
file a separate JIRA, resolve these differences of opinion and come up with a
preferred methodology I am happy to. Just so that others understand my
methodology I want to summarize it here. An end user usually knows a few
things about what they want to build.
1. An estimated throughput range that the topology will need to handle.
2. A budget
3. An target latency after which the data is not good any more (or perhaps
more accurately a function that describes the drop in value for the data as it
ages aka an SLA/SLO).
As a user I want to be able to measure my topology and see what it is going
to cost me to achieve both 1 and 3, and if not what do I need to adjust to make
this work i.e. raise the budget because the data is important or live with
longer latency because the value does not drop off too fast. The Throughput Vs
Latency test is not intended to measure the maximum throughput that a topology
configuration can handle. It is intended to be a building block where you run
it multiple times varying the throughput and measuring the cost (CPU/Memory)
and latency at each throughput level. I'll leave it at that for now.
For this test I ran these on the same laptop I listed
[above](https://github.com/apache/storm/pull/2241#issuecomment-318102321). I
ran using 2 flavors of topology. I modified Throughput Vs Latency to let me
set the exact parallelism of all of the components.
* Flavor A has 1 acker 1 spout 1 split bolt 1 count bolt and a max spout
pending set to 1000. This was optimized for maximum throughput under STORM-2306
* Flavor B has 2 ackers 2 spouts 2 split bolts 3 counts bolts and a max
spout pending set to 1500. This was optimized for maximum throughput under
master (450ed63)
I ran all of these at different throughput values and against both versions
of storm to give a better apples to apples comparison. If a topology could not
keep up with the desired throughput I threw out the results, as the latency and
CPU used reported are invalid for that throughput. For these tests I am only
using CPU as a measure of cost, because I didn't have a simple way to compare
memory. I can if we really want to, but I didn't want to have to parse the gc
log files, and under STORM-2306 the system bolt's metrics are not being
reported any more which would have collected them automatically for me. For CPU
I logged the output from top and pulled out the CPU usage when the topology had
been running for 1 min.
RESULTS:
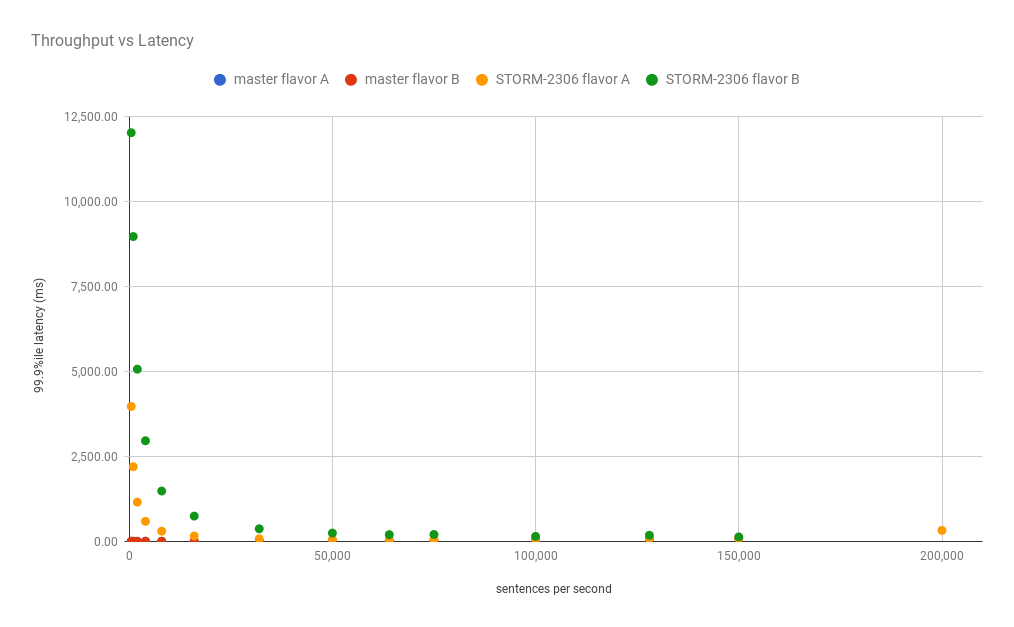
As was already discussed the latency at low throughput for STORM-2306 needs
to be addressed and can be seen here. But if we zoom into 1 second maximum
latency.
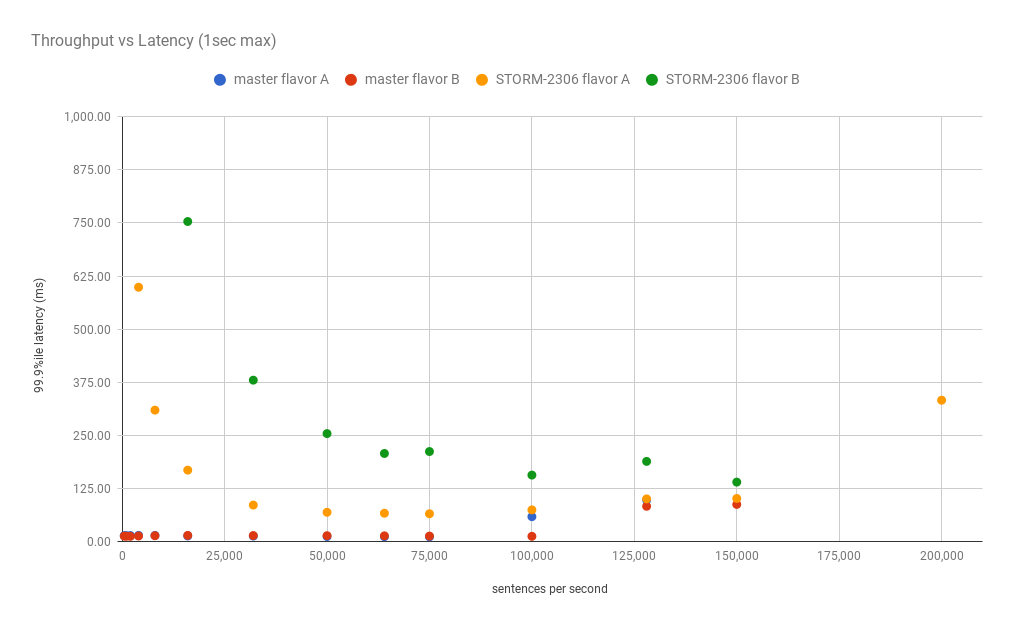
it is clearer to see what is happening at the low end. I also graphed the
throughput vs the cost (just CPU)
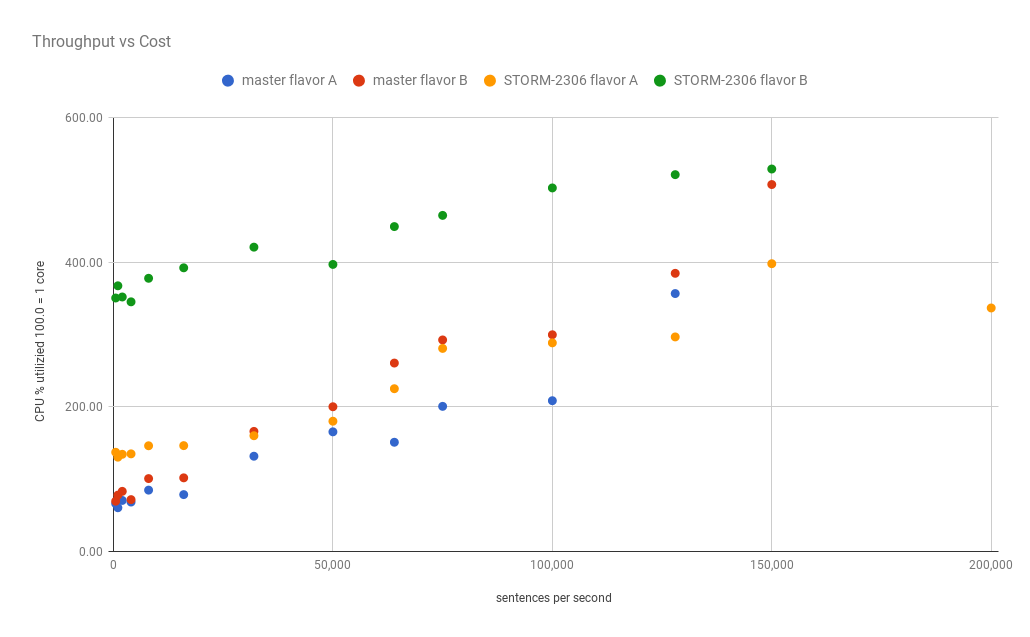
It is interesting, but I think it is more informative to see it as the
average cost to process 100 tuples per second.
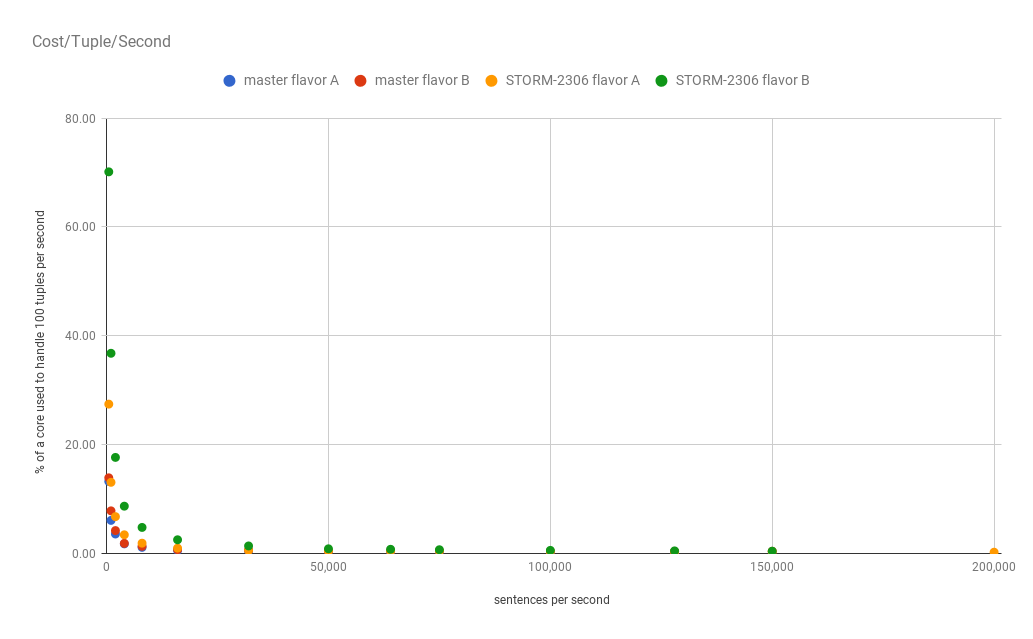
Again because of the low throughput issues it is helpful to zoom in on the
low end.
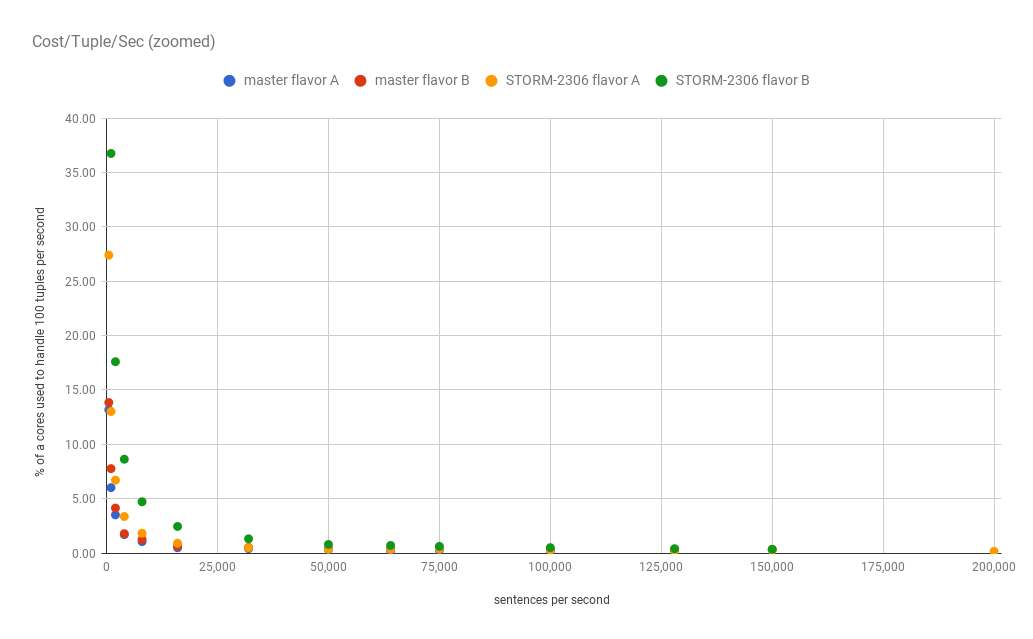
Here is the data that I used.
 | Latency ms | cores CPU | cost/100 tuple/sec | Latency ms | cores CPU |
cost/100 tuple/sec | Latency ms | cores CPU | cost/100 tuple/sec | Latency ms |
cores CPU | cost/100 tuple/sec
-- | -- | -- | -- | -- | -- | -- | -- | -- | -- | -- | -- | --
THROUGHPUT | master flavor A | master flavor A | master flavor A | master
flavor B | master flavor B | master flavor B | STORM-2306 flavor A | STORM-2306
flavor A | STORM-2306 flavor A | STORM-2306 flavor B | STORM-2306 flavor B |
STORM-2306 flavor B
500 | 14.26 | 65.90 | 13.18 | 13.20 | 69.24 | 13.85 | 3,978.30 | 137.00 |
27.40 | 12,029.30 | 350.60 | 70.12
1,000 | 14.38 | 60.20 | 6.02 | 12.76 | 77.69 | 7.77 | 2,206.20 | 130.20 |
13.02 | 8,975.81 | 367.50 | 36.75
2,000 | 14.52 | 70.31 | 3.52 | 12.58 | 82.89 | 4.14 | 1,163.92 | 134.20 |
6.71 | 5,075.11 | 352.00 | 17.60
4,000 | 14.91 | 68.09 | 1.70 | 13.39 | 71.44 | 1.79 | 598.74 | 134.80 |
3.37 | 2,969.57 | 345.30 | 8.63
8,000 | 14.84 | 84.58 | 1.06 | 14.07 | 100.56 | 1.26 | 309.59 | 146.00 |
1.83 | 1,491.08 | 377.90 | 4.72
16,000 | 13.56 | 78.38 | 0.49 | 14.90 | 101.59 | 0.63 | 168.43 | 146.20 |
0.91 | 753.40 | 392.40 | 2.45
32,000 | 13.20 | 131.52 | 0.41 | 14.55 | 165.90 | 0.52 | 86.18 | 159.90 |
0.50 | 380.11 | 421.00 | 1.32
50,000 | 12.20 | 165.29 | 0.33 | 14.25 | 200.03 | 0.40 | 69.21 | 180.00 |
0.36 | 254.41 | 397.10 | 0.79
64,000 | 11.81 | 150.86 | 0.24 | 13.85 | 260.52 | 0.41 | 66.98 | 225.00 |
0.35 | 207.62 | 449.50 | 0.70
75,000 | 11.50 | 200.56 | 0.27 | 13.29 | 292.54 | 0.39 | 65.80 | 280.80 |
0.37 | 212.21 | 465.00 | 0.62
100,000 | 58.92 | 208.41 | 0.21 | 12.66 | 299.70 | 0.30 | 74.91 | 288.50 |
0.29 | 156.76 | 503.00 | 0.50
128,000 | 97.91 | 356.76 | 0.28 | 83.36 | 384.78 | 0.30 | 100.79 | 296.70 |
0.23 | 189.01 | 521.40 | 0.41
150,000 | Â | Â | Â | 87.69 | 507.71 | 0.34 | 101.78 | 398.10 | 0.27 |
140.25 | 529.20 | 0.35
200,000 | Â | Â | Â | Â | Â | Â | 332.92 | 336.80 | 0.17 | Â | Â |
Â
I did run the tests at 256,000 sentences per second and at 300,000 but none
of the topologies could keep up. Master flavor A maxed out at 143k/sec and was
CPU bound (the acker could not keep up) Master and STORM-2306 flavor B both
maxed out at just under 200k. It could be argued that they could keep up with
200k so long as there never was a hickup, but I felt it better to exclude them.
STORM-2306 flavor A maxed out at about 223k. Or about a 12% increase in the
maximum throughput possible on master.
---
If your project is set up for it, you can reply to this email and have your
reply appear on GitHub as well. If your project does not have this feature
enabled and wishes so, or if the feature is enabled but not working, please
contact infrastructure at [email protected] or file a JIRA ticket
with INFRA.
---