vlandham opened a new pull request #3864: WIP: Start of Categorical Scatterplot URL: https://github.com/apache/incubator-superset/pull/3864 This is the start of a 'Categorical Scatterplot' or catscat for short. It provides a very basic starting point for building a scatterplot that: * has an x-axis as a categorical variable * can use a metric to define the point shape * can draw additional threshold lines on it. 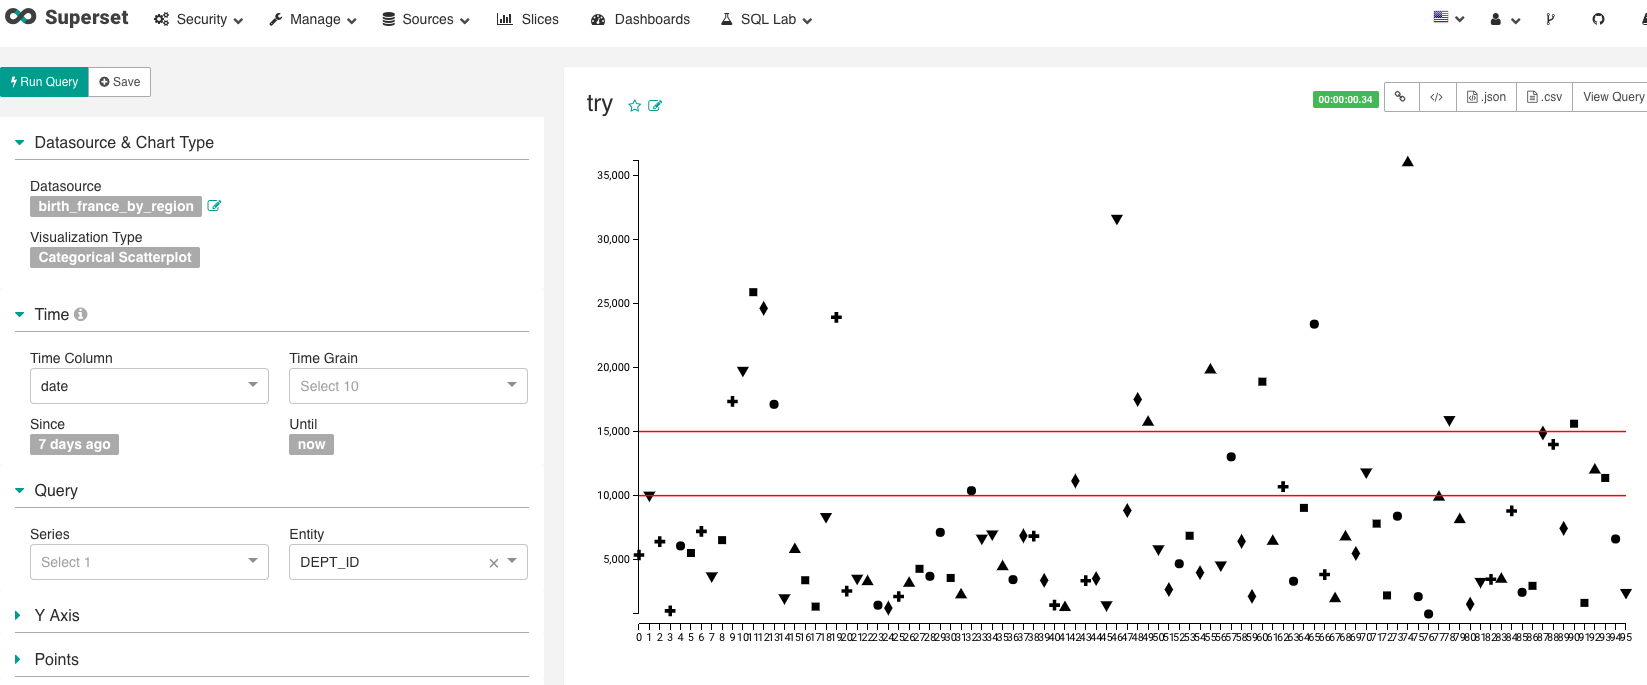 The image above is the use of the catscat chart on Superset provided dummy data. An incomplete list of Open questions we need to figure out before this is ready to go. Most are a trade-off between time and capabilities: * What side controls are needed for appropriate grouping? Should we try to reuse the existing controls from the bubble chart (which i find confusing) or build out our own? * How should color-by work? does it need to be added to the `groupby` in the query, or can it be based on a metric or column value? * Do we need "sort by" capabilities? Should this be part of the query - or done in the visualization? * what customization controls are needed for configuring the x-axis? Should we provide support for tick customization? * what customization controls are needed for configuring the y-axis? * what customization controls are needed for configuring the thresholds? Do we need to allow inputing color? thickness? other attributes? * what level of interaction is required. Do we need mouse-over tooltips on dots?
----------------------------------------------------------------
This is an automated message from the Apache Git Service.
To respond to the message, please log on GitHub and use the
URL above to go to the specific comment.

For queries about this service, please contact Infrastructure at:
[email protected]


With regards,
Apache Git Services