---
 user/index.rst                 |   2 +
 user/tracing/captureengine.rst | 184 ++++++++++++++++++++++++++
 user/tracing/examples.rst      |  12 ++
 user/tracing/index.rst         |  29 +++++
 user/tracing/introduction.rst  | 182 ++++++++++++++++++++++++++
 user/tracing/tracelinker.rst   | 287 +++++++++++++++++++++++++++++++++++++++++
 user/tracing/usecases.rst      | 117 +++++++++++++++++
 7 files changed, 813 insertions(+)
 create mode 100644 user/tracing/captureengine.rst
 create mode 100644 user/tracing/examples.rst
 create mode 100644 user/tracing/index.rst
 create mode 100644 user/tracing/introduction.rst
 create mode 100644 user/tracing/tracelinker.rst
 create mode 100644 user/tracing/usecases.rst
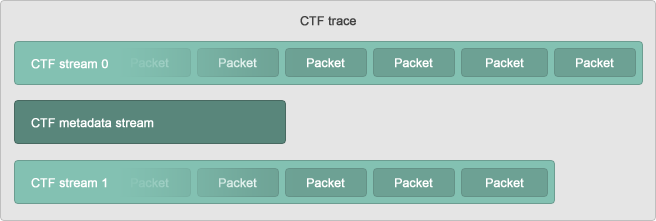
diff --git a/user/index.rst b/user/index.rst
index 8cbcd1b..a764fe8 100644
--- a/user/index.rst
+++ b/user/index.rst
@@ -52,6 +52,8 @@ to the Community Project hosted at http://www.rtems.org/.

        tools/index

+        tracing/index
+
        support/index

        glossary/index
diff --git a/user/tracing/captureengine.rst b/user/tracing/captureengine.rst
new file mode 100644
index 0000000..64b501a
--- /dev/null
+++ b/user/tracing/captureengine.rst
@@ -0,0 +1,184 @@
+.. comment SPDX-License-Identifier: CC-BY-SA-4.0
+
+.. comment: Copyright (c) 2016 Chris Johns <chr...@rtems.org>
+.. comment: All rights reserved.
+
+.. _capturengine:
+
+Capture Engine
+**************
+
+Capture Engine is a trace tool built inside the RTEMS operating system.
Capture
+Engine is designed to cause the lowest load on the system when operating. Hence
+it does not effect RTEMS when operating or when disabled. It binds to RTEMS at
+runtime and does not require RTEMS or your application to be rebuilt in order
+to use it.
+
+The Capture Engine's sample testcase for the `sparc/erc32` is available in the
+"$HOME/development/rtems/kernel/erc32/sparc-rtems5/c/erc32/testsuites/samples"
+directory, provided you followed the installation directions of the quickstart
+section. In order to access the capture testcase perform the following set of
+operations.
+
+.. code-block:: shell
+
+  $ cd
+  $HOME/development/rtems/kernel/erc32/sparc-rtems5/c/erc32/testsuites/samples
+  $ ../samples
+  $ sparc-rtems5-run ./capture.exe
+
+
+  *** BEGIN OF TEST CAPTURE ENGINE ***
+  *** TEST VERSION: 5.0.0.de9b7d712bf5da6593386fd4fbca0d5f8b8431d8
+  *** TEST STATE: USER_INPUT
+  *** TEST BUILD: RTEMS_NETWORKING RTEMS_POSIX_API
+  *** TEST TOOLS: 7.3.0 20180125 (RTEMS 5, RSB
+  a3a6c34c150a357e57769a26a460c475e188438f, Newlib 3.0.0)
+  Press any key to start capture engine (20s remaining)
+  Press any key to start capture engine (19s remaining)
+  Press any key to start capture engine (18s remaining)
+
+  Monitor ready, press enter to login.
+
+  1-rtems $
+
+Capture Engine comes with a set of commands to perform various actions.
+
+Capture Engine Commands
+-----------------------
+
+1) ``copen <buffer-size>``: Used to initialize the Capture Engine with the
+   trace buffer size in bytes. By default the Capture Engine is not
initialized
+   and not running.
+
+2) ``cwceil <priority-value>``: Capture Engine filter used to put an upper
+   limit on the event priority to be captured.
+
+
+3) ``cwfloor <priority-value>``: Capture Engine filter used to put a lower
+   limit on the event priority to be captured.
+
+
+4) ``cwglob <on/off>``: Enable or disable the global watch.
+
+
+5) ``cenable``: Enables the Capture Engine. Capture Engine is by default
+   disabled after being opened.
+
+
+6) ``cdisable``: Disables the Capture Engine.
+
+
+7) ``ctlist``: Lists the watch and trigger configurations.
+
+
+8) ``ctrace``: Dumps the recorded traces. By default this command displays 24
+   trace records. Repeated use of this command will display all the recorded
+   traces.
+
+9) ``cwadd <task-name>``: Add watch on a particular task.
+
+
+10) ``cwtctl <task-name> <on/off>``: Enable or disable watch on a particular
+    task.
+
+
+11) ``ctset``: Used to set a trigger. The general form of the command is:
+
+``ctset [-?] type [to name/id] [from] [from name/id]``
+
+'type' in the above command refers to the type of trigger needed. The types of
+triggers that currently exist
+are:
+
+- switch  : a context switch from one task to another task
+- create  : the executing task creates a task
+- start   : the executing task starts a task
+- restart : the executing task restarts a task
+- delete  : the executing task deletes a task
+- begin   : a task is beginning
+- exitted : a task is exitting
+
+Example
+-------
+
+The following is a sample run of the capture testsuite. The test1 command on
the
+Capture Engine Command Line Interface (CLI) makes the 'RMON' task invoke a
call
+to the 'capture_test_1()' command. This function (in the 'test1.c' source code)
+creates and starts three tasks : 'CT1a', 'CT1b' and 'CT1c'. These tasks are
+passed the object id of a semaphore as a task argument. This run through traces
+the context switches between these tasks. ``cwceil`` and ``cwfloor`` are set
to
+a narrow range of task priorities to avoid creating noise from a large number
of
+context switches between tasks we are not interested in.
+
+.. code:: shell
+
+  *** BEGIN OF TEST CAPTURE ENGINE ***
+  *** TEST VERSION: 5.0.0.de9b7d712bf5da6593386fd4fbca0d5f8b8431d8
+  *** TEST STATE: USER_INPUT
+  *** TEST BUILD: RTEMS_NETWORKING RTEMS_POSIX_API
+  *** TEST TOOLS: 7.3.0 20180125 (RTEMS 5, RSB
+  a3a6c34c150a357e57769a26a460c475e188438f, Newlib 3.0.0)
+  Press any key to start capture engine (20s remaining)
+  Press any key to start capture engine (19s remaining)
+  Press any key to start capture engine (18s remaining)
+  Press any key to start capture engine (17s remaining)
+
+  Monitor ready, press enter to login.
+
+  1-rtems $ copen 50000
+  capture engine opened.
+  1-rtems $ cwceil 100
+  watch ceiling is 100.
+  1-rtems $ cwfloor 102
+  watch floor is 102.
+  1-rtems $ cwglob on
+  global watch enabled.
+  1-rtems $ ctset RMON
+  trigger set.
+  1-rtems $ cenable
+  capture engine enabled.
+  1-rtems $ test1
+  1-rtems $ cdisable
+  capture engine disabled.
+  1-rtems $ ctrace
+  0 0:18:17.462314124           0a010003 CT1a 102 102 102   4096  TASK_RECORD
+  0 0:18:17.462398963         0 0a010003 CT1a 102 102             CREATED
+  0 0:18:17.462647987    249024 0a010003 CT1a 102 102             STARTED
+  0 0:18:17.462904334    256347 0a010003 CT1a 102 102             SWITCHED_IN
+  0 0:18:17.463069129    164795 0a010003 CT1a 102 102             BEGIN
+  0 0:18:17.463335853    266724 0a010003 CT1a 102 102             SWITCHED_OUT
+  0 0:18:18.461348547           0a010004 CT1b 101 101 101   4096  TASK_RECORD
+  0 0:18:18.461433997 998098144 0a010004 CT1b 101 101             CREATED
+  0 0:18:18.461683631    249634 0a010004 CT1b 101 101             STARTED
+  0 0:18:18.461934485    250854 0a010004 CT1b 101 101             SWITCHED_IN
+  0 0:18:18.462099891    165406 0a010004 CT1b 101 101             BEGIN
+  0 0:18:19.460935339 998835448 0a010004 CT1b 101 101             SWITCHED_OUT
+  0 0:18:19.461431555           0a010005 CT1c 100 100 100   4096  TASK_RECORD
+  0 0:18:19.461516394    581055 0a010005 CT1c 100 100             CREATED
+  0 0:18:19.461765418    249024 0a010005 CT1c 100 100             STARTED
+  0 0:18:19.462019324    253906 0a010005 CT1c 100 100             SWITCHED_IN
+  0 0:18:19.462184119    164795 0a010005 CT1c 100 100             BEGIN
+  0 0:18:19.462475257    291138 0a010005 CT1c 100 100             SWITCHED_OUT
+  0 0:18:19.462551551     76294 0a010004 CT1b 101 101             SWITCHED_IN
+  0 0:18:19.960935645 498384094 0a010004 CT1b 101 101             SWITCHED_OUT
+  0 0:18:19.961012549     76904 0a010003 CT1a 102 100             SWITCHED_IN
+  0 0:18:19.961341528    328979 0a010003 CT1a 102 102             SWITCHED_OUT
+  1-rtems $ ctrace
+  0 0:18:19.961418433         0 0a010005 CT1c 100 100             SWITCHED_IN
+  0 0:18:19.961672339    253906 0a010005 CT1c 100 100             SWITCHED_OUT
+  0 0:18:19.961749854     77515 0a010004 CT1b 101 101             SWITCHED_IN
+  0 0:18:20.460967077 499217223 0a010004 CT1b 101 101             SWITCHED_OUT
+  0 0:18:20.461219763    252686 0a010005 CT1c 100 100             SWITCHED_IN
+  0 0:18:20.461424231    204468 0a010005 CT1c 100 100             TERMINATED
+  0 0:18:20.461747107    322876 0a010005 CT1c 100 100             SWITCHED_OUT
+  0 0:18:20.461824011     76904 0a010004 CT1b 101 101             SWITCHED_IN
+  0 0:18:20.462015052    191041 0a010004 CT1b 101 101             TERMINATED
+  0 0:18:20.462336707    321655 0a010004 CT1b 101 101             SWITCHED_OUT
+  0 0:18:20.462414222     77515 0a010003 CT1a 102 102             SWITCHED_IN
+  0 0:18:20.462608924    194702 0a010003 CT1a 102 102             TERMINATED
+  0 0:18:20.462933021    324097 0a010003 CT1a 102 102             SWITCHED_OUT
+  1-rtems $ ctrace
+  1-rtems $
+
+
diff --git a/user/tracing/examples.rst b/user/tracing/examples.rst
new file mode 100644
index 0000000..f51613e
--- /dev/null
+++ b/user/tracing/examples.rst
@@ -0,0 +1,12 @@
+.. comment SPDX-License-Identifier: CC-BY-SA-4.0
+
+.. comment: Copyright (c) 2016 Chris Johns <chr...@rtems.org>
+.. comment: All rights reserved.
+
+.. _examples:
+
+Tracing Examples
+****************
+
+[TBD]
+
diff --git a/user/tracing/index.rst b/user/tracing/index.rst
new file mode 100644
index 0000000..951ead2
--- /dev/null
+++ b/user/tracing/index.rst
@@ -0,0 +1,29 @@
+.. comment SPDX-License-Identifier: CC-BY-SA-4.0
+
+.. comment: Copyright (c) 2016 Chris Johns <chr...@rtems.org>
+.. comment: All rights reserved.
+
+.. _tracing-framework:
+
+RTEMS Tracing Framework
+***********************
+.. index:: Tracing Framework
+
+RTEMS Tracing Framework is an on-target software based system which helps track
+the ongoings inside applications, 3rd party packages, and the kernel in real
+time.
+
+Software based tracing is a complex process which requires components on both
+the target and the host to work together. However its portability across all
+architectures and board support packages makes it a useful asset. A key
+requirement in RTEMS trace process is to take existing code in compiled format
+(ELF) and instrument it in order to log various events and records in real
time.
+However instrumenting of the code for tracing should happen without rebuilding
+the code from the source and without annotating the source with trace code.
+
+.. toctree::
+
+   introduction
+   usecases
+   examples
+
diff --git a/user/tracing/introduction.rst b/user/tracing/introduction.rst
new file mode 100644
index 0000000..640eb0c
--- /dev/null
+++ b/user/tracing/introduction.rst
@@ -0,0 +1,182 @@
+.. comment SPDX-License-Identifier: CC-BY-SA-4.0
+
+.. comment: Copyright (c) 2016 Chris Johns <chr...@rtems.org>
+.. comment: All rights reserved.
+
+.. _introduction:
+
+Introduction to Tracing
+***********************
+
+Tracing is an important function which has several applications including
+identification of complex threading, detection of deadlocks, tracing
+functions along with their argument values, and return values through
+progression of several function calls and audit the performance of an
+application according to required specifications.
+
+RTEMS tracing framework is under development and welcomes contribution by
users.
+
+RTEMS has the following trace components:
+
+- RTEMS :ref:`tracelinker`
+- RTEMS :ref:`capturengine`
+- Common Trace Format Integration
+
+
+RTEMS trace framework can currently function using the following methods. Both
+of the methods make use of the :ref:`tracelinker` :
+
+.. _tracebuffering:
+
+RTEMS Trace Using Trace Buffering
+=================================
+
+This scheme of tracing goes through the flow of events described in a
+subsequent flowchart:
+
+Step 1: The user creates an application and user configuration file. The
+configuration file specifies the use of the trace buffer generator and other
+standard initializations. The user then configures her BSP and invokes the
+trace linker using a command to link the application executable. The trace
+linker uses the application files in compiled format (ELF) and the libraries
+used to build the application for performing this link.
+
+Step 2: The RTEMS Trace Linker reads the user???s configuration file and that
+results in it reading the standard Trace Buffering Configuration files
+installed with the RTEMS Trace Linker. The trace linker uses the target
+compiler and linker to create the trace enabled application executable. It
+wraps the functions defined in the user???s configuration with code that
captures
+trace records into the statically allocated buffer. The trace wrapper code is
+compiled with the target compiler and the resulting ELF object file is added to
+the standard link command line used to link the application and the application
+is re-linked using the wrapping option of the GNU linker.
+
+Step 3: The trace linker creates an executable which is capable of running on
+the target hardware or simulator.
+
+Step 4: RTEMS shell provides the ???rtrace??? command to display and save trace
+buffers.
+
+.. comment: taken from https://devel.rtems.org/wiki/Developer/Tracing
+.. figure:: ../../images/user/rtems-trace-buffering.png
+  :align: center
+  :width: 75%
+
+
+.. _printk:
+
+RTEMS Trace Using Printk
+========================
+
+This scheme of tracing goes through the flow of events described in a
subsequent
+flowchart:
+
+Step 1: The user creates an RTEMS application in the normal manner as well as a
+Trace Linker configuration file. The configuration file specifies using the
+Printk trace mode and the functions to trace. The user invokes the Trace Linker
+with the configuration and the normal link command line used to the link the
+application executable. The application ELF object files and libraries,
+including the RTEMS libraries are standard and do not need to be built
+specially.
+
+Step 2: The RTEMS Trace Linker reads the user's configuration file and that
+results in it reading the standard Printk Trace Configuration files installed
+with the RTEMS Trace Linker. The trace linker uses the target compiler and
+linker to create the trace enabled application executable. It wraps the
+functions defined in the user's configuration with code that prints the entry
+with arguments and exit and return value if any. The trace wrapper code is
+compiled with the target compiler and the resulting ELF object file is added to
+the standard link command line used to link the application and the application
+is relinked using the wrapping option of the GNU linker.
+
+Step 3: The trace linker creates and RTEMS ELF executable that can be run on
the
+target hardware or simulator.
+
+Step 4: The application is run in the hardware directly or using a debugger.
The
+printk() output appears on the target console and the user can save that to a
file.
+
+.. comment: taken from https://devel.rtems.org/wiki/Developer/Tracing
+.. figure:: ../../images/user/rtems-trace-printk.png
+  :align: center
+  :width: 75%
+
+The :ref:`examples` section describes generation of traces using both of the
+aforementioned techniques using the `fileio` testsuite available with RTEMS
+installation.
+
+RTEMS Trace Using CTF
+=====================
+
+`Common Trace Format <http://diamon.org/ctf/>`_ (CTF) is a binary trace format
+which is fast to write and has great flexibility. It allows traces to be
+developed by bare-metal applications or by any other C/C++ system. RTEMS
tracing
+framework can benefit from these features of CTF.
+
+A typical CTF *trace* consists of multiple *streams* of binary *events*. The
+*metadata* stream is a mandatory stream which describes the layout of all the
+other streams in a trace. This metadata stream is written using *Trace Stream
+Description Language* (TSDL).
+
+.. comment: image taken from
view-source:http://diamon.org/ctf/img/ctf-trace.png
+.. comment: Not generating a copyright in the high chance we decide to not
keep
+.. comment: a descriptive section on CTF
+
+.. figure:: ../../images/user/ctf-trace.png
+  :align: center
+  :width: 75%
+
+A binary *stream* is further a concatenation of several packets each
containing
+the following:
+
+- A packet header
+- An optional packet context
+- A set of concatenated events each containing:
+ - An event header
+ - A stream-specific context
+ - An event-specific context
+ - A payload
+
+.. comment: taken from http://diamon.org/ctf/img/ctf-stream-packet.png
+.. comment: Not generating a copyright in the high chance we decide to not
keep
+.. comment: a descriptive section on CTF
+
+.. figure:: ../../images/user/ctf-stream-packet.png
+  :align: center
+  :width: 75%
+
+All the headers, contexts and payloads are written in TSDL using CTF data
types.
+CTF supports a rich set of configurable datatypes which makes it possible to
+describe a larger variety of binary structure. Moreover types in CTF are
+organized as type classes where type specifications can be inherited to allow
+deriving types. These factors make CTF flexible. CTF enables fast writing of
+binary data as it usually involves appending memory contents, as it is to a
+binary CTF stream. CTF streams are capable of being sent or received over the
+network without any data being written to disk and hence can be useful in
+transporting traces from the target to the host machine for analysis.
+
+Due to these advantages tracing using CTF will prove to be beneficial for the
+users. This method of tracing is currently under development. Currently the
+RTEMS tracing framework is able to output trace data in the form of trace
+buffers, console output and csv files. A conversion tool which transforms
+these trace output formats to CTF will be viable approach to generating CTF
+traces. In this regard we utilize babeltrace, which is described in the
+following section.
+
+Babeltrace
+----------
+
+Babeltrace is an open source trace format converter which can be used to
convert
+RTEMS traces into CTF. It is also a reference parser implementation of CTF.
Babeltrace
+currently supports the following output formats for traces:
+
+- Text
+- CTF
+- CTF-metadata
+- Dummy
+- lttng-live
+
+Babeltrace comes in the form of a library, python bindings (python3) and
command line
+tool called ``babeltrace``. To install babeltrace on your host you can install
a
+distribution package or build from source using tarballs or git repositories of
+babeltrace. Refer to http://diamon.org/babeltrace/ for further details.
+
diff --git a/user/tracing/tracelinker.rst b/user/tracing/tracelinker.rst
new file mode 100644
index 0000000..3340794
--- /dev/null
+++ b/user/tracing/tracelinker.rst
@@ -0,0 +1,287 @@
+.. comment SPDX-License-Identifier: CC-BY-SA-4.0
+
+.. comment: Copyright (c) 2016 Chris Johns <chr...@rtems.org>
+.. comment: All rights reserved.
+
+.. _tracelinker:
+
+Trace Linker
+************
+
+RTEMS trace linker is a post link tool central to the RTEMS trace framework.
It
+is installed as a part of the RTEMS Tool Project.The RTEMS Trace Linker is a
+post link tool that performs a re-link of your application to produce a trace
+executable. A trace executable has been instrumented by the RTEMS Trace Linker
+with additional code that implements software tracing. A key requirement of the
+trace process in RTEMS is to take existing code in a compiled format (ELF) and
+instrument it without rebuilding that code from source and without annotating
+that source with trace code.
+
+
+Command Line
+============
+
+A typical command to invoke the trace linker consists of two parts separated
by
+``--``.  The first part controls the trace linker and provides the various
+options it needs and the second part is a standard linker command line you
would
+use to link an RTEMS application. The current command line for trace linker
consists
+of:
+
+.. code-block:: shell
+
+  $ rtems-tld -h
+  rtems-trace-ld [options] objects
+  Options and arguments:
+   -h          : help (also --help)
+   -V          : print linker version number and exit (also --version)
+   -v          : verbose (trace import parts), can supply multiple times
+                 to increase verbosity (also --verbose)
+   -w          : generate warnings (also --warn)
+   -k          : keep temporary files (also --keep)
+   -c compiler : target compiler is not standard (also --compiler)
+   -l linker   : target linker is not standard (also --linker)
+   -E prefix   : the RTEMS tool prefix (also --exec-prefix)
+   -f cflags   : C compiler flags (also --cflags)
+   -r path     : RTEMS path (also --rtems)
+   -B bsp      : RTEMS arch/bsp (also --rtems-bsp)
+   -W wrapper  : wrapper file name without ext (also --wrapper)
+   -C ini      : user configuration INI file (also --config)
+   -P path     : user configuration INI file search path (also --path)
+
+The trace linker generates code that needs to be compiled and linked to the
+application executable so it needs to know the target compiler and `CFLAGS`.
+There are a couple of ways to do this. The simplest is to provide the path to
+RTEMS using the `-r` option and the architecture and BSP name in the standard
+RTEMS format of arch/bsp. The trace linker will extract the compiler and flags
+used to build RTEMS and will use them. If you require specific options you can
+use the `-f`, `-c`, `-l` and `-E` options to provide them. If the functions you
+are tracing use types from your code then add the include path to the `CFLAGS`.
+
+The trace linker requires you to provide a user configuration file using the
+`-C` or ``--config`` option. This is an INI format file detailed in the
+Configuration section. You can also provide an INI file search path using the
+`-P` option.
+
+If you are working with new configuration files and you want to view the files
+the trace linker generates add the `-k` option to keep the temporary files, and
+`-W` to specify an explicit wrapper C file name. If you set the
+``dump-on-error`` option in the configuration options section you will get a
+dump of the configuration on an error.
+
+
+Configuration (INI) files
+=========================
+
+The Trace Linker is controlled using configuration files. Configuration files
+are categorized into 3 types:
+
+- User Configuration: These are specific to the user application to be traced.
+  This file initializes the values of the trace generator, triggers, enables
and
+  traces.
+
+- Tracer Configuration: These are like a library of common or base trace
+  functions that can be referenced by an application. These files tend to hold
+  the details needed to wrap a specific set of functions. Examples provided
with
+  the RTEMS Linker are the RTEMS API and Libc.
+
+- Generator Configuration: This is used to encapsulate a specific method of
+  tracing. Rtems currently provides generators for trace buffering, printk and
+  printf.
+
+The configuration files are in the *INI file format* which is composed of
+`sections`. Each section has a section name and set of *keys* which consist of
+*names* and *values*. A typical key is of the form ``name=value``. Keys can be
+used to include other INI files using the include key name. This is shown in
the
+following example where the values indicate rtems and rtld-base configuration
files:
+
+.. code-block::shell
+  include = rtems.ini, rtld-base.ini
+
+The trace linker also uses values in keys to specify other sections. In this
+example the functions name lists test-trace-funcs and that section contains a
headers
+key that references a further section test-headers:
+
+.. code-block::shell
+  functions = test-trace-funcs, rtems-api
+
+  [test-trace-funcs]
+  ; Parsed via the 'function-set', not parse as a 'trace'.
+  headers = test-headers
+
+  [test-headers]
+  header = '#include "test-trace-1.h"'
+
+The format of a configuration file is explained next. Snippets of the
fileio-trace.ini
+file have been used for explicit understanding. This file can be downloaded
from `here
+<https://devel.rtems.org/attachment/wiki/Developer/Tracing/Trace_Buffering/filei
+o-trace.ini>`_.
+
+Tracer Section
+--------------
+
+The topmost level section is the ``tracer`` section. It can contains the
+following keys:
+
+- name: The name of trace being linked.
+
+- options: A list of option sections.
+
+- defines: A list of sections containing defines or define record.
+
+- define: A list of define string that are single or double quoted.
+
+- enables: The list of sections containing enabled functions to trace.
+
+- triggers: The list of sections containing enabled functions to trigger trace
+  on.
+
+- traces: The list of sections containing function lists to trace.
+
+- functions: The list of sections containing function details.
+
+- include: The list of files to include
+
+
+.. code-block:: shell
+  [tracer]
+  name = File IO tracer
+  ;
+  ; The configuration
+  ;
+  options = fileio-options
+  traces = fileio
+  defines = fileio
+  enables = fileio
+  triggers = fileio
+  functions = fileio-funcs, rtems-api, rtems-posix, libc-heap
+  include = rtems.ini, rtld-base.ini, rtld-trace-buffer.ini, libc-heap.ini
+
+
+Options section
+---------------
+
+The options section in the fileio-trace.ini is called the `fileio-options`. A
+general options section can contain following sets of keys:
+
+- dump-on-error: Dump the parsed configuration data on error. The value can be
+  true or false.
+
+- verbose: Set the verbose level. The value can be true or a number value.
+
+- prefix: The prefix for the tools and an install RTEMS if rtems-path is not
+  set.
+
+- cc: The compiler used to compile the generated wrapper code. Overrides the
+  BSP configuration value if a BSP
+  is specified.
+
+- ld: The linker used to link the application. The default is the cc value as
+  read from the BSP configuration if specificed. If your application contains
+  C++ code use this setting to the change the linker to g++.
+
+- cflags: Set the CFLAGS used to compiler the wrapper. These flags are
+  pre-pended to the BSP read flags if a BSP is specified. This option is used
+  to provide extra include paths to header files in your application that
+  contain types any functions being traced reference.
+
+- rtems-path: The path to an install RTEMS if not installed under the prefix.
+
+- rtems-bsp: The BSP we are building the trace executable for. The is an arch
+  and bsp pair. For example sparc/erc32.
+
+.. code-block:: shell
+
+  [fileio-options]
+  dump-on-error = true
+  ;
+  ; Tools
+  ;
+  prefix = /development/rtems/5
+  rtems-path = /development/rtems/kernel/5
+  rtems-bsp = sparc/erc32
+  ;
+  ; Generator options.
+  ;
+  gen-enables = enable
+  gen-triggers = enable
+
+
+Trace Section
+--------------
+
+A trace section defines how trace wrapper functions are built. To build a
trace
+function that wraps an existing function in an ELF object file or library
+archive we need to have the function's signature. A signature is the function's
+declaration with any types used. The the signature has specific types we need
+access to those types which means the wrapper code needs to include header
files
+that define those types. There may also be specific defines needed to access
+those types.
+
+- generator: The generator defines the type of tracing being used.
+
+- headers: List of sections that contain header files keys.
+
+- header: A header key. Typically the include code.
+
+- defines: List of sections that contain defines.
+
+- define: A define key. Typically the define code.
+
+- signatures: List of function signature sections.
+
+- trace: Functions that are instrumented with trace code.
+
+
+[TBD]
+
+
+Function Wrapping
+=================
+
+The trace linker's major role is to wrap functions in the existing executable
+with trace code. The directions on how to wrap application functions is
provided
+by the generator configuration. The wrapping function uses a GNU linker option
+called --wrap=symbol. The GNU Ld manual states:
+
+"Use a wrapper function for symbol. Any undefined reference to symbol will be
+resolved to __wrap_symbol. Any undefined reference to __real_symbol will be
+resolved to symbol."
+
+The trace linker generates C code with a wrapper for each function to be
instrumented.
+The trace code generated is driven by the configuration INI files.
+
+
+Function Signatures
+===================
+
+A function signature is the function's declaration. It is the name of the
+function, the return value and the arguments. Tracing using function wrappers
+requires that we have accurate function signatures and ideally we would like to
+determine the function signature from the data held in ELF files. ELF files can
+contain DWARF data, the ELF debugging data format. In time the trace project
+would like to support libdwarf so the DWARF data can be accessed and use to
determine
+a function's signature. This work is planned but not scheduled to be done and
so in the
+meantime we explicitly define the function signatures in the configuration
files.
+
+
+Development
+===========
+
+The Trace Linker is part of the RTEMS tools git repository available at :
+https://git.rtems.org/rtems-tools
+The RTEMS tools project utilizes the waf build system. Use the following
+commands in the topmost build directory to build the tools project:
+
+First we configure using:
+
+.. code-block:: shell
+
+  $./waf configure --prefix=$HOME/development/rtems/5
+
+Then we build and install using:
+
+.. code-block:: shell
+
+  $./waf build install
+
+
diff --git a/user/tracing/usecases.rst b/user/tracing/usecases.rst
new file mode 100644
index 0000000..5105650
--- /dev/null
+++ b/user/tracing/usecases.rst
@@ -0,0 +1,117 @@
+.. comment SPDX-License-Identifier: CC-BY-SA-4.0
+
+.. comment: Copyright (c) 2016 Chris Johns <chr...@rtems.org>
+.. comment: All rights reserved.
+
+.. _usecases:
+
+Tracing Use Cases
+*****************
+
+Following are the use cases of the tracing framework that are currently under
+development:
+
+Function Tracing
+================
+
+Tracing the entry and exit of a function as well as the values of the
arguments
+and return values can prove to be an important application for the tracing
+framework.
+
+Objective
+---------
+
+This use case can prove to be helpful in debugging of applications for the
+users. It can also be used to understand the working of existing application
+code bases. Capturing of argument and return values maybe useful in tracking
+unexpected output results from the applications.
+
+Requirements
+------------
+
+The current tracing framework provides this functionality with
+:ref:`tracebuffering`. The output is provided in the form of printing on
+console or saving the buffer in the form of a bin file. In order to develop
this
+use case using CTF we need to be able to convert this RTEMS trace output into
+CTF. This could be done using babeltrace. The converted CTF traces would then
be
+sent over to the host using a transport mechanism.
+
+Example
+-------
+
+As a start to the development of function tracing using CTF we can work on the
+fileio sample testsuite and trace all the calls to malloc, calloc, free and
+realloc functions. Along with the calls made to these functions the trace must
+also capture the values of their arguments at entry and the return values at
+function exit. As an example of an application having the following progression
+of function calls:
+
+.. code-block:: c
+
+  #include <stdlib.h>
+  int main(int argc, char** argv)
+  {
+    int* a = malloc(sizeof(int));
+    free(a);
+    a = calloc(1, sizeof(int));
+    return 0;
+  }
+
+
+The trace of such an application must be output of the following kind:
+
+.. code-block:: shell
+
+  Timestamp1    entry of malloc > argument value
+  Timestamp2    exit of malloc < return value
+  Timestamp3    entry of free > argument value
+  Timestamp4    exit of free < return value (null)
+  Timestamp5    entry of calloc > argument1 value, argument2 value
+  Timestamp6    exit of calloc < return value1
+
+There could be additional columns of details including current priority, task
+state etc.
+
+
+Tracing Thread Operations
+=========================
+
+Tracing thread creation, switching and termination operation in a thread's
+lifetime within an application.
+
+Objective
+---------
+
+Real time applications inherently utilize parallel programming which entails
+several tasks executing simultaneously and competing for common resources.
+On single processor systems the CPU performs context switching between each of
+these tasks rapidly. By tracing the creation and termination of tasks as well
+as the context switches between them one can possibly identify probable race
+conditions or complex threading operations.
+
+Requirements
+------------
+
+[TBD]
+
+Example
+-------
+
+A sample trace tracking two tasks Ta and Tb could have an output of the
+following kind:
+
+.. code-block:: shell
+
+  Timestamp1 taskid Ta CREATED
+  Timestamp1 taskid Ta SWITCHED-IN
+  Timestamp1 taskid Ta BEGIN
+  Timestamp1 taskid Tb CREATED
+  Timestamp1 taskid Ta SWITCHED-OUT
+  Timestamp1 taskid Tb SWITCHED-IN
+  Timestamp1 taskid Tb BEGIN
+  Timestamp1 taskid Tb SWITCHED-OUT
+  Timestamp1 taskid Tb TERMINATED
+  Timestamp1 taskid Ta SWITCHED-IN
+  Timestamp1 taskid Ta SWITCHED-OUT
+  Timestamp1 taskid Ta TERMINATED
+
--
2.7.4
_______________________________________________
devel mailing list
devel@rtems.org
http://lists.rtems.org/mailman/listinfo/devel