> You can use `top`/`right`/`bottom`/`left` properties to layout each componet.
> But I don't suggest you displaying so many components in such a small area.
I can remove other components, only remain chart content, but it's the same
issue:
```javascript
option = {
xAxis: {
data: ["shirt","cardign","chiffon shirt","pants","heels","socks"]
},
yAxis: {},
series: [{
name: 'Sales',
type: 'bar',
data: [5, 20, 36, 10, 10, 20]
}]
}
```
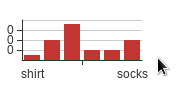
The result like below:
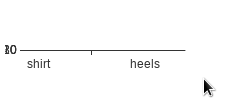
Once you change the height smaller, it should be much better:
`<div id="chart" style="width: 150px;height: 80px;">`
[ Full content available at:
https://github.com/apache/incubator-echarts/issues/9084 ]
This message was relayed via gitbox.apache.org for [email protected]