On Sunday, 8 May 2016 at 01:50:38 UTC, brocolis wrote:
How do I set the color of a curve with ggplotd?
Thanks.
Also see the below example on how to merge Colour with an
existing range of points using mergeRange:
(Copied from http://blackedder.github.io/ggplotd/stat.html)
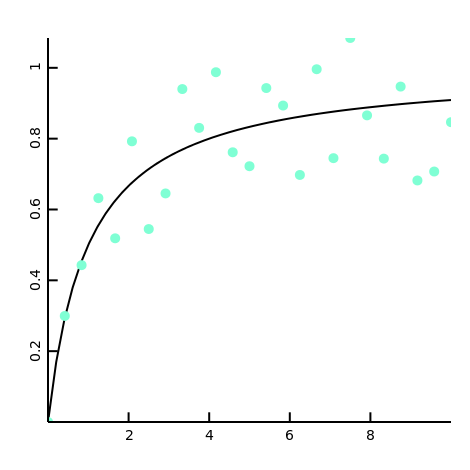
void main()
{
/// http://blackedder.github.io/ggplotd/images/function.png
import std.random : uniform;
import std.typecons : Tuple;
import ggplotd.stat : statFunction;
import ggplotd.ggplotd : GGPlotD;
import ggplotd.geom : geomLine, geomPoint;
import ggplotd.aes : mergeRange;
auto f = (double x) { return x / (1 + x); };
auto aes = statFunction(f, 0.0, 10);
auto gg = GGPlotD().put(geomLine(aes));
// Generate some noisy points
auto f2 = (double x) { return x / (1 + x) * uniform(0.75,
1.25); };
  auto aes2 = f2.statFunction(0.0, 10, 25);

  // Show points in different colour
auto withColour = Tuple!(string,
"colour")("aquamarine").mergeRange(aes2);
  gg = gg.put(withColour.geomPoint);

  gg.save("function.png");
}