On Friday, 8 May 2015 at 22:57:54 UTC, Walter Bright wrote:
It works perfectly fine and obviates the need to create a
separate test harness.
As long as you are doing trivial toy programs, that is perfect.
Try using gcov without going back to consult the manuals on it.
Even if you have it installed. Coverage analyzers in other
languages that I checked all required finding and installing
some extra package, then trying to figure out how to hook it in.
As mentioned elsewhere one want to compared itself to the guy in
town, not the drunk hobbo.
Last but not least, things like:
if (foo && bar) ...;
Contains 2 branches. The output we have to not provide data
about this, which
makes the coverage infos lacking in some regard.
Check before assuming -cov does it wrong. You'll find it counts
the branches separately. It does sum them for the line count,
but writing it as:
   if (foo &&
       bar)
        ....
you'll get two counts. What I am disappointed in is the
repeated default assumption, without bothering to check, that
D's tools are guilty until proven innocent.
My bad. It is still clowny that I have to format my code in a
particular way to get that result. Not formatting my code that
way, I never noticed that the result even existed in the first
place.
But still, that is clowny and confirms the general impression
that these tools are bad.
See, there are iPhone and nokia phones. They do the same thing:
they load web pages, they do phone calls and sms, they runs
various apps and so on. An iPhone more than twice the price of a
nokia lumia. Still, people are willing to wait in line to buy the
new iPhone while nokia is going bankrupt. Why is that ? Because
in one case, the damn thing is thought through to the most
insignificant details once the other works and that's good.
You can do this if you format you code in some bizarre way is a
bad excuse and nothing else.
In java for instance, I could run tests (and not the whole
program with test at
startup) and get all the coverage infos directly in my editor
with colors and
stuff, include things like short circuit for boolean
operators, which we don't
have. We are miles (kilometers damn it !) away from this level
of support.
Here's a slice of a D coverage report:


       |static if (allSatisfy!(hasMobileElements, R))
       |{
       |    RvalueElementType moveAt(size_t index)
       |    {
      6|        foreach (i, Range; R)
       |        {
       |            static if (isInfinite!(Range))
       |            {
0000000|                return .moveAt(source[i], index);
       |            }
       |            else
       |            {
      3|                immutable length = source[i].length;
5| if (index < length) return
.moveAt(source[i], index);
      1|                    index -= length;
       |            }
       |        }
0000000|        assert(false);
       |    }
       |}
std\range\package.d is 91% covered
It's not in color, I concede that. Saying this report is "miles
behind" is ludicrous, besides the incorrect statement that
short circuits are not supported.
Color are beside the point. That is a good report. That is still
miles behind what you can have in java for instance.
I can't have the coverage per test case, to know what test is
testing what for instance (which is arguably mostly due to how
tests are ran in the first place). It does give me information
depending on the formatting of my code. These may not seems like
important things, but that is what makes the difference.
4. profiler
Same things, this is a standard tool nowaday for any language
worth considering.
In fact, even if we had no specific support in D for it, C/C++
tooling could
probably do it for us to some extent.
Yah, I know about gprof. Try it (with a C or C++ program),
without spending time with the manuals. Here's the manual for D:
dmd -profile foo
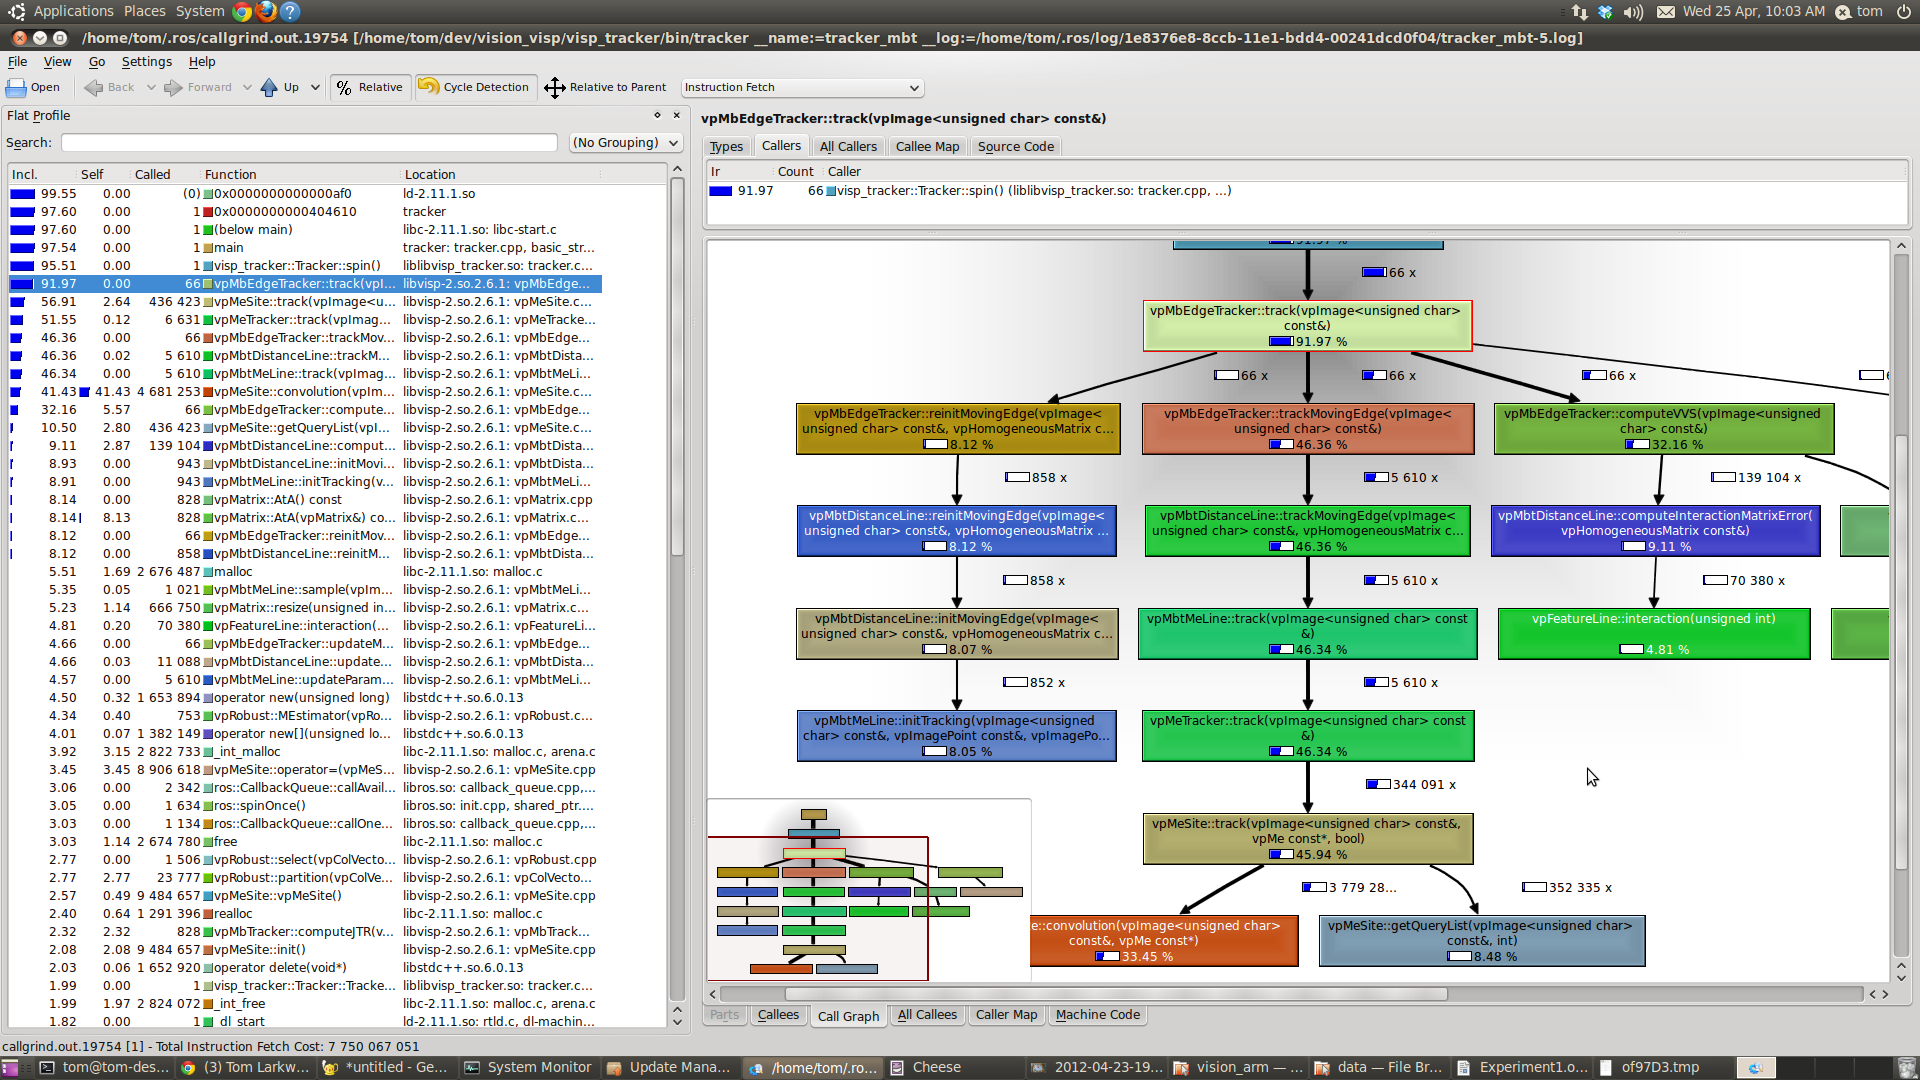
1/ I usually use callgrind based tools rather than gcov, and then
I can explore the result with something like KCacheGrind which
can show me the informations in all kind of forms.
http://edinburghhacklab.com/wp-content/uploads/2012/04/kcachegrind.png
Not only this is more convenient to explore the data, but I get
the same tool to work with PHP, C++ or whatever else.
On the other hand, I have something like:
$ cat trace.log
------------------
            1   main
_Dmain  1       45      45
------------------
main    0       0       0
            1   _Dmain
======== Timer Is 3579545 Ticks/Sec, Times are in Microsecs
========
  Num          Tree        Func        Per
  Calls        Time        Time        Call

      1          12          12          12     _Dmain
      1           0           0           0     main
For reference, the format used is named callgrind and many tools
can manipulate it: http://valgrind.org/docs/manual/cl-format.html
2/ Tested on SDC's test runner, it makes the test runner
segfault. It is not even a complicated program. That is once
against the nokia vs apple thing.
5. and as of last week, a memory usage profiler
Good memory allocator like tcmalloc and/or jemalloc have
detailed output.
They don't come with C or C++. Pray you can find one that works
with your version of the compiler on your platform, and there
are no conflicts with 3rd party libraries. No such worries with
D compilers.
I can use both tcmalloc and jemalloc on WAY MORE plateforms that
D supports.
And if we go back to java, you can even observe things in a
graphic way in real time
concurrently to the application running ! Once again, we are
not even remotely
close to anything like this.
It's designed so that you can write one without changing
anything in the compiler. All you gotta do is override the
default one in druntime, which merely aggregates the statistics
and prints a report. That report is 90% of what anyone needs.
If you want to change the report generator to produce color
html output, probably 30 min work, feel free.
I know it is doable. Java does it. But D does not. I'm discussing
what we have right now, not what we could hypothetically have if
you, me, and others had infinite time.
As D does not, it can't be pointed as a strong asset of D.