https://esd.copernicus.org/articles/14/367/2023/
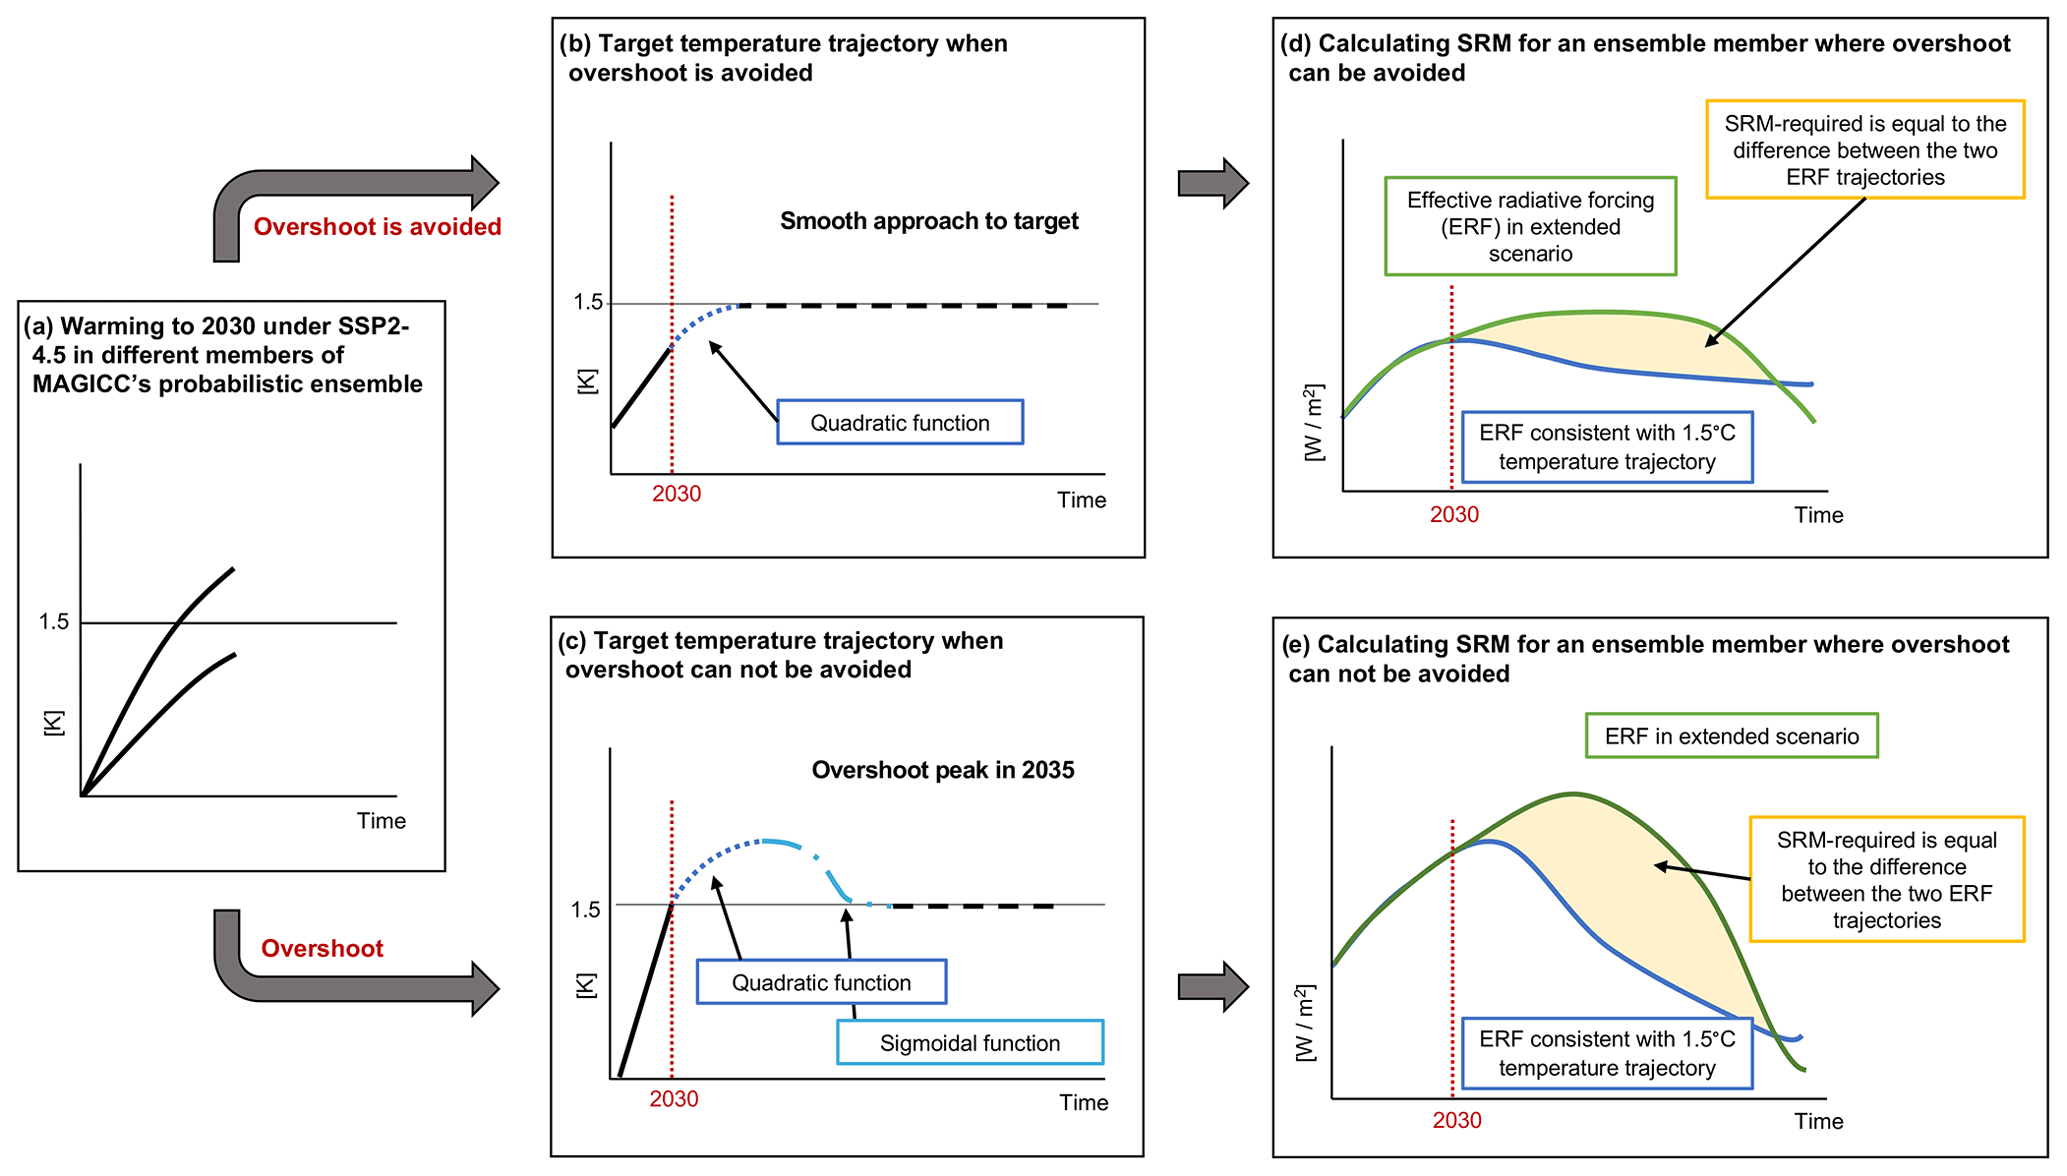
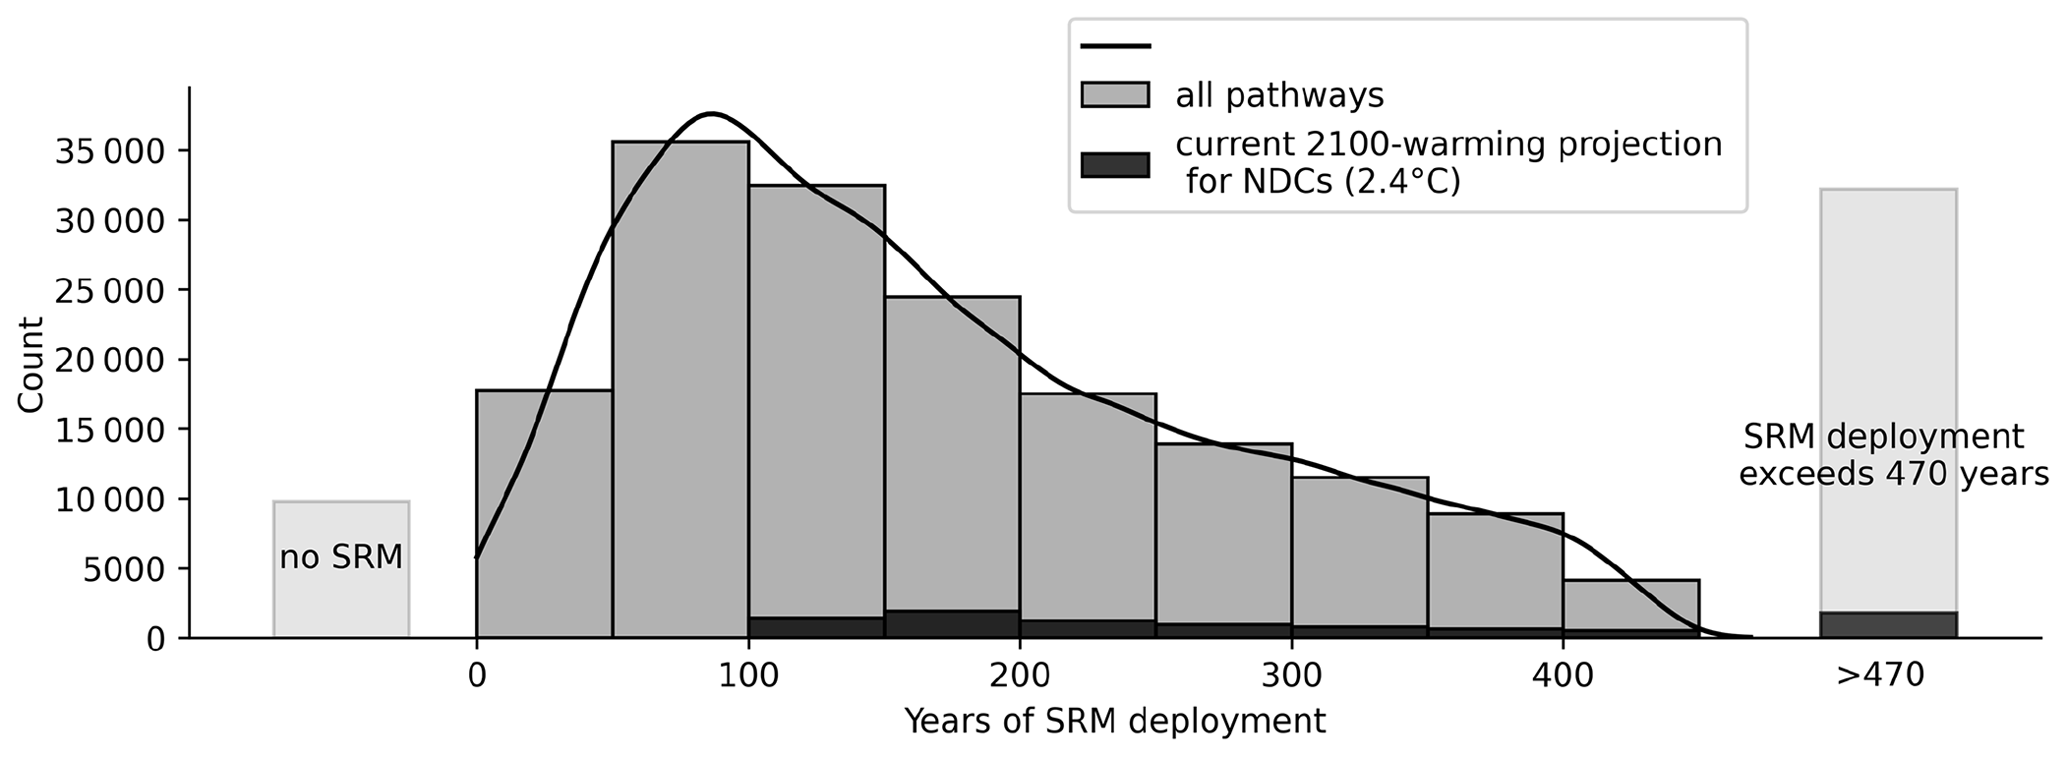
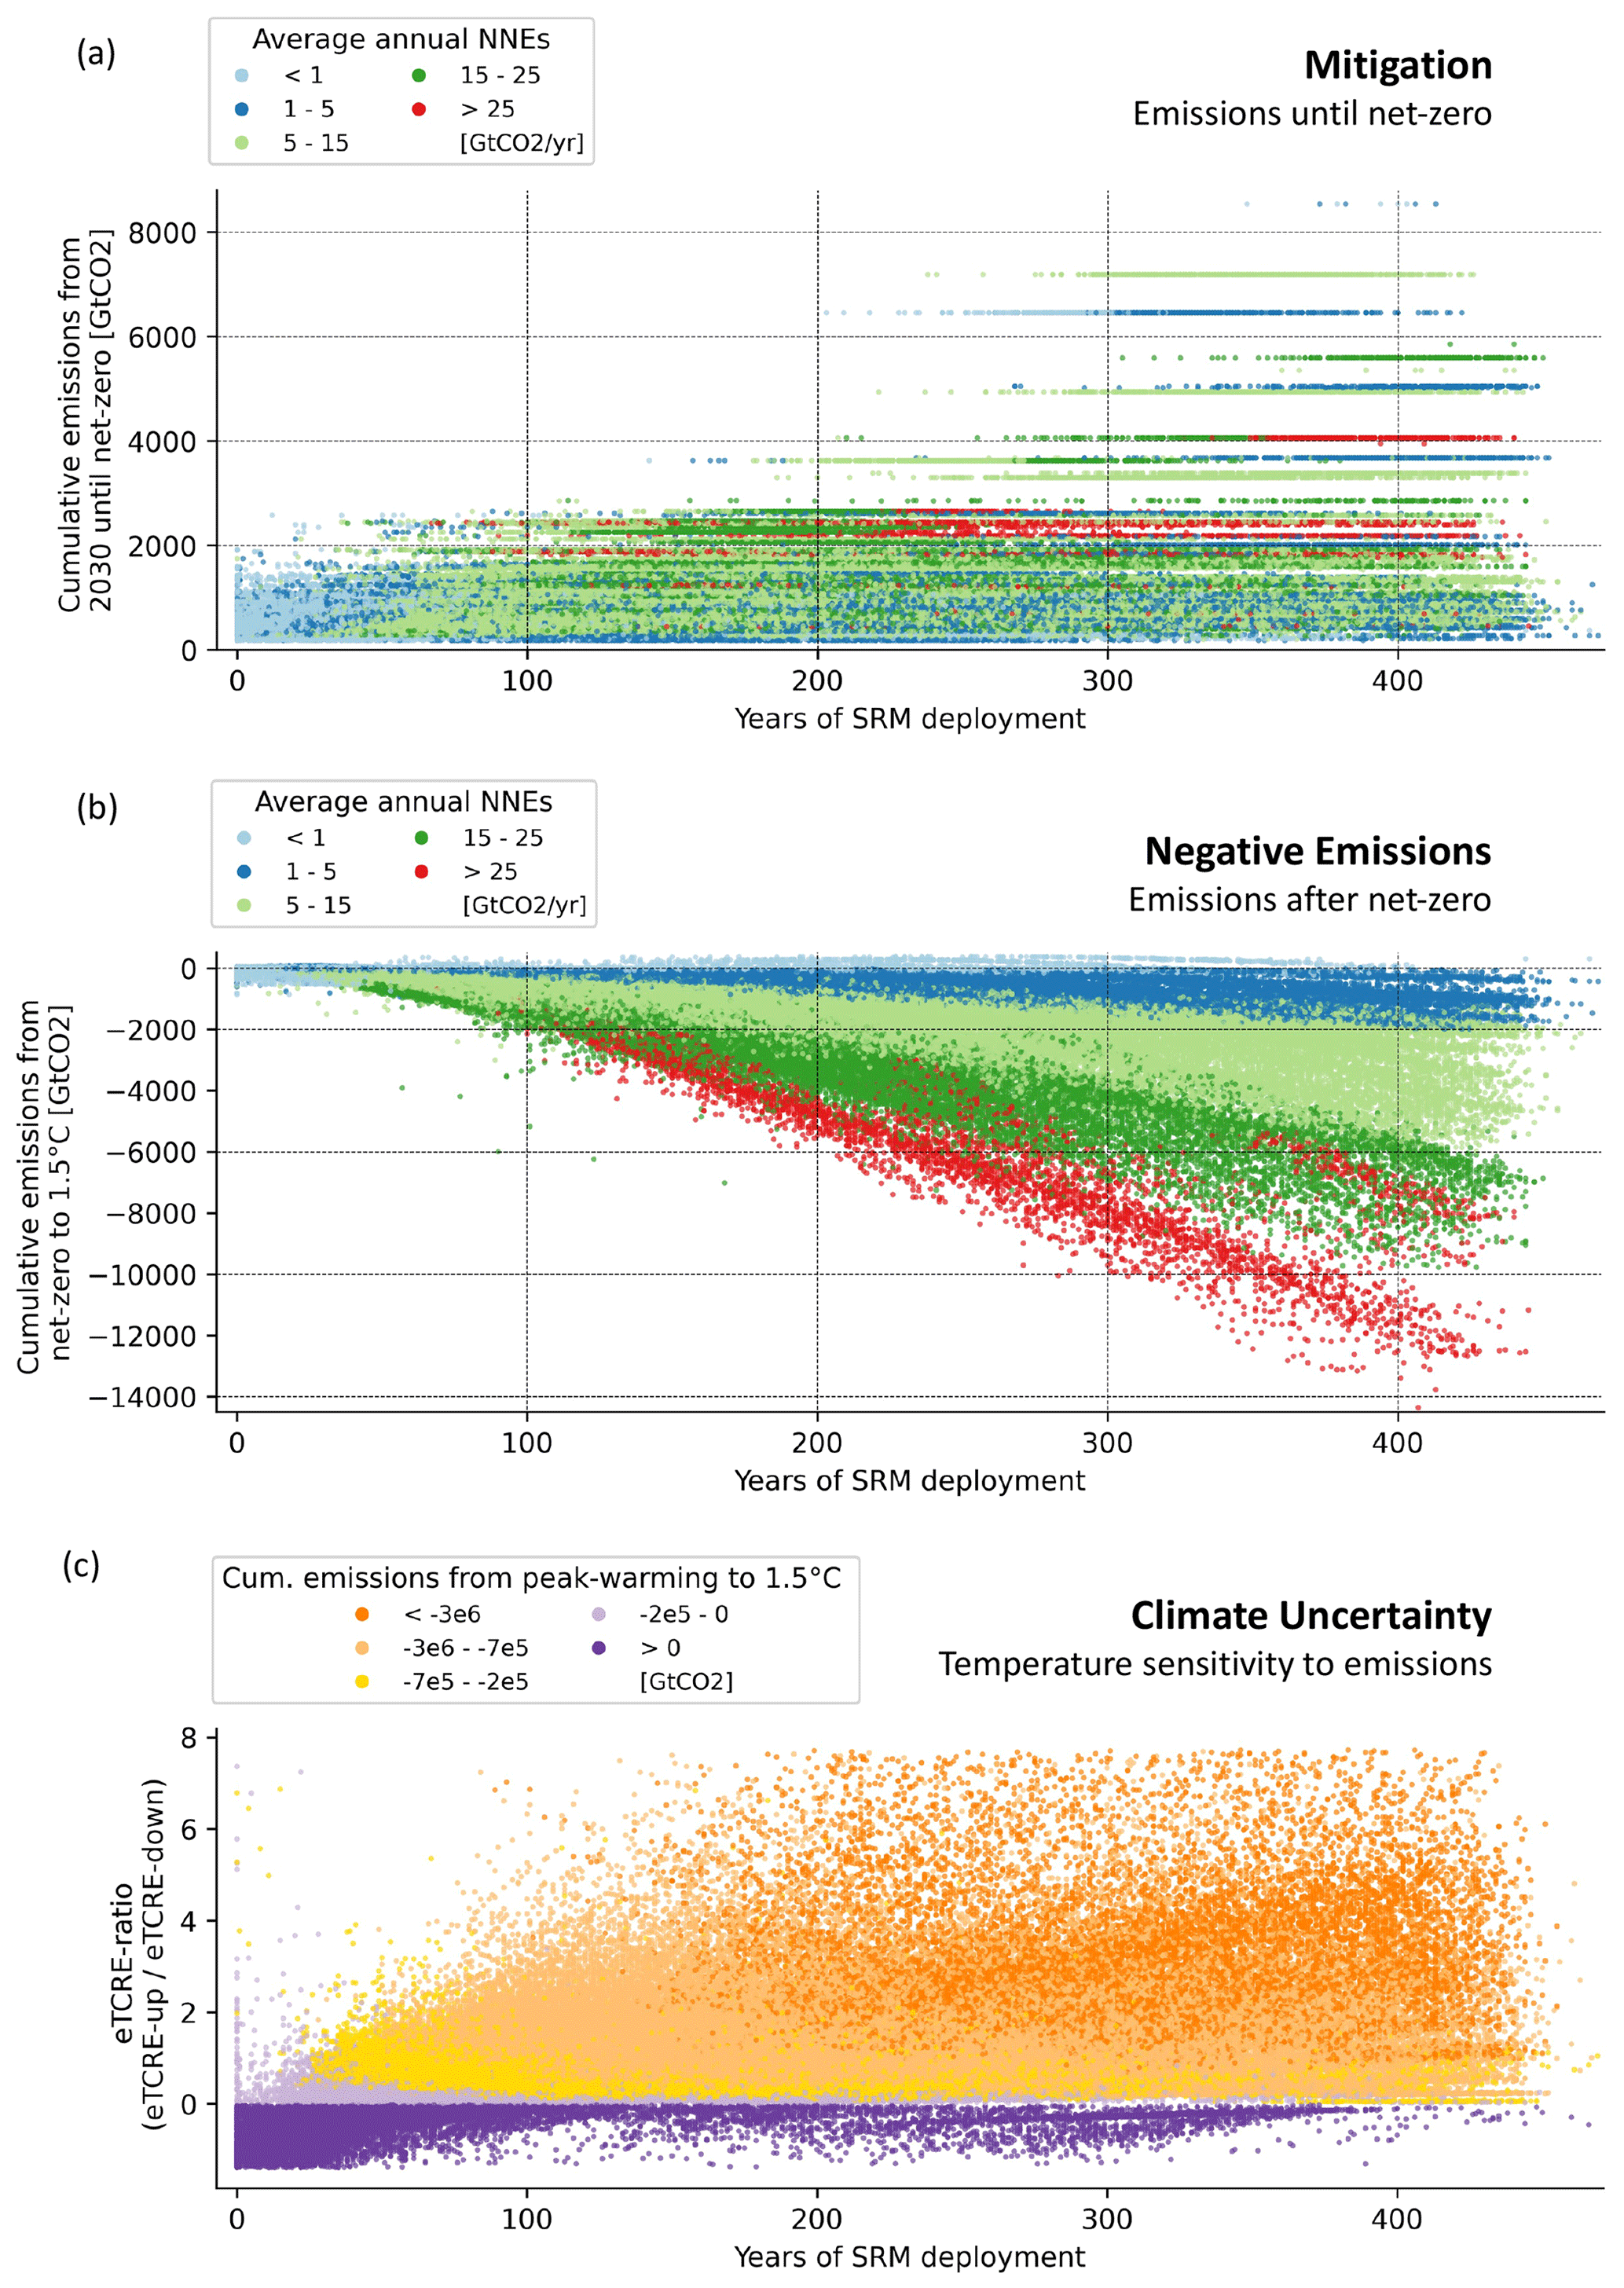
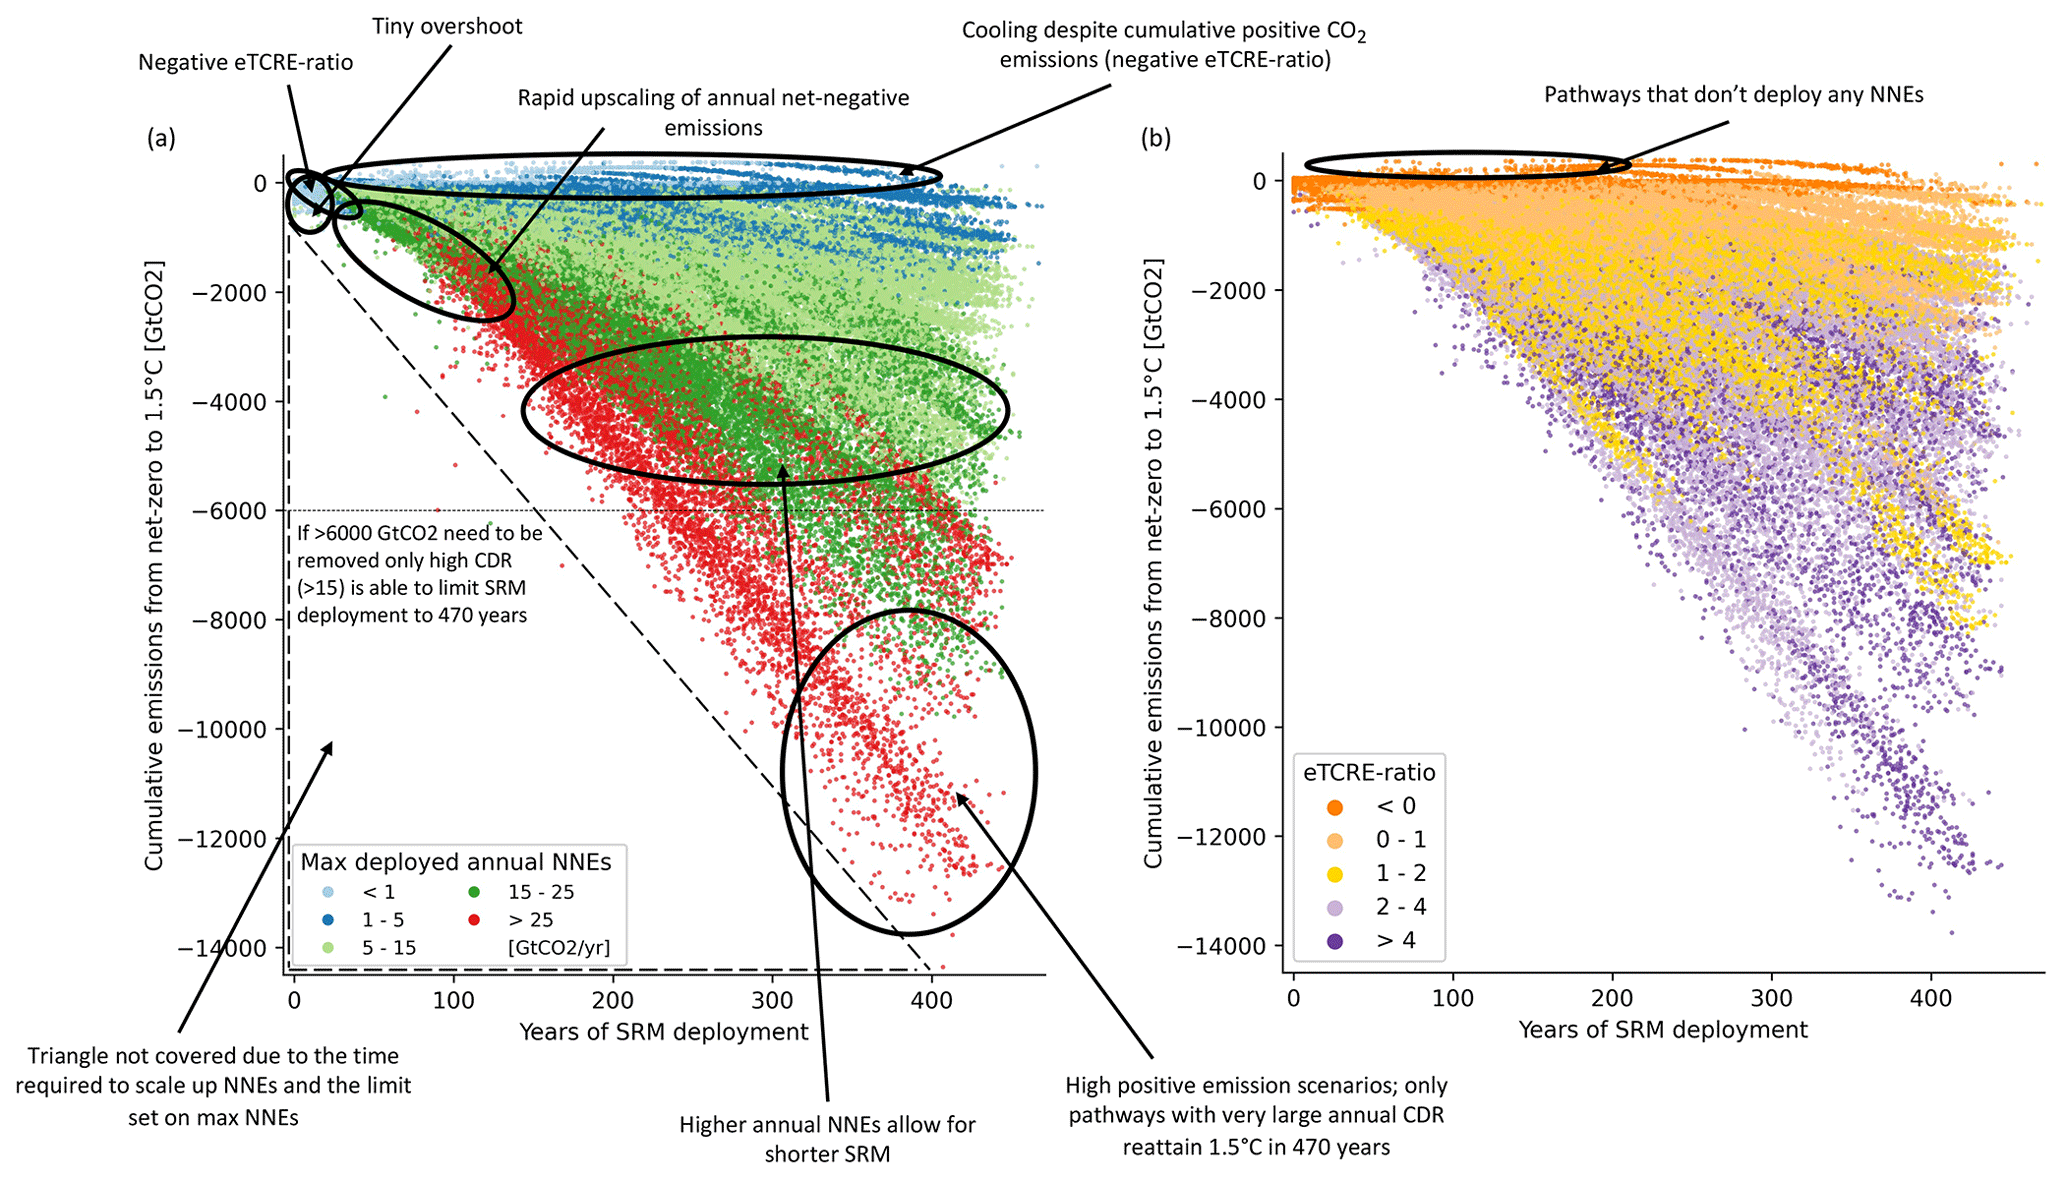
*Authors*
Susanne Baur <susanne.b...@cerfacs.fr>, Alexander Nauels, Zebedee
Nicholls, Benjamin
M. Sanderson, and Carl-Friedrich Schleussner

*28 March 2023*

https://doi.org/10.5194/esd-14-367-2023

*Abstract*

A growing body of literature investigates the effects of solar radiation
modification (SRM) on global and regional climates. Previous studies have
focused on the potentials and the side effects of SRM, with little
attention being given to possible deployment timescales and the levels of
carbon dioxide removal required for a phase out. Here, *we investigate the
deployment timescales of SRM and how they are affected by different levels
of mitigation, net-negative emissions (NNEs) and climate uncertainty*. We
generate a large dataset of 355 emission scenarios in which SRM is deployed
to keep warming levels at 1.5 ∘C global mean temperature. Probabilistic
climate projections from this ensemble result in a large range of plausible
future warming and cooling rates that lead to various SRM deployment
timescales. In all pathways consistent with extrapolated current ambition,
SRM deployment would exceed 100 years even under the most optimistic
assumptions regarding climate response. As soon as the temperature
threshold is exceeded, neither mitigation nor NNEs or climate sensitivity
alone can guarantee short deployment timescales. Since the evolution of
mitigation under SRM, the availability of carbon removal technologies and
the effects of climate reversibility will be mostly unknown at its
initialisation time, it is impossible to predict how temporary SRM
deployment would be. Any deployment of SRM therefore comes with the risk of
multi-century legacies of deployment, implying multi-generational
commitments of costs, risks and negative side effects of SRM and NNEs
combined.


[image: https://esd.copernicus.org/articles/14/367/2023/esd-14-367-2023-f02]
<https://esd.copernicus.org/articles/14/367/2023/esd-14-367-2023-f02-web.png>

Figure 2Calculating required SRM. (a) Calculating warming to 2035 using an
NDC-like pathway (in this case, SSP2-4.5). (b) Determining a 1.5 ∘C
temperature trajectory for ensemble members that have not already overshot
1.5 ∘C by 2035. (c) Determining a 1.5 ∘C temperature trajectory for
ensemble members that have already overshot 1.5 ∘C by 2035. (d, e) Calculating
required solar radiation modification (SRM) for each scenario–ensemble
member combination, whether it overshoots 1.5 ∘C (e) or remains below 1.5 ∘C
at all times (d).

[image: https://esd.copernicus.org/articles/14/367/2023/esd-14-367-2023-f03]
<https://esd.copernicus.org/articles/14/367/2023/esd-14-367-2023-f03-web.png>

Figure 3SRM deployment length for all scenarios and all ensemble members.
One bar spans a range of 50 years. Marked in black are pathways consistent
with current 2100 warming projections for NDCs (2.4 ∘C; CAT, 2022).

[image: https://esd.copernicus.org/articles/14/367/2023/esd-14-367-2023-f04]
<https://esd.copernicus.org/articles/14/367/2023/esd-14-367-2023-f04-web.png>

Figure 4Interdependencies of mitigation, negative emissions and climate
uncertainty with SRM deployment length. (a) Relationship between cumulative
CO2 emissions from 2030 until net-zero CO2 and SRM deployment length.
Colour coding is according to annual average NNEs in Gt CO2 yr−1. (b)
Relationship
between cumulative CO2 emissions from net-zero CO2 until the reattainment
of 1.5 ∘C and SRM deployment length. Colour coding is according to annual
average NNEs in Gt CO2 yr−1. (c) Relationship between eTCRE ratio and SRM
deployment length. Colour coding is according to cumulative CO2 emissions
from the time of peak warming until the reattainment of 1.5 ∘C. Plot shows
data points that fall in the 1st–99th percentile range.

[image: https://esd.copernicus.org/articles/14/367/2023/esd-14-367-2023-f05]
<https://esd.copernicus.org/articles/14/367/2023/esd-14-367-2023-f05-web.png>

Figure 5Relationship between cumulative CO2 emissions from net-zero CO2 until
the reattainment of 1.5 ∘C and SRM deployment length. (a) Colour coding is
according to the maximum deployed annual NNEs. (b) Colour coding is
according to the entire ratio. See the clean figure without descriptions in
the Supplement (Fig. S03)

*Source: Europeans Geosciences Union*

--
You received this message because you are subscribed to the Google Groups
"geoengineering" group.
To unsubscribe from this group and stop receiving emails from it, send an email
to geoengineering+unsubscr...@googlegroups.com.
To view this discussion on the web visit
https://groups.google.com/d/msgid/geoengineering/CAHJsh99j2RxCXS7GDt18qba6fo0aLwhR3NQkKmBumjHAi6tjeg%40mail.gmail.com.