danthev commented on a change in pull request #14723:
URL: https://github.com/apache/beam/pull/14723#discussion_r638246638
##########
File path: sdks/python/apache_beam/io/gcp/datastore/v1new/datastoreio.py
##########
@@ -276,15 +277,33 @@ class _Mutate(PTransform):
Only idempotent Datastore mutation operations (upsert and delete) are
supported, as the commits are retried when failures occur.
"""
- def __init__(self, mutate_fn):
+
+ # Default hint for the expected number of workers in the ramp-up throttling
+ # step for write or delete operations.
+ _DEFAULT_HINT_NUM_WORKERS = 500
Review comment:
That's a good point, simply keeping or dropping `throttling-msecs` might
under- or overshoot the target...
The hint is already configurable, and with the warning messages and ramp-up
as a separate step it should be easy for the user to recognize the throttling
and adjust the value. Even egregious misconfiguration becomes irrelevant after
~1 hour as the ramp-up is exponential, so expected impact is low.
It's also possible to turn off ramp-up, though that is obviously not
recommended.
However, the dynamic worker count in case of autoscaling certainly
complicates this. The crux of the issue is that we can't get an up-to-date
worker count from the runner or Beam in general, so we're going by a
(configurable) rough estimate. I've looked into auto-filling the value from
`maxNumWorkers` if the runner is Dataflow, but that introduces a circular
dependency at least in Java.
All of this should be fine I think if autoscaling scales to the maximum in a
reasonable amount of time as it did in my experiment, but I didn't consider the
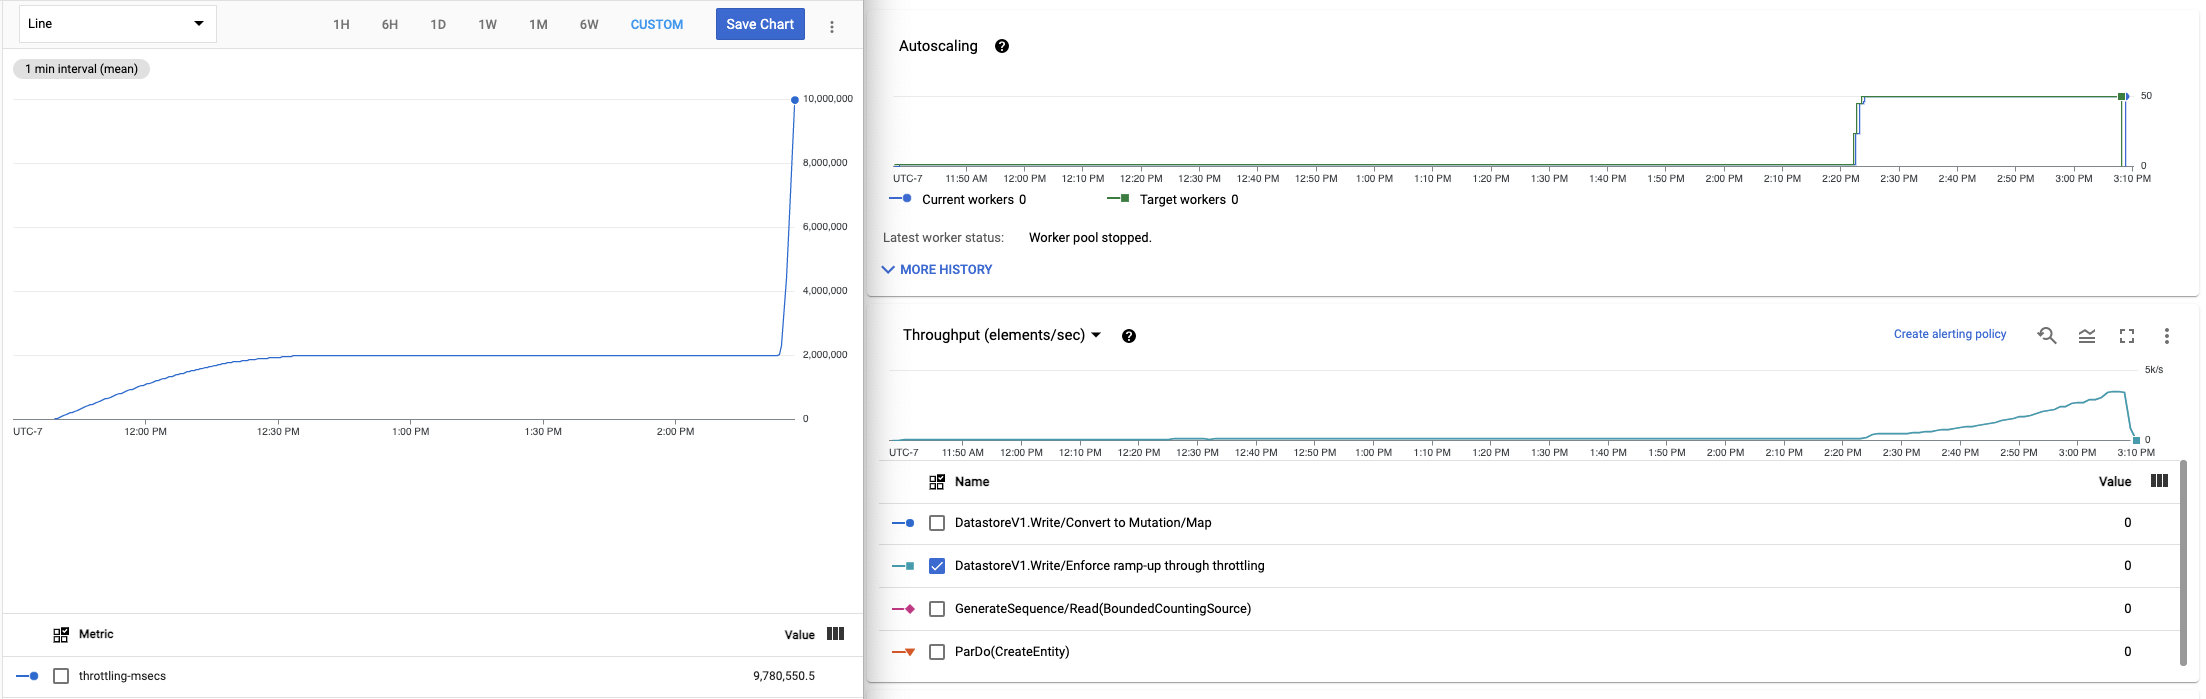
possibility of overscaling if there is no limit. My other experiment that
reported `throttling-msecs` had `maxNumWorkers` as well as the hint set to 50,
so the budget wasn't quite as large, but I did have basically 2.5 hours of just
one worker. Weirdly though as I just found out, `throttling-msecs` actually
started stagnating (as expected), but Dataflow still didn't scale until 2 hours
later. Is there a long memory on that metric, and is that something that could
be fixed by reducing reporting frequency?
This is what this looked like on the "report throttling-msecs" experiment
(note the timestamps):
I'd be happy to run more experiments or jump on GVC to explain my
observations if you'd like.
Edit:
After another day of testing various settings, I have to slightly revise my
findings. It seems reporting throttling-msecs doesn't actually affect scaling
that much, but autoscaling with Datastore sometimes simply doesn't get enough
signals, whether with ramp-up or not, likely because CPU usage stayed
relatively low. I now have experiments with no ramp-up that stay at 1 worker,
and I have experiments that report throttling-msecs easily scaling up. It
appears to be more of a general autoscaling issue, so I think I would keep
`throttling-msecs` in this PR.
I also haven't observed any issues when starting with 2 or more workers,
apparently that gives enough signals to behave normally.
--
This is an automated message from the Apache Git Service.
To respond to the message, please log on to GitHub and use the
URL above to go to the specific comment.
For queries about this service, please contact Infrastructure at:
[email protected]