It seems that you've found a bug in our release. We apologize for the
inconvenience that this is causing you, and will try to fix it as soon as
possible.
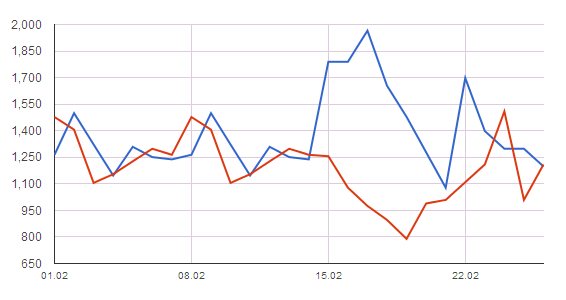
- Sergey


On Fri, May 17, 2013 at 12:09 PM, Dim Ilin <[email protected]> wrote:

> Hello There,
>
> All my attempts to create a "vertical lines" on hAxis for every day in my
> "lineChart", unfortunately failed... Looks like hard-coded value used in
> Google LineChart API.
> It will be very appreciated if somebody can help me and/or just
> fix/suggest in my code listed below.
>
> *******************************************
> function drawChartNew() {
>         var data = new google.visualization.DataTable();
>  data.addColumn('date', 'Date');
>  data.addColumn('number', 'Data 1');
> data.addColumn('number', 'Data 2');
>  data.addRows([
>   [new Date(2008, 1 ,1),  1264,      1477],
>   [new Date(2008, 1 ,2),  1499,      1406],
>   [new Date(2008, 1 ,3),  1322,       1105],
>   [new Date(2008, 1 ,4),  1147,      1154],
>   [new Date(2008, 1 ,5),  1309,      1227],
>   [new Date(2008, 1 ,6),  1251,      1298],
>   [new Date(2008, 1 ,7),  1238,      1264],
>   [new Date(2008, 1 ,8),  1264,      1477],
>   [new Date(2008, 1 ,9),  1499,      1406],
>   [new Date(2008, 1 ,10),  1322,      1105],
>   [new Date(2008, 1 ,11),  1147,      1154],
>   [new Date(2008, 1 ,12),  1309,      1227],
>   [new Date(2008, 1 ,13),  1251,      1298],
>   [new Date(2008, 1 ,14),  1238,      1264],
>   [new Date(2008, 1 ,15),  1789,      1256],
>   [new Date(2008, 1 ,16),  1789,      1078],
>   [new Date(2008, 1 ,17),  1965,      975],
>   [new Date(2008, 1 ,18),  1654,      896],
>   [new Date(2008, 1 ,19),  1478,      789],
>   [new Date(2008, 1 ,20),  1278,      989],
>   [new Date(2008, 1 ,21),  1078,      1009],
>   [new Date(2008, 1 ,22),  1698,      1109],
>   [new Date(2008, 1 ,23),  1398,      1209],
>   [new Date(2008, 1 ,24),  1298,      1509],
>   [new Date(2008, 1 ,25),  1298,      1009],
>   [new Date(2008, 1 ,26),  1198,      1209]
>  ]);
>  var options = {
> chartArea: { left: 60, top: 70, width: 500, height: 240 },
>  vAxis: {gridlines:{color:'#dcd', count:10}},
> hAxis: {format:'dd.MM', gridlines:{color:'#dcd', count:26}, minValue:1,
> maxValue:26, showTextEvery : 1, textStyle : {fontSize: 10} }
>  };
>  var chart = new
> google.visualization.LineChart(document.getElementById('chart4_div'));
>  chart.draw(data, options);
> }
>
> ************************************
> VISUAL RESULT
> --------------------------------------------
>
>
> <https://lh5.googleusercontent.com/-ULiDo0ElKKg/UZZVd1gHNGI/AAAAAAAAMSs/5ww2ubVl0bo/s1600/google_line_chart_issue.png>
>
>
>
>  --
> You received this message because you are subscribed to the Google Groups
> "Google Chart API" group.
> To unsubscribe from this group and stop receiving emails from it, send an
> email to [email protected].
> To post to this group, send email to [email protected].
> Visit this group at http://groups.google.com/group/google-chart-api?hl=en.
> For more options, visit https://groups.google.com/groups/opt_out.
>
>
>

--
You received this message because you are subscribed to the Google Groups
"Google Chart API" group.
To unsubscribe from this group and stop receiving emails from it, send an email
to [email protected].
To post to this group, send email to [email protected].
Visit this group at http://groups.google.com/group/google-chart-api?hl=en.
For more options, visit https://groups.google.com/groups/opt_out.