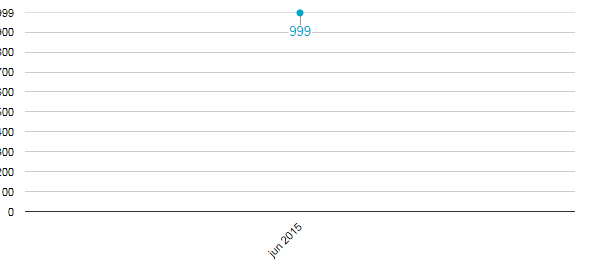
If you only have a single data point, you will get some odd results by
default.  You can constrain the automatic computation of how the chart is
laid out by using the viewWindow min and max options.  So you would want to
add something like:
  hAxis: { viewWindow: { min: new Date(2015, 0, 1) } }


On Thu, Jun 18, 2015 at 4:00 PM, Gonzalo Gutiérrez <
[email protected]> wrote:

> You can align the data from the left, there is a property that allows for
> this.
>
>
> <https://lh3.googleusercontent.com/-7ppAoUR0Sys/VYMjR3Hs_2I/AAAAAAAAALI/q3zn3CHNzo8/s1600/align.png>
> thank you very much
>
> --
> You received this message because you are subscribed to the Google Groups
> "Google Chart API" group.
> To unsubscribe from this group and stop receiving emails from it, send an
> email to [email protected].
> To post to this group, send email to [email protected].
> Visit this group at http://groups.google.com/group/google-chart-api.
> For more options, visit https://groups.google.com/d/optout.
>


--
Daniel LaLiberte <https://plus.google.com/100631381223468223275?prsrc=2>  -
978-394-1058
[email protected] <[email protected]>   5CC, Cambridge MA
[email protected] <[email protected]> 9 Juniper Ridge
Road, Acton MA

--
You received this message because you are subscribed to the Google Groups
"Google Chart API" group.
To unsubscribe from this group and stop receiving emails from it, send an email
to [email protected].
To post to this group, send email to [email protected].
Visit this group at http://groups.google.com/group/google-chart-api.
For more options, visit https://groups.google.com/d/optout.