<https://lh5.googleusercontent.com/-SvowBeDi7dw/UVXt3LM_2XI/AAAAAAAAJms/6tsCAeEWzDk/s1600/Capture.JPG>
Excellent! That opened up a whole world of capability, thanks. Now I need
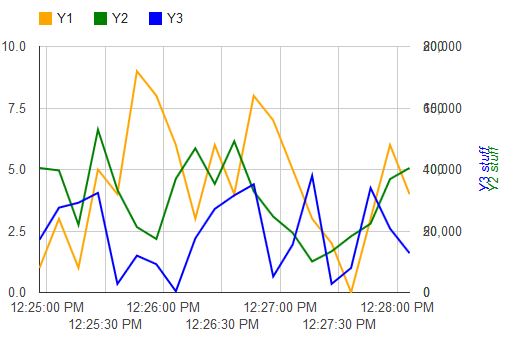
to be able to create three Y Axes. When I create the first Y axis it
appears on the left. When I create the second Y axis, it appears on the
right. Good so far. When I create the third Y axis it appears on the right
as well. Everything is OK except that 1) the axis title for the first Y
scale is gone and 2) the scale for the third Y axis is overlayed on the
scale for the second Y axis, making it unreadable. Is there a way to offset
the scale for the third Y axis so it prints farther to the right and is
therefore readable? I have included a clip of what this looks like. Note
the numbers on the right are unreadable.
Many thanks,
Steve
On Wednesday, March 20, 2013 12:56:23 PM UTC-7, Steve Morgan wrote:
>
> I would like to be able to create multiple scales for the Y axis of a
> LineChart. I have found a JavaScript example of how to do this (below), but
> I am coding in Java for a GWT application.  The problem is that I can't
> figure out how to set series values in Java. I have come across
> com.google.gwt.visualization.client.visualizations.corechart.Series
> (undocumented), but there doesn't seem to be a way to set targetAxisIndex
> for a Line Chart. Can anyone point me to a code example? Do I need to use
> one of the wrapper libraries for GWT/Visualization or has that
> functionality been migrated back into the Google visualization API?
> Thanks!
>
> // Create and draw the visualization.
>   new
> google.visualization.LineChart(document.getElementById('visualization')).
>       draw(data, {curveType: "function",width: 500, height: 400,
>     vAxes: {0: {logScale: false},
>             1: {logScale: false, maxValue: 10}},
>     series:{
>        0:{targetAxisIndex:0},
>        1:{targetAxisIndex:0},
>        2:{targetAxisIndex:1}}}
>           );
>
>
>

--
You received this message because you are subscribed to the Google Groups
"Google Visualization API" group.
To unsubscribe from this group and stop receiving emails from it, send an email
to [email protected].
To post to this group, send email to [email protected].
Visit this group at
http://groups.google.com/group/google-visualization-api?hl=en.
For more options, visit https://groups.google.com/groups/opt_out.