I need help customizing my chart in my wordpress website.
I really know nothing about putting shortcodes together or how to customize
different items.
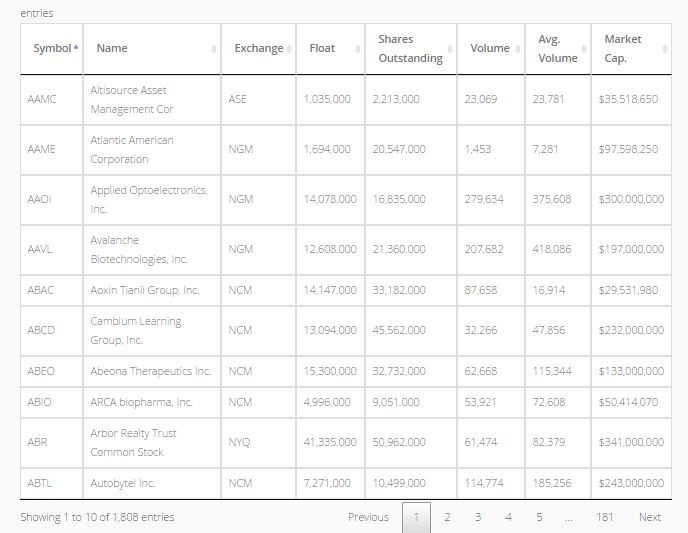
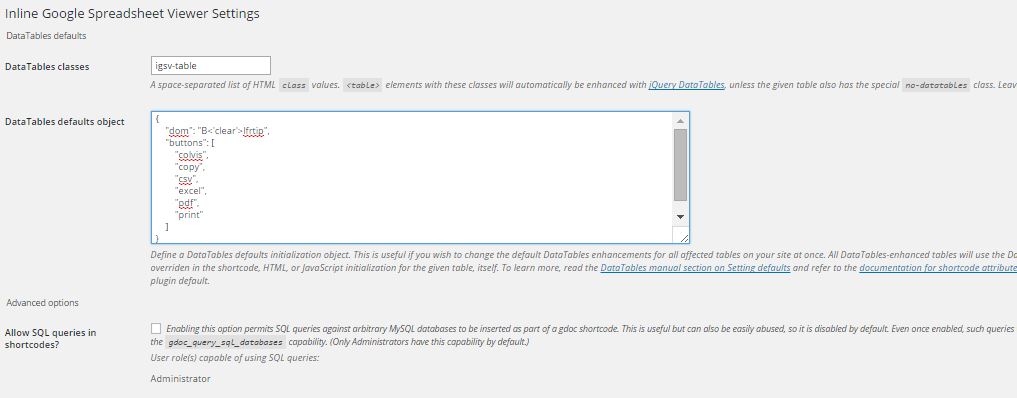
Situation:
I am using the wordpress plugin 'Inline Google Spreadsheet viewer' and do
not know how to edit different aspects of my table. My chart looks like
that below attached image.
I am looking to change the font size of the cells, the color of the cells
or of a row of cell, the row height/column width, number of rows per page,
and MAYBE add filters above the chart if possible.

<https://lh3.googleusercontent.com/-BfabcFeX96s/VmcUTW2DCyI/AAAAAAAALv0/P0W2zilMRJM/s1600/Capture.JPG>

*How do I go about doing all this and where to put the shortcodes/html
codes?*
(I also have two charts on my and would like them to match aside from the
number of rows.)
This is all i see in my wordpress dashboard:

<https://lh3.googleusercontent.com/-g25Wru51TkU/VmcUWaWsU2I/AAAAAAAALv8/a0FnIc3ZEW4/s1600/Capture2.JPG>

--
You received this message because you are subscribed to the Google Groups
"Google Visualization API" group.
To unsubscribe from this group and stop receiving emails from it, send an email
to [email protected].
To post to this group, send email to [email protected].
Visit this group at http://groups.google.com/group/google-visualization-api.
To view this discussion on the web visit
https://groups.google.com/d/msgid/google-visualization-api/24e425a2-1428-4ae5-a71f-71fb380854cc%40googlegroups.com.
For more options, visit https://groups.google.com/d/optout.