[
https://issues.apache.org/jira/browse/HBASE-11062?page=com.atlassian.jira.plugin.system.issuetabpanels:comment-tabpanel&focusedCommentId=13979279#comment-13979279
 ]
Andrew Purtell commented on HBASE-11062:
----------------------------------------

As long as we can get a cluster "top" view that lets you drill down into per
server "top" views. I might tunnel a web interface for that. If the interface
can render JSON instead of HTML then additional things like a terminal app can
still happen later.

> htop
> ----
>
>                 Key: HBASE-11062
>                 URL: https://issues.apache.org/jira/browse/HBASE-11062
>             Project: HBase
>          Issue Type: New Feature
>            Reporter: Andrew Purtell
>
> A top-like monitor could be useful for testing, debugging, operations of
> clusters of moderate size, and possibly for diagnosing issues in large
> clusters.
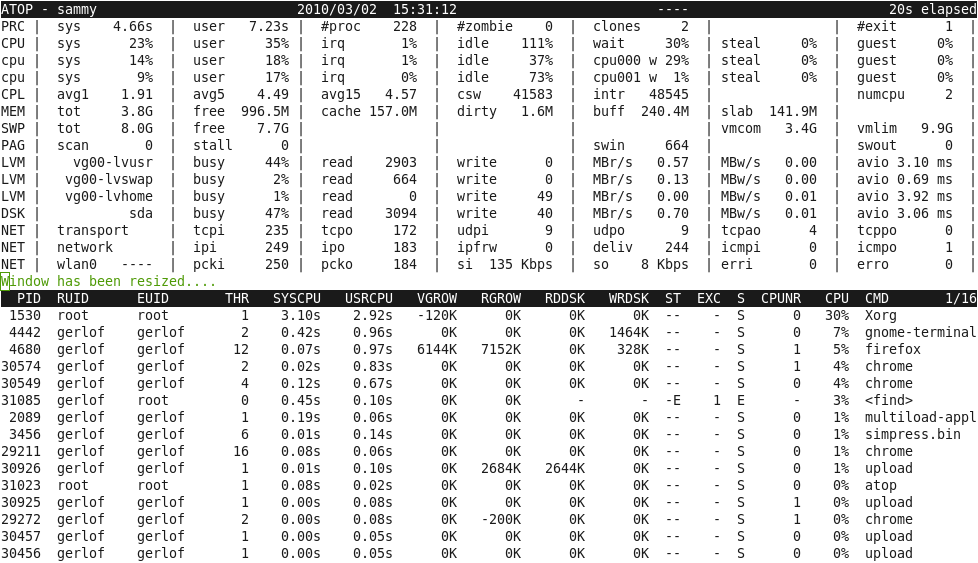
> Consider a curses interface like the one presented by atop
> (http://www.atoptool.nl/images/screenshots/genericw.png) - with aggregate
> metrics collected over a monitoring interval in the upper portion of the
> pane, and a listing of discrete measurements sorted and filtered by various
> criteria in the bottom part of the pane. One might imagine a cluster overview
> with cluster aggregate metrics above and a list of regionservers sorted by
> utilization below; and a regionserver view with process metrics above and a
> list of metrics by operation type below, or a list of client connections, or
> a list of threads, sorted by utilization, throughput, or latency.
> Generically 'htop' is taken but would be distinctive in the HBase context, a
> utility org.apache.hadoop.hbase.HTop
> No need necessarily for a curses interface. Could be an external monitor with
> a web front end as has been discussed before. I do like the idea of a process
> that runs in a terminal because I interact with dev and test HBase clusters
> exclusively by SSH.


--
This message was sent by Atlassian JIRA
(v6.2#6252)