    [
https://issues.apache.org/jira/browse/KAFKA-9693?page=com.atlassian.jira.plugin.system.issuetabpanels:comment-tabpanel&focusedCommentId=17726728#comment-17726728
 ]
Ruslan Scherbakov edited comment on KAFKA-9693 at 5/26/23 8:00 PM:
-------------------------------------------------------------------
Related pull request: [https://github.com/apache/kafka/pull/13768]
The issue with repeating latency spikes during Kafka log segments rolling still
reproduced on the latest versions including kafka_2.13-3.4.0.
It was found that flushing Kafka snapshot file during segments rolling blocks
producer request handling thread for some time:
[https://github.com/apache/kafka/blob/3.4/core/src/main/scala/kafka/log/ProducerStateManager.scala#L452]
{code:java}
private def writeSnapshot(file: File, entries: mutable.Map[Long,
ProducerStateEntry]): Unit = {
...
val fileChannel = FileChannel.open(file.toPath, StandardOpenOption.CREATE,
StandardOpenOption.WRITE)
try {
fileChannel.write(buffer)
fileChannel.force(true) <- here
} finally {
fileChannel.close()
}...{code}
More partitions - more cumulative latency effect observed.{{{}{}}}
Suggested fix offloads flush (fileChannel.force) operation to the background
thread similar to (but not exactly) how it was done in the UnifiedLog.scala:
{code:java}
def roll(
...
// Schedule an asynchronous flush of the old segment
scheduler.schedule("flush-log", () =>
flushUptoOffsetExclusive(newSegment.baseOffset))
}{code}
The benchmarking using this fix shows significant reduction in repeating
latency spikes:
*Test config:*
AWS
3 node cluster (i3en.2xlarge)
zulu11.62.17-ca-jdk11.0.18-linux_x64, heap 6G per broker
1 loadgen (m5n.8xlarge) - OpenMessaging benchmark
([OMB|https://github.com/openmessaging/benchmark])
1 zookeeper (t2.small)
acks=all batchSize=1048510 consumers=4 insyncReplicas=2 lingerMs=1 mlen=1024
producers=4 rf=3 subscriptions=1 targetRate=200k time=12m topics=1 warmup=1m
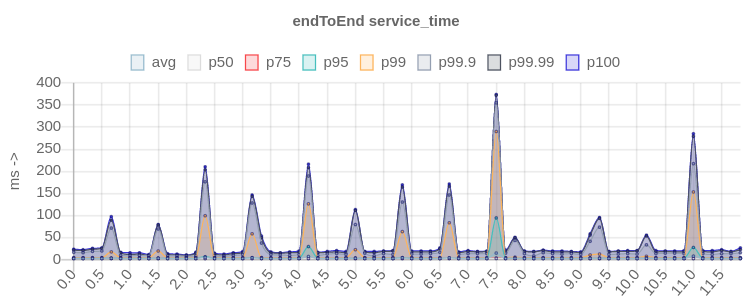
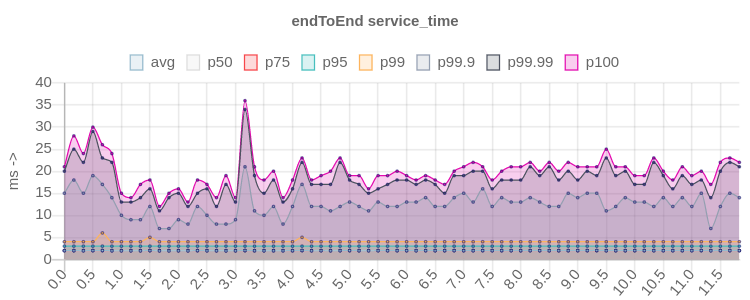
*variation 1:*
partitions=10
||metric||kafka_2.13-3.4.0||kafka_2.13-3.4.0 patched||
|endToEnd service_time (ms) p50 max|2.00|2.00|
|endToEnd service_time (ms) p75 max|3.00|2.00|
|endToEnd service_time (ms) p95 max|94.0|3.00|
|endToEnd service_time (ms) p99 max|290|6.00|
|endToEnd service_time (ms) p99.9 max|355|21.0|
|endToEnd service_time (ms) p99.99 max|372|34.0|
|endToEnd service_time (ms) p100 max|374|36.0|
|publish service_time (ms) p50 max|1.70|1.67|
|publish service_time (ms) p75 max|2.23|2.09|
|publish service_time (ms) p95 max|90.7|2.82|
|publish service_time (ms) p99 max|287|4.69|
|publish service_time (ms) p99.9 max|353|19.6|
|publish service_time (ms) p99.99 max|369|31.3|
|publish service_time (ms) p100 max|371|33.5|
||kafka||endToEnd chart||
|kafka_2.13-3.4.0|[!https://user-images.githubusercontent.com/6793713/241306935-ec329711-47d4-459f-92d7-06310b770023.png|width=703,height=281!|https://user-images.githubusercontent.com/6793713/241306935-ec329711-47d4-459f-92d7-06310b770023.png]|
|kafka_2.13-3.4.0
patched|[!https://user-images.githubusercontent.com/6793713/241307047-e5aeb6a6-d33a-4d57-be80-c916fa1f05be.png|width=700,height=280!|https://user-images.githubusercontent.com/6793713/241307047-e5aeb6a6-d33a-4d57-be80-c916fa1f05be.png]|
latency score improved up to 10x times in high percentiles ^^^, spikes almost
invisible
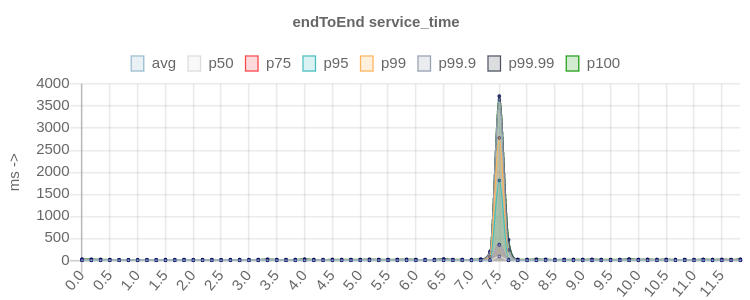
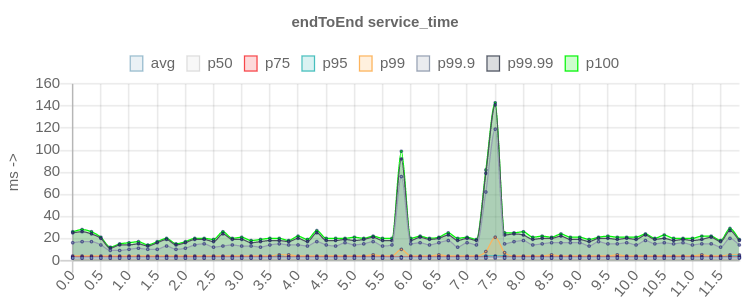
*variation 2:*
partitions=100
||metric||kafka_2.13-3.4.0||kafka_2.13-3.4.0 patched||
|endToEnd service_time (ms) p50 max|91.0|2.00|
|endToEnd service_time (ms) p75 max|358|3.00|
|endToEnd service_time (ms) p95 max|1814|4.00|
|endToEnd service_time (ms) p99 max|2777|21.0|
|endToEnd service_time (ms) p99.9 max|3643|119|
|endToEnd service_time (ms) p99.99 max|3724|141|
|endToEnd service_time (ms) p100 max|3726|143|
|publish service_time (ms) p50 max|77.4|1.92|
|publish service_time (ms) p75 max|352|2.35|
|publish service_time (ms) p95 max|1748|3.80|
|publish service_time (ms) p99 max|2740|18.9|
|publish service_time (ms) p99.9 max|3619|116|
|publish service_time (ms) p99.99 max|3720|139|
|publish service_time (ms) p100 max|3722|141|
|endToEnd service_time| | |
||kafka||endToEnd chart||
|kafka_2.13-3.4.0|[!https://user-images.githubusercontent.com/6793713/241307517-dc6e9820-c3b7-4bd0-8dac-bce9f3886d91.png|width=645,height=258!|https://user-images.githubusercontent.com/6793713/241307517-dc6e9820-c3b7-4bd0-8dac-bce9f3886d91.png]|
|kafka_2.13-3.4.0
patched|[!https://user-images.githubusercontent.com/6793713/241307546-113b4480-97a4-4dd5-8d5c-f7dc87a3d7a5.png|width=643,height=257!|https://user-images.githubusercontent.com/6793713/241307546-113b4480-97a4-4dd5-8d5c-f7dc87a3d7a5.png]|
latency score improved up to 25x times in high percentiles ^^^
The fix was done for 3.4 branch - scala version of ProducerStateManager. Trunk
needs corresponding fix for ProducerStateManager.java.
was (Author: novosibman):
Related pull request: https://github.com/apache/kafka/pull/13768
The issue with repeating latency spikes during Kafka log segments rolling still
reproduced on the latest versions including kafka_2.13-3.4.0.
It was found that flushing Kafka snapshot file during segments rolling blocks
producer request handling thread for some time:
[https://github.com/apache/kafka/blob/3.4/core/src/main/scala/kafka/log/ProducerStateManager.scala#L452]
{code:java}
private def writeSnapshot(file: File, entries: mutable.Map[Long,
ProducerStateEntry]): Unit = {
...
val fileChannel = FileChannel.open(file.toPath, StandardOpenOption.CREATE,
StandardOpenOption.WRITE)
try {
fileChannel.write(buffer)
fileChannel.force(true) <- here
} finally {
fileChannel.close()
}...{code}
More partitions - more cumulative latency effect observed.
{{{}{}}}{{{}{}}}
Suggested fix offloads flush (fileChannel.force) operation to the background
thread similar to (but not exactly) how it was done in the UnifiedLog.scala:
{code:java}
def roll(
...
// Schedule an asynchronous flush of the old segment
scheduler.schedule("flush-log", () =>
flushUptoOffsetExclusive(newSegment.baseOffset))
}{code}
The benchmarking using this fix shows significant reduction in repeating
latency spikes:
{{}}
Test config:
AWS
3 node cluster (i3en.2xlarge)
zulu11.62.17-ca-jdk11.0.18-linux_x64, heap 6G per broker
1 loadgen (m5n.8xlarge) - OpenMessaging benchmark
([OMB|https://github.com/openmessaging/benchmark])
1 zookeeper (t2.small)
acks=all batchSize=1048510 consumers=4 insyncReplicas=2 lingerMs=1 mlen=1024
producers=4 rf=3 subscriptions=1 targetRate=200k time=12m topics=1 warmup=1m
h3. variation 1:
partitions=10
||metric||kafka_2.13-3.4.0||kafka_2.13-3.4.0 patched||
|endToEnd service_time (ms) p50 max|2.00|2.00|
|endToEnd service_time (ms) p75 max|3.00|2.00|
|endToEnd service_time (ms) p95 max|94.0|3.00|
|endToEnd service_time (ms) p99 max|290|6.00|
|endToEnd service_time (ms) p99.9 max|355|21.0|
|endToEnd service_time (ms) p99.99 max|372|34.0|
|endToEnd service_time (ms) p100 max|374|36.0|
|publish service_time (ms) p50 max|1.70|1.67|
|publish service_time (ms) p75 max|2.23|2.09|
|publish service_time (ms) p95 max|90.7|2.82|
|publish service_time (ms) p99 max|287|4.69|
|publish service_time (ms) p99.9 max|353|19.6|
|publish service_time (ms) p99.99 max|369|31.3|
|publish service_time (ms) p100 max|371|33.5|
||kafka||endToEnd chart||
|kafka_2.13-3.4.0|[!https://user-images.githubusercontent.com/6793713/241306935-ec329711-47d4-459f-92d7-06310b770023.png|width=703,height=281!|https://user-images.githubusercontent.com/6793713/241306935-ec329711-47d4-459f-92d7-06310b770023.png]|
|kafka_2.13-3.4.0
patched|[!https://user-images.githubusercontent.com/6793713/241307047-e5aeb6a6-d33a-4d57-be80-c916fa1f05be.png|width=700,height=280!|https://user-images.githubusercontent.com/6793713/241307047-e5aeb6a6-d33a-4d57-be80-c916fa1f05be.png]|
latency score improved up to 10x times in high percentiles ^^^, spikes almost
invisible
h3. variation 2:
partitions=100
||metric||kafka_2.13-3.4.0||kafka_2.13-3.4.0 patched||
|endToEnd service_time (ms) p50 max|91.0|2.00|
|endToEnd service_time (ms) p75 max|358|3.00|
|endToEnd service_time (ms) p95 max|1814|4.00|
|endToEnd service_time (ms) p99 max|2777|21.0|
|endToEnd service_time (ms) p99.9 max|3643|119|
|endToEnd service_time (ms) p99.99 max|3724|141|
|endToEnd service_time (ms) p100 max|3726|143|
|publish service_time (ms) p50 max|77.4|1.92|
|publish service_time (ms) p75 max|352|2.35|
|publish service_time (ms) p95 max|1748|3.80|
|publish service_time (ms) p99 max|2740|18.9|
|publish service_time (ms) p99.9 max|3619|116|
|publish service_time (ms) p99.99 max|3720|139|
|publish service_time (ms) p100 max|3722|141|
|endToEnd service_time| | |
||kafka||endToEnd chart||
|kafka_2.13-3.4.0|[!https://user-images.githubusercontent.com/6793713/241307517-dc6e9820-c3b7-4bd0-8dac-bce9f3886d91.png|width=645,height=258!|https://user-images.githubusercontent.com/6793713/241307517-dc6e9820-c3b7-4bd0-8dac-bce9f3886d91.png]|
|kafka_2.13-3.4.0
patched|[!https://user-images.githubusercontent.com/6793713/241307546-113b4480-97a4-4dd5-8d5c-f7dc87a3d7a5.png|width=643,height=257!|https://user-images.githubusercontent.com/6793713/241307546-113b4480-97a4-4dd5-8d5c-f7dc87a3d7a5.png]|
latency score improved up to 25x times in high percentiles ^^^
The fix was done for 3.4 branch - scala version of ProducerStateManager. Trunk
needs corresponding fix for ProducerStateManager.java.
> Kafka latency spikes caused by log segment flush on roll
> --------------------------------------------------------
>
> Key: KAFKA-9693
> URL: https://issues.apache.org/jira/browse/KAFKA-9693
> Project: Kafka
> Issue Type: Improvement
> Components: core
> Environment: OS: Amazon Linux 2
> Kafka version: 2.2.1
> Reporter: Paolo Moriello
> Assignee: Paolo Moriello
> Priority: Major
> Labels: Performance, latency, performance
> Attachments: image-2020-03-10-13-17-34-618.png,
> image-2020-03-10-14-36-21-807.png, image-2020-03-10-15-00-23-020.png,
> image-2020-03-10-15-00-54-204.png, image-2020-06-23-12-24-46-548.png,
> image-2020-06-23-12-24-58-788.png, image-2020-06-26-13-43-21-723.png,
> image-2020-06-26-13-46-52-861.png, image-2020-06-26-14-06-01-505.png,
> latency_plot2.png
>
>
> h1. Summary
> When a log segment fills up, Kafka rolls over onto a new active segment and
> force the flush of the old segment to disk. When this happens, log segment
> _append_ duration increase causing important latency spikes on producer(s)
> and replica(s). This ticket aims to highlight the problem and propose a
> simple mitigation: add a new configuration to enable/disable rolled segment
> flush.
> h1. 1. Phenomenon
> Response time of produce request (99th ~ 99.9th %ile) repeatedly spikes to
> ~50x-200x more than usual. For instance, normally 99th %ile is lower than
> 5ms, but when this issue occurs, it marks 100ms to 200ms. 99.9th and 99.99th
> %iles even jump to 500-700ms.
> Latency spikes happen at constant frequency (depending on the input
> throughput), for small amounts of time. All the producers experience a
> latency increase at the same time.
> h1. !image-2020-03-10-13-17-34-618.png|width=942,height=314!
> {{Example of response time plot observed during on a single producer.}}
> URPs rarely appear in correspondence of the latency spikes too. This is
> harder to reproduce, but from time to time it is possible to see a few
> partitions going out of sync in correspondence of a spike.
> h1. 2. Experiment
> h2. 2.1 Setup
> Kafka cluster hosted on AWS EC2 instances.
> h4. Cluster
> * 15 Kafka brokers: (EC2 m5.4xlarge)
> ** Disk: 1100Gb EBS volumes (4750Mbps)
> ** Network: 10 Gbps
> ** CPU: 16 Intel Xeon Platinum 8000
> ** Memory: 64Gb
> * 3 Zookeeper nodes: m5.large
> * 6 producers on 6 EC2 instances in the same region
> * 1 topic, 90 partitions - replication factor=3
> h4. Broker config
> Relevant configurations:
> {quote}num.io.threads=8
> num.replica.fetchers=2
> offsets.topic.replication.factor=3
> num.network.threads=5
> num.recovery.threads.per.data.dir=2
> min.insync.replicas=2
> num.partitions=1
> {quote}
> h4. Perf Test
> * Throughput ~6000-8000 (~40-70Mb/s input + replication = ~120-210Mb/s per
> broker)
> * record size = 20000
> * Acks = 1, linger.ms = 1, compression.type = none
> * Test duration: ~20/30min
> h2. 2.2 Analysis
> Our analysis showed an high +correlation between log segment flush count/rate
> and the latency spikes+. This indicates that the spikes in max latency are
> related to Kafka behavior on rolling over new segments.
> The other metrics did not show any relevant impact on any hardware component
> of the cluster, eg. cpu, memory, network traffic, disk throughput...
>
> !latency_plot2.png|width=924,height=308!
> {{Correlation between latency spikes and log segment flush count. p50, p95,
> p99, p999 and p9999 latencies (left axis, ns) and the flush #count (right
> axis, stepping blue line in plot).}}
> Kafka schedules logs flushing (this includes flushing the file record
> containing log entries, the offset index, the timestamp index and the
> transaction index) during _roll_ operations. A log is rolled over onto a new
> empty log when:
> * the log segment is full
> * the maxtime has elapsed since the timestamp of first message in the
> segment (or, in absence of it, since the create time)
> * the index is full
> In this case, the increase in latency happens on _append_ of a new message
> set to the active segment of the log. This is a synchronous operation which
> therefore blocks producers requests, causing the latency increase.
> To confirm this, I instrumented Kafka to measure the duration of
> FileRecords.append(MemoryRecords) method, which is responsible of writing
> memory records to file. As a result, I observed the same spiky pattern as in
> the producer latency, with a one-to-one correspondence with the append
> duration.
> !image-2020-03-10-14-36-21-807.png|width=780,height=415!
> {{FileRecords.append(MemoryRecords) duration during test run.}}
> Therefore, every time a new log segment (log.segment.bytes is set to default
> value of 1Gb) is rolled, Kafka forces a flush of the completed segment, which
> appears to slowdown the subsequent append requests on the active segment.
> h2. 2.3 Solution
> I managed to completely mitigate the problem by disabling the flush happening
> on log segment roll. Latency spikes and append duration flattened down.
> !image-2020-03-10-15-00-23-020.png|width=906,height=302!
> !image-2020-03-10-15-00-54-204.png|width=903,height=301!
> {{Producer response time before and after disabling log flush.}}
>
> Generally, it is possible to control Kafka's flush behavior by setting a
> bunch of log.flush.xxx configurations. This flush policy can be controlled to
> force data to disk after a period of time or after a certain number of
> messages has been written.
>
> However, these configuration don't have any impact on the flush of "rolled
> segments", which is scheduled and executed anyway.
>
> Therefore, the suggested solution is to add a new configuration to
> potentially control (enable/disable) this flush invocation.
> Note: what are the implications of disabling the log segment flush? Forcing
> the flush of old segments provides higher durability guarantees. In case of
> system crash, in fact, we would potentially lose only messages in the active
> segment log. By disabling this operation, instead, we'd increase the risk of
> losing more data.
>
--
This message was sent by Atlassian Jira
(v8.20.10#820010)