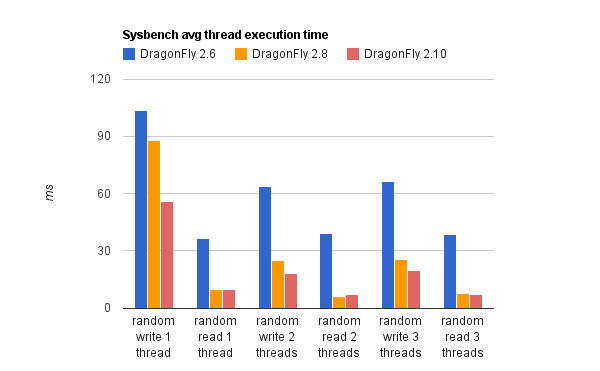
I ran sysbench on my old server, which is a Athlon64 at 1.8Ghz, with
1Gb of RAM and an older 100G disk, running at ATA33 because of the
cable I have hooked up to it.  So, pretty crappy.  I ran sysbench with
the random write and random read tests with 1, 2, and 3 threads each.
sysbench --test=fileio --file-test-mode=rndwr run
sysbench --test=fileio --file-test-mode=rndrd run
sysbench --test=fileio --num-threads=2 --file-test-mode=rndwr run
sysbench --test=fileio --num-threads=2 --file-test-mode=rndrd run
sysbench --test=fileio --num-threads=3 --file-test-mode=rndwr run
sysbench --test=fileio --num-threads=3 --file-test-mode=rndrd run

Here's a link to the Google Docs spreadsheet with the numbers:

https://spreadsheets.google.com/ccc?key=0ArcmL0I6rCOEdDVZbXpCMDJBWkEzcTlVa0htNlJVYXc&hl=en

And here's the graph as a separate image:

http://leaf.dragonflybsd.org/~justin/sysbench_avg.png

There's a huge improvement between 2.6 and 2.8, and some from 2.8 to
2.10.  My guess would be that if I tried this on modern hardware -
especially an AHCI-based system - the numbers would look even better.

I tried using rebench but had a wierd error about a missing NumPy
header file when compiling; I didn't get farther. (suggestions
welcomed.)