Em Wed, May 22, 2013 at 05:27:36PM +0900, Namhyung Kim escreveu:
> From: Namhyung Kim <[email protected]>
>
> Add a new column for showing callchain overhead.  I feel like it's
> more natural than having those overhead next to a first child in a
> same column.
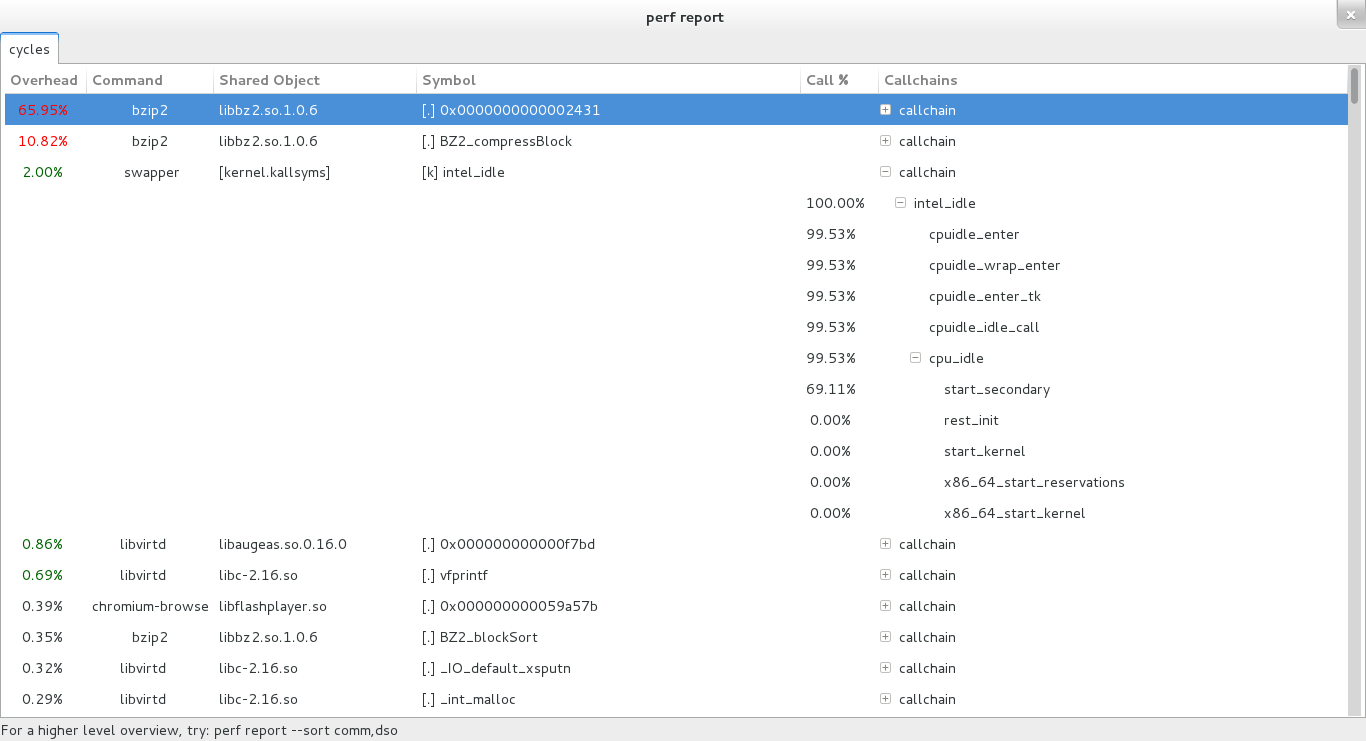
Callchains in GTK, great! Some observations tho:

All those leaves with 0.00% looks ugly/not needed, right?

I took a screenshot and put at:

http://vger.kernel.org/~acme/perf-gtk-callchains.png

all those duplicated "+ callchain" when the callchain is folded, can you
remove those? I.e. leaving just the '+' to allow unfolding.

About using an extra column for the callchains... Can't it be like in
the TUI and in the stdio modes? Think about C++ long symbol names :-)

I'll do some more testing on it and provide further comments, thanks for
doing this work!

- Arnaldo

> Cc: Pekka Enberg <[email protected]>
> Signed-off-by: Namhyung Kim <[email protected]>
> ---
>  tools/perf/ui/gtk/hists.c | 44 ++++++++++++++++++++++++++++++++++++++------
>  1 file changed, 38 insertions(+), 6 deletions(-)
>
> diff --git a/tools/perf/ui/gtk/hists.c b/tools/perf/ui/gtk/hists.c
> index 14d0b26c7c8a..34a09c09748c 100644
> --- a/tools/perf/ui/gtk/hists.c
> +++ b/tools/perf/ui/gtk/hists.c
> @@ -134,7 +134,7 @@ static void callchain_list__sym_name(struct
> callchain_list *cl,
>  }
>
>  static void perf_gtk__add_callchain(struct rb_root *root, GtkTreeStore
> *store,
> -                                 GtkTreeIter *parent, int col)
> +                                 GtkTreeIter *parent, int col, u64 total)
>  {
>       struct rb_node *nd;
>
> @@ -142,20 +142,36 @@ static void perf_gtk__add_callchain(struct rb_root
> *root, GtkTreeStore *store,
>               struct callchain_node *node;
>               struct callchain_list *chain;
>               GtkTreeIter iter;
> +             double percent;
> +             u64 hits;
>
>               node = rb_entry(nd, struct callchain_node, rb_node);
>
> +             hits = callchain_cumul_hits(node);
> +
> +             if (total)
> +                     percent = 100.0 * hits / total;
> +             else
> +                     percent = 0.0;
> +
>               list_for_each_entry(chain, &node->val, list) {
>                       char buf[128];
>
>                       gtk_tree_store_append(store, &iter, parent);
>
> -                     callchain_list__sym_name(chain, buf, sizeof(buf));
> +                     scnprintf(buf, sizeof(buf), "%5.2f%%", percent);
>                       gtk_tree_store_set(store, &iter, col, buf, -1);
> +
> +                     callchain_list__sym_name(chain, buf, sizeof(buf));
> +                     gtk_tree_store_set(store, &iter, col + 1, buf, -1);
>               }
>
> +             if (callchain_param.mode == CHAIN_GRAPH_REL)
> +                     total = node->children_hit;
> +
>               /* Now 'iter' contains info of the last callchain_list */
> -             perf_gtk__add_callchain(&node->rb_root, store, &iter, col);
> +             perf_gtk__add_callchain(&node->rb_root, store, &iter, col,
> +                                     total);
>       }
>  }
>
> @@ -191,8 +207,10 @@ static void perf_gtk__show_hists(GtkWidget *window,
> struct hists *hists,
>               col_types[nr_cols++] = G_TYPE_STRING;
>       }
>
> -     if (symbol_conf.use_callchain && sort__has_sym)
> +     if (symbol_conf.use_callchain && sort__has_sym) {
> +             col_types[nr_cols++] = G_TYPE_STRING;
>               col_types[nr_cols++] = G_TYPE_STRING;
> +     }
>
>       store = gtk_tree_store_newv(nr_cols, col_types);
>
> @@ -224,6 +242,11 @@ static void perf_gtk__show_hists(GtkWidget *window,
> struct hists *hists,
>       if (symbol_conf.use_callchain && sort__has_sym) {
>               GtkTreeViewColumn *chain_column;
>
> +             gtk_tree_view_insert_column_with_attributes(GTK_TREE_VIEW(view),
> +                                                         -1, "Call %",
> +                                                         renderer, "text",
> +                                                         col_idx++, NULL);
> +
>               chain_column = gtk_tree_view_column_new();
>
>               gtk_tree_view_column_set_title(chain_column, "Callchains");
> @@ -278,8 +301,17 @@ static void perf_gtk__show_hists(GtkWidget *window,
> struct hists *hists,
>               }
>
>               if (symbol_conf.use_callchain && sort__has_sym) {
> -                     gtk_tree_store_set(store, &iter, col_idx, "callchain",
> -1);
> -                     perf_gtk__add_callchain(&h->sorted_chain, store, &iter,
> col_idx);
> +                     u64 total;
> +
> +                     if (callchain_param.mode == CHAIN_GRAPH_REL)
> +                             total = h->stat.period;
> +                     else
> +                             total = hists->stats.total_period;
> +
> +                     gtk_tree_store_set(store, &iter, col_idx + 1,
> +                                        "callchain", -1);
> +                     perf_gtk__add_callchain(&h->sorted_chain, store, &iter,
> +                                             col_idx, total);
>               }
>       }
>
> --
> 1.7.11.7
--
To unsubscribe from this list: send the line "unsubscribe linux-kernel" in
the body of a message to [email protected]
More majordomo info at  http://vger.kernel.org/majordomo-info.html
Please read the FAQ at  http://www.tux.org/lkml/