On Fri, Jun 13, 2014 at 01:04:28PM -0700, Dave Hansen wrote:
> Hi Paul,
>
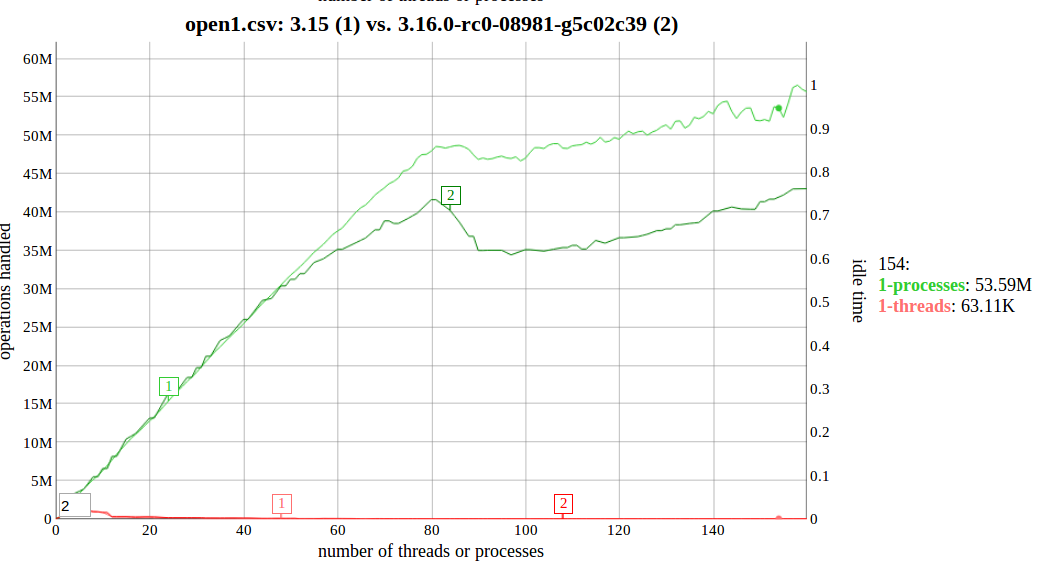
> I'm seeing a regression when comparing 3.15 to Linus's current tree.
> I'm using Anton Blanchard's will-it-scale "open1" test which creates a
> bunch of processes and does open()/close() in a tight loop:
>
> > https://github.com/antonblanchard/will-it-scale/blob/master/tests/open1.c
>
> At about 50 cores worth of processes, 3.15 and the pre-3.16 code start
> to diverge, with 3.15 scaling better:
>
> http://sr71.net/~dave/intel/3.16-open1regression-0.png
>
> Some profiles point to a big increase in contention inside slub.c's
> get_partial_node() (the allocation side of the slub code) causing the
> regression. That particular open() test is known to do a lot of slab
> operations. But, the odd part is that the slub code hasn't been touched
> much.
>
> So, I bisected it down to this:
>
> > commit ac1bea85781e9004da9b3e8a4b097c18492d857c
> > Author: Paul E. McKenney <[email protected]>
> > Date: Sun Mar 16 21:36:25 2014 -0700
> >
> > sched,rcu: Make cond_resched() report RCU quiescent states
>
> Specifically, if I raise RCU_COND_RESCHED_LIM, things get back to their
> 3.15 levels.
>
> Could the additional RCU quiescent states be causing us to be doing more
> RCU frees that we were before, and getting less benefit from the lock
> batching that RCU normally provides?
Quite possibly.  One way to check would be to use the debugfs files
rcu/*/rcugp, which give a count of grace periods since boot for each
RCU flavor.  Here "*" is rcu_preempt for CONFIG_PREEMPT and rcu_sched
for !CONFIG_PREEMPT.

Another possibility is that someone is invoking cond_reched() in an
incredibly tight loop.

> The top RCU functions in the profiles are as follows:
>
> > 3.15.0-xxx:     2.58%  open1_processes  [kernel.kallsyms]   [k]
> > file_free_rcu
> > 3.15.0-xxx:     2.45%  open1_processes  [kernel.kallsyms]   [k]
> > __d_lookup_rcu
> > 3.15.0-xxx:     2.41%  open1_processes  [kernel.kallsyms]   [k]
> > rcu_process_callbacks
> > 3.15.0-xxx:     1.87%  open1_processes  [kernel.kallsyms]   [k]
> > __call_rcu.constprop.10
>
> > 3.16.0-rc0:     2.68%  open1_processes  [kernel.kallsyms]  [k]
> > rcu_process_callbacks
> > 3.16.0-rc0:     2.68%  open1_processes  [kernel.kallsyms]  [k]
> > file_free_rcu
> > 3.16.0-rc0:     1.55%  open1_processes  [kernel.kallsyms]  [k]
> > __call_rcu.constprop.10
> > 3.16.0-rc0:     1.28%  open1_processes  [kernel.kallsyms]  [k]
> > __d_lookup_rcu
>
> With everything else equal, we'd expect to see all of these _higher_ in
> the profiles on a the faster kernel (3.15) since it has more RCU work to do.
>
> But, they're all _roughly_ the same.  __d_lookup_rcu went up in the
> profile on the fast one (3.15) probably because there _were_ more
> lookups happening there.
>
> rcu_process_callbacks makes me syspicious.  It went up slightly
> (probably in the noise), but it _should_ have dropped due to there being
> less RCU work to do.
>
> This supports the theory that there are more callbacks happening than
> before, causing more slab lock contention, which is the actual trigger
> for the performance drop.
>
> I also hacked in an interface to make RCU_COND_RESCHED_LIM a tunable.
> Making it huge instantly makes my test go fast, and dropping it to 256
> instantly makes it slow.  Some brief toying with it shows that
> RCU_COND_RESCHED_LIM has to be about 100,000 before performance gets
> back to where it was before.

That is way bigger than I would expect.  My bet is that someone is
invoking cond_resched() in a 10s-of-nanoseconds tight loop.

But please feel free to send along your patch, CCing LKML.  Longer
term, I probably need to take a more algorithmic approach, but what
you have will be useful to benchmarkers until then.

                                                        Thanx, Paul

--
To unsubscribe from this list: send the line "unsubscribe linux-kernel" in
the body of a message to [email protected]
More majordomo info at  http://vger.kernel.org/majordomo-info.html
Please read the FAQ at  http://www.tux.org/lkml/