Hi John,
Does
  fig = figure(frameon=False)
do what you want?
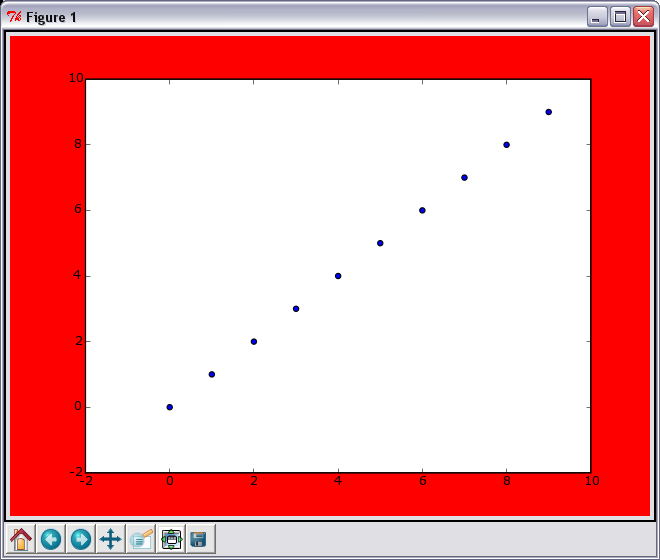
Apperently not:
from pylab import *
x = range(10)
figure(1, frameon=False, facecolor='r')
scatter(x, x)
show()
Produces the picture given in attachment. I just want to get rid of
the damn red area :) So my graph will takeup the whole space on the
viewport.

PS: If it's any good to you I'm planning to use it with NetworkX -
https://networkx.lanl.gov/

TIA!
--
Petar Marić
*e-mail: [EMAIL PROTECTED]
*mobile: +381 (64) 6122467

*icq: 224720322
*skype: petar_maric
*web: http://www.petarmaric.com/
![]() figure.PNG
figure.PNG
Description: PNG image
Using Tomcat but need to do more? Need to support web services, security?
Get stuff done quickly with pre-integrated technology to make your job easier
Download IBM WebSphere Application Server v.1.0.1 based on Apache Geronimo
http://sel.as-us.falkag.net/sel?cmd=lnk&kid=120709&bid=263057&dat=121642
_______________________________________________
Matplotlib-users mailing list
[email protected]
https://lists.sourceforge.net/lists/listinfo/matplotlib-users