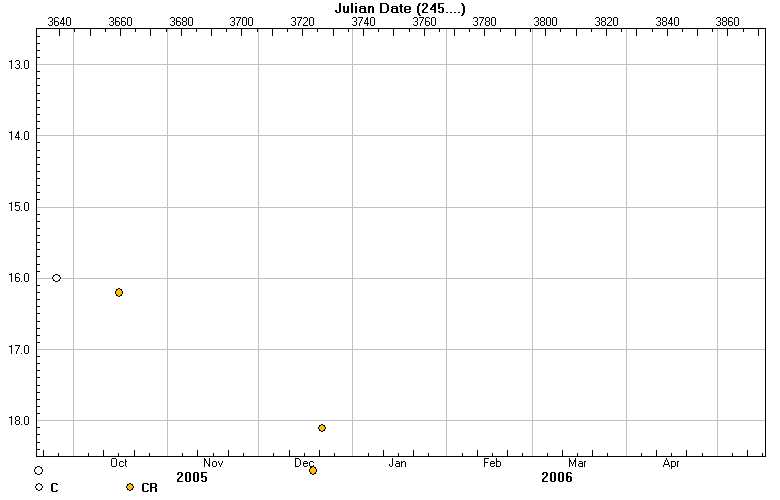
Hi,

I'd like to plot some dates on a figure with two different x-axes: the
bottom one with date labels (strings), and the top one with julian date
labels (integers), see
http://www.astrosurf.com/snweb2/2005/05el/curves/05elF_10.jpg for an
example.
I tried to follow the method mentionned in
http://sourceforge.net/mailarchive/message.php?msg_id=11822985, but
unfortunately, this didn't work: as mentionned in
http://sourceforge.net/mailarchive/message.php?msg_id=11824491, it looks
impossible to use different tick formatters for different axes (in my
case a DateFormatter for the bottom axis, and a FormatStrFormatter for
the top one).

Any suggestion for this???

Cheers.

PS: as a side-question, is there an integrated way to convert a date
(e.g. matplotlib.datetime.date(2006,8,10)) to a julian date (2453958)
using matplotlib?
--
             /  \     ,    ,
   _._     _ |oo| _  / \__/ \
  _||||   ((/ () \))   /  \      Yannick COPIN  (o:>*  Doctus cum libro
  |||||/|  ( ==== )    |oo|      Institut de physique nucleaire de Lyon
   \____/  _`\  /'_    /  \                            (IN2P3 - France)
   /   /.-' /\<>/\ `\.( () )_._  Tel: (33/0) 472 431 968
   |    `  /  \/  \  /`'--'////) http://snovae.in2p3.fr/ycopin/
    \__,-'`|  |.  |\/ |/\/\|"\"` AIM: YcCopin    ICQ: 236931013
       jgs |  |.  | \___/\___/
           |  |.  |   |    |

-------------------------------------------------------------------------
Using Tomcat but need to do more? Need to support web services, security?
Get stuff done quickly with pre-integrated technology to make your job easier
Download IBM WebSphere Application Server v.1.0.1 based on Apache Geronimo
http://sel.as-us.falkag.net/sel?cmd=lnk&kid=120709&bid=263057&dat=121642
_______________________________________________
Matplotlib-users mailing list
[email protected]
https://lists.sourceforge.net/lists/listinfo/matplotlib-users