Hi,

Unfortunately z-sorting the polygons is a really hard problem. Or in
fact, in the way it is currently implemented, an unsolvable problem.
Please remember that mplot3d is not a full-blown 3d engine. Fixing
this would require either a z-buffer or things such as BSP trees,
which I do not think are feasible to implement.
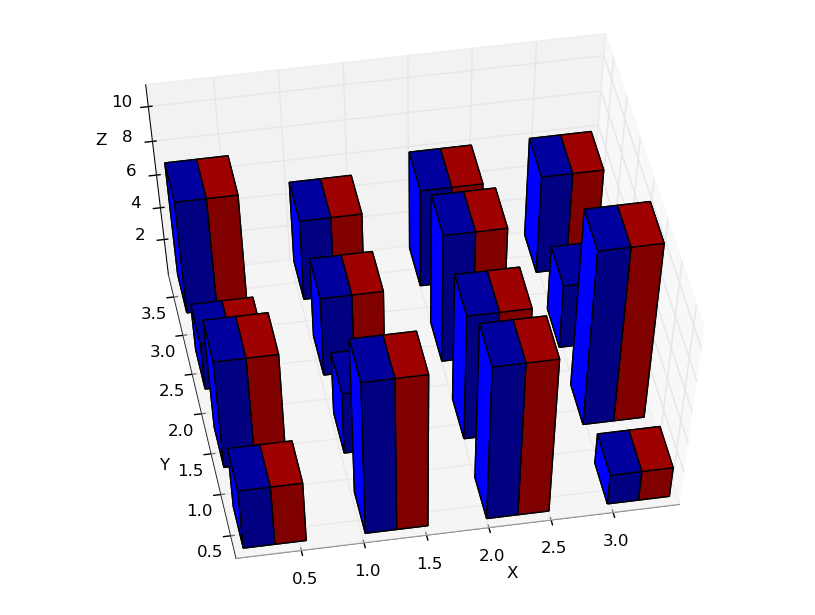
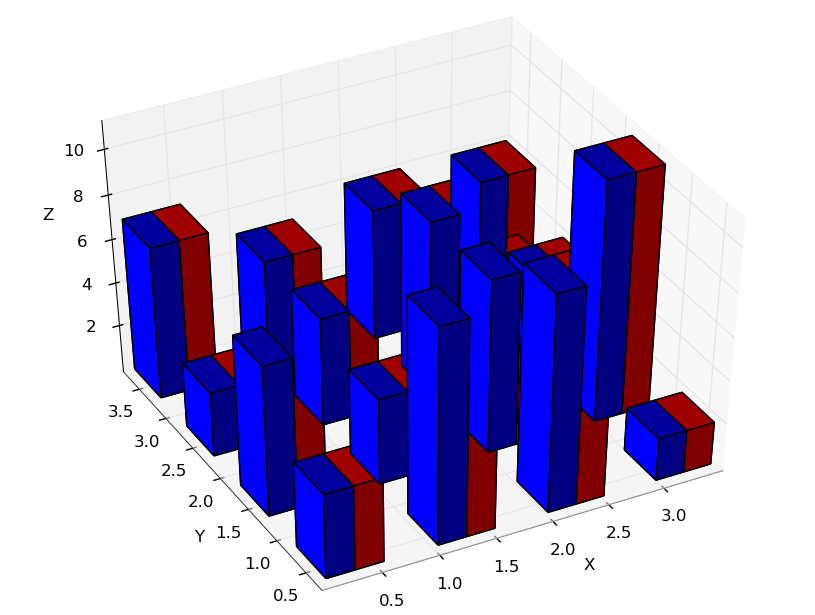
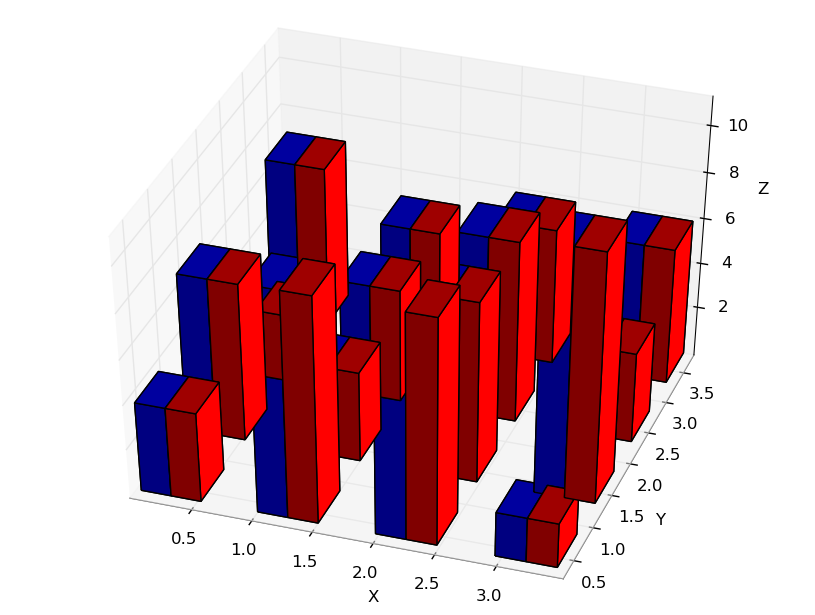
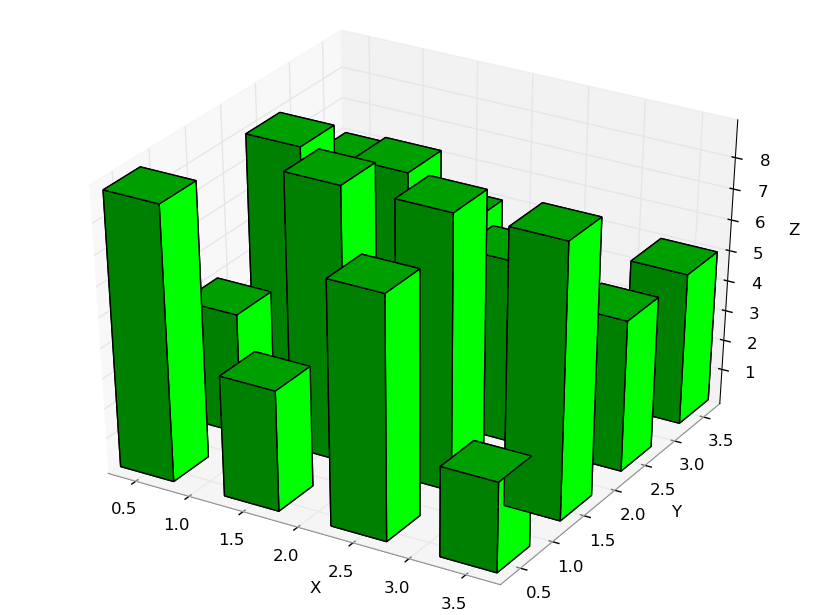
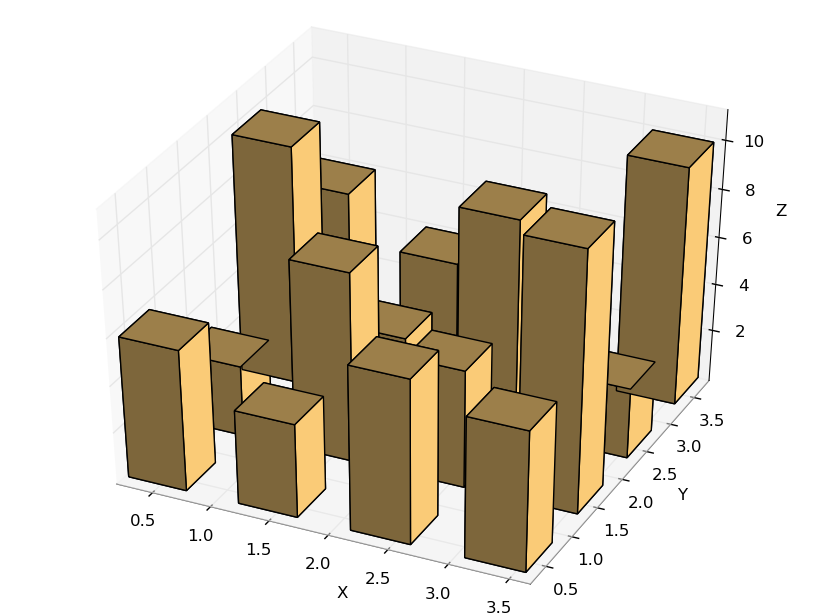
However, I do believe that there might be a small bug lurking
somewhere or some other slight improvements to be made. I'll try to
look into it after my 2 week holiday.

Regards,
Reinier

On Thu, Jan 28, 2010 at 8:42 PM, baxelrod <[email protected]> wrote:
>
> I am also seeing this behavior and it is unfortunately holding my project
> back.
>
> I have seen it with python 2.6 on Debian Linux and Windows XP.  I have seen
> it in version 0.99.1 and the latest SVN tree (as of yesterday).
>
> I want to highlight a portion of each 3d bar with another color.  This image
> shows what I want to do:
> http://old.nabble.com/file/p27358778/bar3d-1.png
> (http://www.benaxelrod.com/temp/bar3d-1.png)
>
> But rotating the view leads to rendering issues:
> http://old.nabble.com/file/p27358778/bar3d-2.png
> (http://www.benaxelrod.com/temp/bar3d-2.png)
>
> http://old.nabble.com/file/p27358778/bar3d-3.png
> (http://www.benaxelrod.com/temp/bar3d-3.png)
>
> In this example, the bars are drawn next to each other.  Here is the source
> code to generate the images:
>
> # code adapted from: hist3d_demo.py
> from mpl_toolkits.mplot3d import Axes3D
> import matplotlib.pyplot as plt
> import numpy as np
>
> fig = plt.figure()
> ax = Axes3D(fig)
> x, y = np.random.rand(2, 100) * 4
> hist, xedges, yedges = np.histogram2d(x, y, bins=4)
>
> elements = (len(xedges) - 1) * (len(yedges) - 1)
> xpos, ypos = np.meshgrid(xedges[:-1]+0.25, yedges[:-1]+0.25)
>
> xpos = xpos.flatten()
> ypos = ypos.flatten()
> zpos = np.zeros(elements)
>
> dx = 0.5 * np.ones_like(zpos)
> dy = dx.copy()
> dz = hist.flatten()
>
> dx = dx*0.5
> xpos = xpos - dx
>
> ax.bar3d(xpos, ypos, zpos, dx, dy, dz, color='b')
> ax.bar3d(xpos+dx, ypos, zpos, dx, dy, dz, color='r')
>
> ax.set_xlabel('X')
> ax.set_ylabel('Y')
> ax.set_zlabel('Z')
>
> plt.show()
> #end code
>
> I also tried to overlap the bars, but the result was even worse because from
> certain angles one of the colors was not visible at all.
>
> I thought that the issue might be due to calling bar3d muliple times.  So I
> tried passing in an array of collors to bar3d with no luck.  It seems that
> bar3d only takes a single color.  Is this planned to be fixed so that
> bar3d() can take a color array just like bar()?
>
> Also note that even very simple examples demonstrate the bug.  For example:
> http://old.nabble.com/file/p27358778/bar3d-4.png
> (http://www.benaxelrod.com/temp/bar3d-4.png)
>
> http://old.nabble.com/file/p27358778/bar3d-5.png
> (http://www.benaxelrod.com/temp/bar3d-5.png)
>
> Thanks,
> -Ben
>
>
> pierre-yves.debrito wrote:
>>
>> Hi,
>> I am currently using this version : matplotlib-0.99.1.win32-py2.6.exe
>> When I draw several Axes3D.bar3d in the same figure, as in this example,
>> the faces are not drawn in the correct order.
>> Did I do something wrong or is it a rendering bug?
>> Is there a workaround?
>>
>> Thanks
>> Pierre-Yves de Brito
>>
>>
>>
>>
>>
>> from mpl_toolkits.mplot3d import Axes3D
>> import matplotlib.pyplot as plt
>> from numpy import array, arange
>>
>>
>> contrib=[[0.18263,0.19098,0.16815,0.16295,0.09372,0.10505,0.15934],
>> [0.00769,0.01315,0.01668,0.01645,0.03536,0.03493,0.00599],
>> [0.47109,0.43646,0.43171,0.41794,0.14761,0.09472,0.21969],
>> [0.25633,0.28820,0.34066,0.37184,0.68048,0.72773,0.57749],
>> [0.06492,0.05539,0.03205,0.02151,0.03357,0.02411,0.01512]]
>>
>> print contrib[0]
>> N = 7
>> ind = arange(N)    # the x locations for the groups
>> width = 0.1       # the width of the bars: can also be len(x) sequence
>>
>>
>> I  = array([1,1,1,1,1,1,1])
>>
>> fig = plt.figure()
>> ax = Axes3D(fig)
>>
>> for i in range(1,7):
>>     ax.bar3d(ind[i], 0, 0, 0.1, 0.1, contrib[0][i], color='b')
>>     ax.bar3d(array(ind[i])+0.15,  0, 0, 0.1, 0.1, contrib[1][i], color='r'
>> )
>>     ax.bar3d(array(ind[i])+2*0.15,  0, 0, 0.1, 0.1, contrib[2][i], color=
>> 'g')
>>     ax.bar3d(array(ind[i])+3*0.15,  0, 0, 0.1, 0.1, contrib[3][i], color=
>> 'c')
>>     ax.bar3d(array(ind[i])+4*0.15,  0, 0, 0.1, 0.1, contrib[4][i], color=
>> 'm')
>>
>> plt.show()
>>
>>
>>
>>
>> This message and any attachments (the "message") is
>> intended solely for the addressees and is confidential.
>> If you receive this message in error, please delete it and
>> immediately notify the sender. Any use not in accord with
>> its purpose, any dissemination or disclosure, either whole
>> or partial, is prohibited except formal approval. The internet
>> can not guarantee the integrity of this message.
>> BNP PARIBAS (and its subsidiaries) shall (will) not
>> therefore be liable for the message if modified.
>> Do not print this message unless it is necessary,
>> consider the environment.
>>
>>                 ---------------------------------------------
>>
>> Ce message et toutes les pieces jointes (ci-apres le
>> "message") sont etablis a l'intention exclusive de ses
>> destinataires et sont confidentiels. Si vous recevez ce
>> message par erreur, merci de le detruire et d'en avertir
>> immediatement l'expediteur. Toute utilisation de ce
>> message non conforme a sa destination, toute diffusion
>> ou toute publication, totale ou partielle, est interdite, sauf
>> autorisation expresse. L'internet ne permettant pas
>> d'assurer l'integrite de ce message, BNP PARIBAS (et ses
>> filiales) decline(nt) toute responsabilite au titre de ce
>> message, dans l'hypothese ou il aurait ete modifie.
>> N'imprimez ce message que si necessaire,
>> pensez a l'environnement.
>>
>>
>>
>> ------------------------------------------------------------------------------
>> Let Crystal Reports handle the reporting - Free Crystal Reports 2008
>> 30-Day
>> trial. Simplify your report design, integration and deployment - and focus
>> on
>> what you do best, core application coding. Discover what's new with
>> Crystal Reports now.  http://p.sf.net/sfu/bobj-july
>> _______________________________________________
>> Matplotlib-users mailing list
>> [email protected]
>> https://lists.sourceforge.net/lists/listinfo/matplotlib-users
>>
>>
>
> --
> View this message in context:
> http://old.nabble.com/rendering-bug-in-bar3d-tp26413625p27358778.html
> Sent from the matplotlib - users mailing list archive at Nabble.com.
>
>
> ------------------------------------------------------------------------------
> The Planet: dedicated and managed hosting, cloud storage, colocation
> Stay online with enterprise data centers and the best network in the business
> Choose flexible plans and management services without long-term contracts
> Personal 24x7 support from experience hosting pros just a phone call away.
> http://p.sf.net/sfu/theplanet-com
> _______________________________________________
> Matplotlib-users mailing list
> [email protected]
> https://lists.sourceforge.net/lists/listinfo/matplotlib-users
>


--
Reinier Heeres
Tel: +31 6 10852639

------------------------------------------------------------------------------
The Planet: dedicated and managed hosting, cloud storage, colocation
Stay online with enterprise data centers and the best network in the business
Choose flexible plans and management services without long-term contracts
Personal 24x7 support from experience hosting pros just a phone call away.
http://p.sf.net/sfu/theplanet-com
_______________________________________________
Matplotlib-users mailing list
[email protected]
https://lists.sourceforge.net/lists/listinfo/matplotlib-users