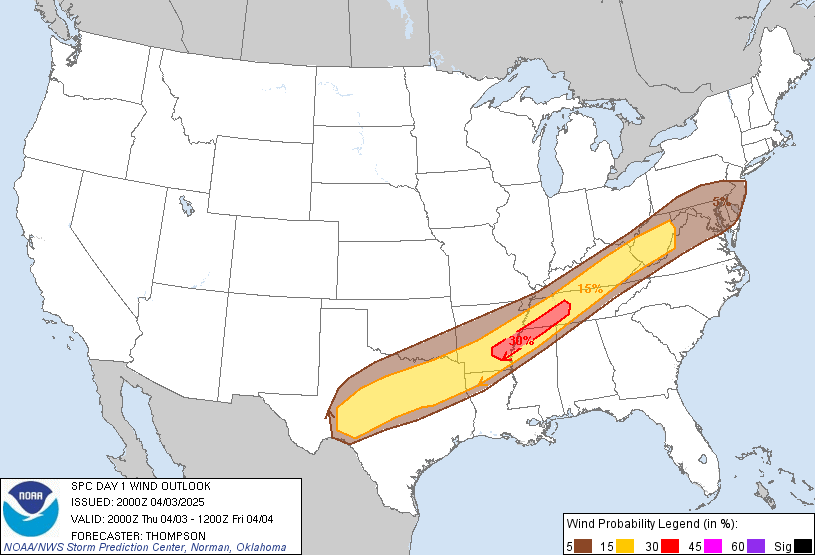
On Wed, Sep 28, 2011 at 16:39, Jeff Whitaker <[email protected]> wrote:
> On 9/28/11 2:19 PM, Isidora wrote:
>> Hi Filipe,
>>
>> I have just seen your answers.  I am trying to plot on a background GIF map,
>> lines like the ones you can see in
>> http://www.spc.noaa.gov/products/outlook/day1probotlk_2000_wind.gif.  I can
>> plot the lines as  you see them in this link without a problem.  However,
>> because those lines are not closed polygons, the filling extends only to a
>> straight line between first and last point of the curve.
>> I want the filling to extend all the way to the border of United States.
>>
>> Since drawcountries() return a Collection of paths without any metadata
>> identifying the country/countries been separated by it, I cannot use it to
>> mask the area outside ofthe borders out.
>>
>> I'd appreciate any link/documentation I could read to help me resolve this
>> issue.
>>
>> Thank you
> Isidora
>
> Nobody has tried to do this (that I know of), so I can't point you to
> anything specific.  Did you see my message about creating a gridded
> field (say 1's for points inside and 0's for points outside the region),
> the calling contour to draw the line?  You can use the is_land method to
> determine if a point is over land or not, but there is not way to
> determine whether a given point is inside a country.  As you found out,
> there is no metadata associated with the coastlines or political
> boundary lines.
>
> The fillcontinents method returns a list matplotlib polygon instances
> that represent the land areas.  One of them is North America, and could
> be used to clip your line segments - but there is no easy way to
> determine which one it is.
>
> If you can find a shapefile that just contains a CONUS polygon, you
> could use that I suppose.
I guess that Jeff suggestion of manipulation a shapefile might be the
easiest way to do this, here is an example that might help you.

http://www.geophysique.be/en/2011/01/27/matplotlib-basemap-tutorial-07-shapefiles-unleached/

-Filipe

> -Jeff
>
> --
> Jeffrey S. Whitaker         Phone  : (303)497-6313
> Meteorologist               FAX    : (303)497-6449
> NOAA/OAR/PSD  R/PSD1        Email  : [email protected]
> 325 Broadway                Office : Skaggs Research Cntr 1D-113
> Boulder, CO, USA 80303-3328 Web    : http://tinyurl.com/5telg
>
>
> ------------------------------------------------------------------------------
> All the data continuously generated in your IT infrastructure contains a
> definitive record of customers, application performance, security
> threats, fraudulent activity and more. Splunk takes this data and makes
> sense of it. Business sense. IT sense. Common sense.
> http://p.sf.net/sfu/splunk-d2dcopy1
> _______________________________________________
> Matplotlib-users mailing list
> [email protected]
> https://lists.sourceforge.net/lists/listinfo/matplotlib-users
>

------------------------------------------------------------------------------
All the data continuously generated in your IT infrastructure contains a
definitive record of customers, application performance, security
threats, fraudulent activity and more. Splunk takes this data and makes
sense of it. Business sense. IT sense. Common sense.
http://p.sf.net/sfu/splunk-d2dcopy1
_______________________________________________
Matplotlib-users mailing list
[email protected]
https://lists.sourceforge.net/lists/listinfo/matplotlib-users