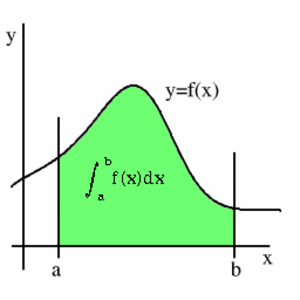
> I have a coordination system with some plotted dots connected with a
> line. Now I'd like to fill up the whole space between the line and the
> x-axis. It is the same as in a integral calculation:
> http://www.definicionabc.com/wp-content/uploads/Integral.png
> What I want to do is the same as the green color in the linked picture.
You can find an example in the matplotlib gallery
(http://matplotlib.org/gallery.html):

   http://matplotlib.org/examples/pylab_examples/fill_between_demo.html

The function you're looking for is ``fill_between``.

Cheers, Andreas.


------------------------------------------------------------------------------
Don't let slow site performance ruin your business. Deploy New Relic APM
Deploy New Relic app performance management and know exactly
what is happening inside your Ruby, Python, PHP, Java, and .NET app
Try New Relic at no cost today and get our sweet Data Nerd shirt too!
http://p.sf.net/sfu/newrelic-dev2dev
_______________________________________________
Matplotlib-users mailing list
[email protected]
https://lists.sourceforge.net/lists/listinfo/matplotlib-users