Dear Jordi,

Reading monitorix.cgi I realised how out of focus my question was. I am
sorry to have bothered for this.
The system already does, as you repeated, exactly what I wanted.
Bests
Elias Crespin
2016-02-15 18:33 GMT+01:00 Elias Crespin <el...@ateliercrespin.com>:
> I just found the multihost function in the monitorix.cgi script. I will
> work from there. I believe its a good lead....
>
> Thx!!
>
> 2016-02-15 18:29 GMT+01:00 Elias Crespin <el...@ateliercrespin.com>:
>
>> Hi again,
>>
>> Good news about the new multihost plans. Now, is there a way - without
>> rewriting the whole thing - to adapt the current multihost Monitorix
>> modules to be able to display other graphs than CPU load? For example 'file
>> system usage' or 'network traffic' or others ? This could be very useful,
>> as I believe you know, so the user can compare, for example, network
>> traffic among all the involved nodes.
>>
>> Sorry to insist. I'm open to writing code and adapting the system, but
>> maybe there is a better way and you can point me in the right direction.
>>
>> Thanks
>>
>> Elias
>>
>> 2016-02-15 18:17 GMT+01:00 Jordi Sanfeliu <jo...@fibranet.cat>:
>>
>>> Hello Elias,
>>>
>>> On 02/15/2016 01:34 PM, monitorix-general-boun...@lists.sourceforge.net
>>> wrote:
>>> >
>>> > Hello Jordi,
>>> >
>>> >
>>> > I have installed Monitorix in a set of 5 Raspberrys and it works great
>>> > on each. It is a smart and useful tool. Thank you very much!!
>>>
>>> You're very welcome, I'm glad to know you are enjoying Monitorix.
>>>
>>>
>>> > I have more nodes to be added shortly.
>>> > I have a tow parts question:
>>> >
>>> > 1. I added a new custom graphic by copying one of the .pm modules,
>>> > renaming and modifying it to initialise, update and request the
>>> > information I needed.
>>> >
>>> > I wonder if there is another default procedure that you would suggest
>>> > for adding custom graphs from custom data sources.
>>>
>>> No, since there isn't any special procedure for this, that's the right
>>> way to proceed.
>>>
>>>
>>> >
>>> > 2. I need to specify different graphs, other than the 'system load' for
>>> > multi server monitoring.
>>> > I copied the generated page into a static html and changed the URL to
>>> > request different graphs. This approach lacks some flexibility.
>>> > I would greatly appreciate if you can help me achieve multi server
>>> > monitor of any of the graphs.
>>>
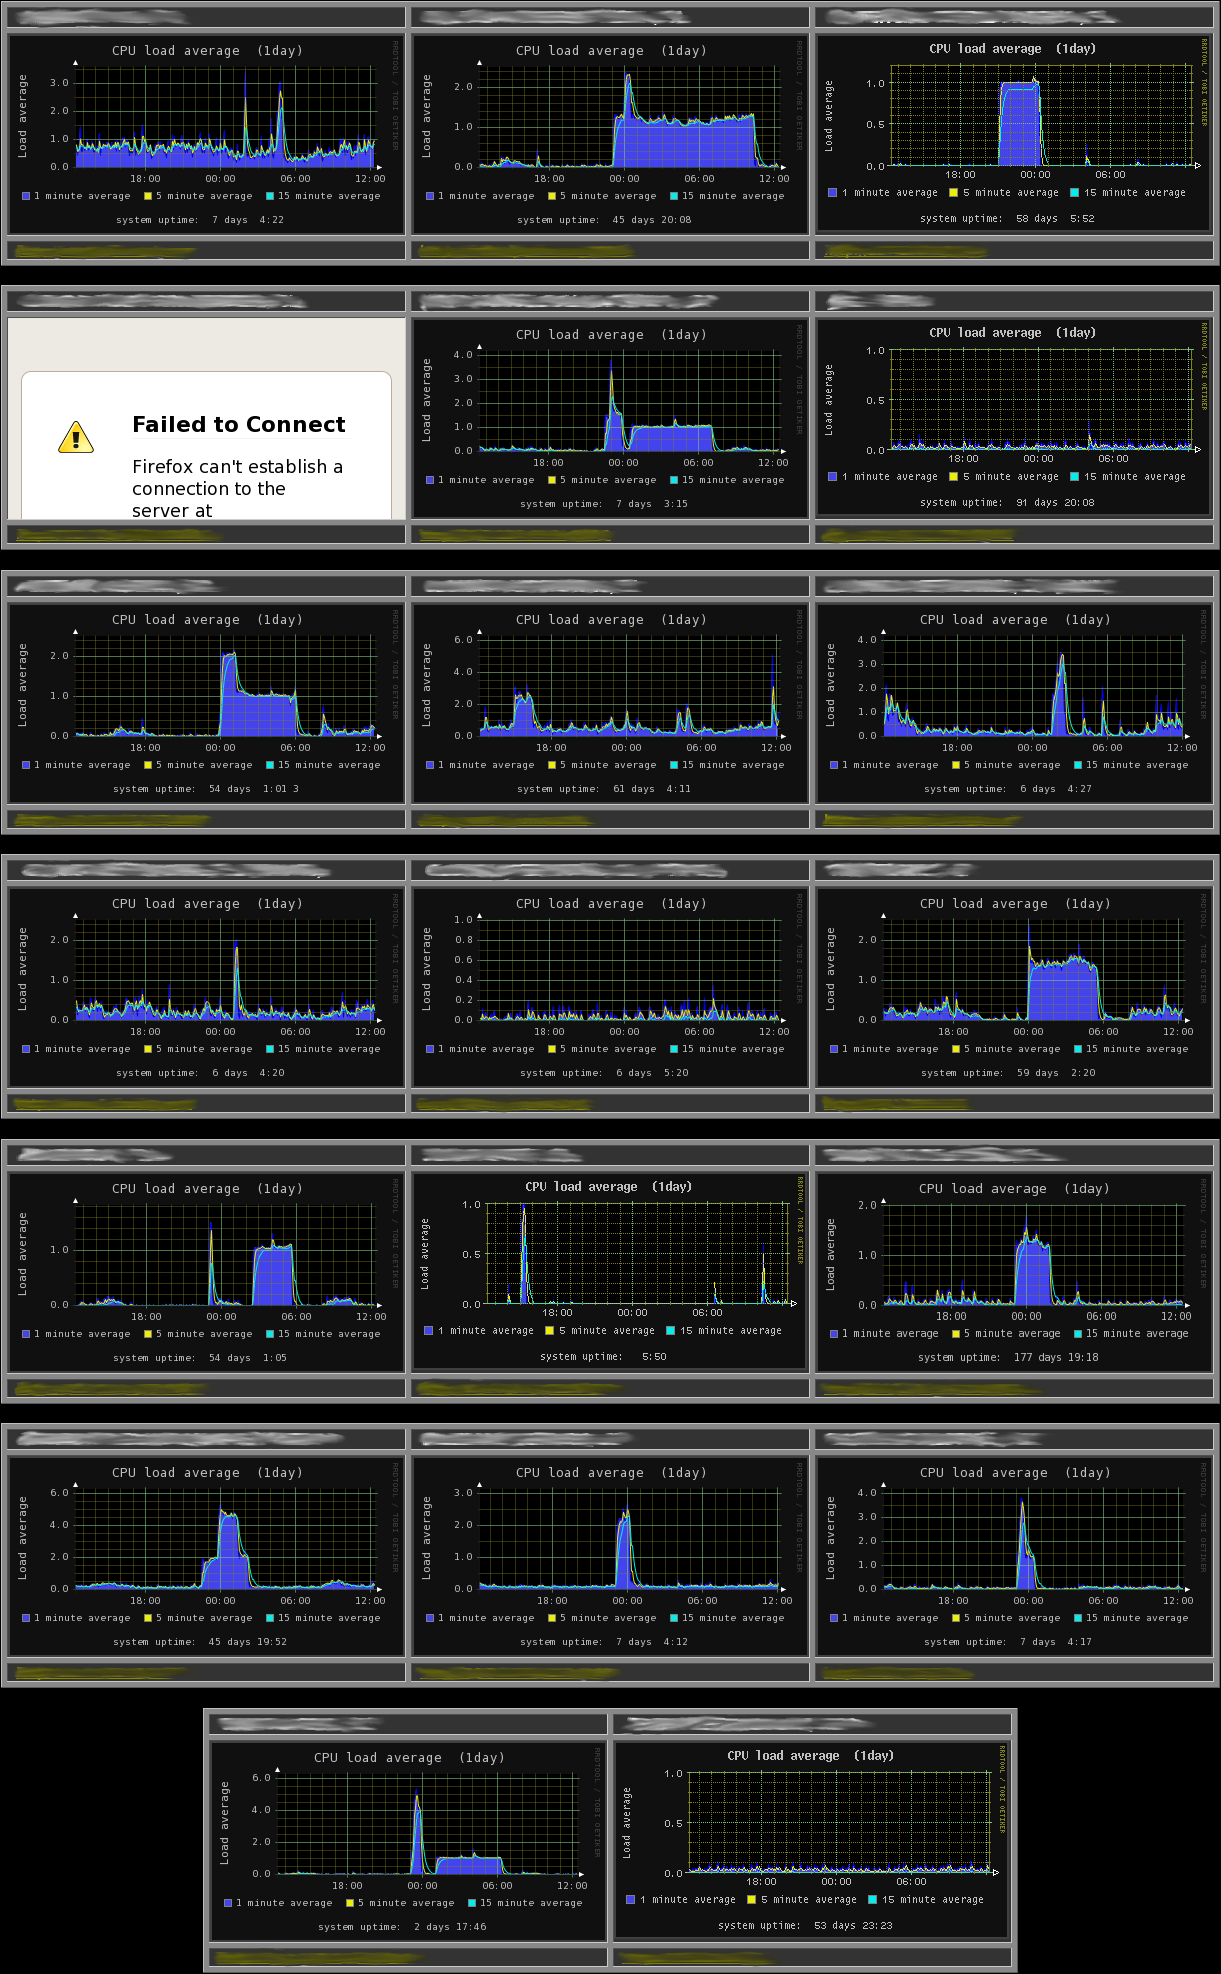
>>> The 'Multihost' feature should help you exactly on this. Please, check
>>> the following screenshot to get an idea of it:
>>>
>>> <http://www.monitorix.org/imgs/multihost.png>
>>>
>>> Multihost option is pending to have a complete rewrite which will
>>> include numerous new features. I just hope to have enough spare time to
>>> start developing its next version.
>>>
>>>
>>> >
>>> > As a side comment, one immediate insight I obtained from Monitorix is
>>> to
>>> > witness the huge performance difference between RPi B+ and RPi 2. The
>>> > later has 3x less kernel usage than the B+. Although I knew about the
>>> > difference and I have both models installed, I had not been able to
>>> have
>>> > such a clear comparison until now. Great!!! ....and this is just the
>>> > beginning....
>>>
>>> Heh, that's great! :)
>>>
>>>
>>> >
>>> > With my due respect and thankfulness,
>>> >
>>> > Elias Crespin
>>> >
>>>
>>> Best regards.
>>>
>>> --
>>> Jordi Sanfeliu
>>> FIBRANET Network Services Provider
>>> http://www.fibranet.cat
>>>
>>>
>>> ------------------------------------------------------------------------------
>>> Site24x7 APM Insight: Get Deep Visibility into Application Performance
>>> APM + Mobile APM + RUM: Monitor 3 App instances at just $35/Month
>>> Monitor end-to-end web transactions and take corrective actions now
>>> Troubleshoot faster and improve end-user experience. Signup Now!
>>> http://pubads.g.doubleclick.net/gampad/clk?id=272487151&iu=/4140
>>> _______________________________________________
>>> Monitorix-general mailing list
>>> Monitorix-general@lists.sourceforge.net
>>> https://lists.sourceforge.net/lists/listinfo/monitorix-general
>>>
>>
>>
>
------------------------------------------------------------------------------
Site24x7 APM Insight: Get Deep Visibility into Application Performance
APM + Mobile APM + RUM: Monitor 3 App instances at just $35/Month
Monitor end-to-end web transactions and take corrective actions now
Troubleshoot faster and improve end-user experience. Signup Now!
http://pubads.g.doubleclick.net/gampad/clk?id=272487151&iu=/4140
_______________________________________________
Monitorix-general mailing list
Monitorix-general@lists.sourceforge.net
https://lists.sourceforge.net/lists/listinfo/monitorix-general