This is an automated email from the ASF dual-hosted git repository.

Yilialinn pushed a commit to branch master
in repository https://gitbox.apache.org/repos/asf/apisix.git
The following commit(s) were added to refs/heads/master by this push:
new aaabee1a7 docs: update error-log-logger and datadog plugin docs
(#13270)
aaabee1a7 is described below
commit aaabee1a7b38bc106945ddfce23490c1334d2d44
Author: Yilia Lin <[email protected]>
AuthorDate: Tue Apr 28 16:39:34 2026 +0800
docs: update error-log-logger and datadog plugin docs (#13270)
---
docs/en/latest/plugins/datadog.md | 214 ++++++++++---------
docs/en/latest/plugins/elasticsearch-logger.md | 4 +-
docs/en/latest/plugins/error-log-logger.md | 265 ++++++++++++++---------
docs/zh/latest/plugins/datadog.md | 254 +++++++++++-----------
docs/zh/latest/plugins/elasticsearch-logger.md | 4 +-
docs/zh/latest/plugins/error-log-logger.md | 278 +++++++++++++++----------
6 files changed, 561 insertions(+), 458 deletions(-)
diff --git a/docs/en/latest/plugins/datadog.md
b/docs/en/latest/plugins/datadog.md
index 5cf6c8cea..e5bd330e5 100644
--- a/docs/en/latest/plugins/datadog.md
+++ b/docs/en/latest/plugins/datadog.md
@@ -5,7 +5,7 @@ keywords:
- API Gateway
- Plugin
- Datadog
-description: This document contains information about the Apache APISIX
datadog Plugin.
+description: The datadog Plugin integrates with Datadog, sending metrics to
DogStatsD in batches to improve API monitoring and performance tracking.
---
<!--
@@ -27,144 +27,162 @@ description: This document contains information about the
Apache APISIX datadog
#
-->
-## Description
-
-The `datadog` monitoring Plugin is for seamless integration of APISIX with
[Datadog](https://www.datadoghq.com/), one of the most used monitoring and
observability platform for cloud applications.
-
-When enabled, the Plugin supports multiple metric capture types for request
and response cycles.
+<head>
+ <link rel="canonical" href="https://docs.api7.ai/hub/datadog"; />
+</head>
-This Plugin, pushes its custom metrics to the
[DogStatsD](https://docs.datadoghq.com/developers/dogstatsd/?tab=hostagent)
server over UDP protocol and comes bundled with [Datadog
agent](https://docs.datadoghq.com/agent/).
+## Description
-DogStatsD implements the StatsD protocol which collects the custom metrics for
the Apache APISIX agent, aggregates them into a single data point, and sends it
to the configured Datadog server.
+The `datadog` Plugin supports integration with
[Datadog](https://www.datadoghq.com/), one of the most widely used
observability services for cloud applications. When enabled, the Plugin pushes
metrics to the
[DogStatsD](https://docs.datadoghq.com/developers/dogstatsd/?tab=hostagent)
server, which comes bundled with the [Datadog
agent](https://docs.datadoghq.com/agent/), over UDP protocol.
-This Plugin provides the ability to push metrics as a batch to the external
Datadog agent, reusing the same datagram socket. It might take some time to
receive the log data. It will be automatically sent after the timer function in
the [batch processor](../batch-processor.md) expires.
+This Plugin provides the ability to push metrics as a batch to the external
Datadog agent over UDP. It might take some time to receive the metric data. It
will be automatically sent after the timer function in the [batch
processor](../batch-processor.md) expires.
## Attributes
-| Name | Type | Required | Default | Valid values | Description
|
-| -------------- | ------- | -------- | ------- | ------------ |
----------------------------------------------------------------------------------------------------------------
|
-| prefer_name | boolean | False | true | [true,false] | When set to
`false`, uses Route/Service ID instead of name (default) with metric tags.
|
-| include_path | boolean | False | false | [true,false] | When set to
`true`, includes the path pattern in metric tags.
|
-| include_method | boolean | False | false | [true,false] | When set to
`true`, includes the HTTP method in metric tags.
|
-| constant_tags | array | False | [] | | Static tags
to embed into all metrics generated by this route. Useful for grouping metrics
over certain signals. |
+| Name | Type | Required | Default | Valid values | Description
|
+| -------------- | ------- | -------- | ------- | -------------- |
------------------------------------------------------------------------------------------------------------------------
|
+| prefer_name | boolean | False | true | [true, false] | If true,
exports Route/Service name instead of their ID in metric tags.
|
+| include_path | boolean | False | false | [true, false] | If true,
includes the path pattern in metric tags.
|
+| include_method | boolean | False | false | [true, false] | If true,
includes the HTTP method in metric tags.
|
+| constant_tags | array | False | [] | | Static
key-value tags attached to all metrics generated by this Route. Useful for
grouping metrics over certain signals. |
+| batch_max_size | integer | False | 1000 | [1,...] | Maximum
number of metric entries per batch. Once reached, the batch is sent to the
Datadog agent. Set to `1` for immediate processing. |
+| inactive_timeout | integer | False | 5 | [1,...] | Maximum
time in seconds to wait for new metric entries before sending the batch. The
value should be smaller than `buffer_duration`. |
+| buffer_duration | integer | False | 60 | [1,...] | Maximum
time in seconds from the earliest metric entry allowed before sending the
batch. |
+| retry_delay | integer | False | 1 | [0,...] | Time
interval in seconds to retry sending the batch if the previous attempt failed.
|
+| max_retry_count | integer | False | 0 | [0,...] | Maximum
number of unsuccessful retries before dropping the metric entries.
|
-This Plugin supports using batch processors to aggregate and process entries
(logs/data) in a batch. This avoids the need for frequently submitting the
data. The batch processor submits data every `5` seconds or when the data in
the queue reaches `1000`. See [Batch
Processor](../batch-processor.md#configuration) for more information or setting
your custom configuration.
+This Plugin supports using batch processors to aggregate and process metric
data in a batch. This avoids the need to submit data too frequently. The batch
processor submits data every `5` seconds or when the data in the queue reaches
`1000`. See [Batch Processor](../batch-processor.md#configuration) for more
information or to customize the configuration.
-## Metadata
+## Plugin Metadata
-You can configure the Plugin through the Plugin metadata.
+You can configure the Plugin through Plugin metadata.
| Name | Type | Required | Default | Description
|
| ------------- | ------- | -------- | ------------------- |
-----------------------------------------------------------------------------------------------------------------------------------------
|
| host | string | False | "127.0.0.1" | DogStatsD server
host address.
|
-| port | integer | False | 8125 | DogStatsD server
host port.
|
-| namespace | string | False | "apisix" | Prefix for all
custom metrics sent by APISIX agent. Useful for finding entities for metrics
graph. For example, `apisix.request.counter`. |
-| constant_tags | array | False | [ "source:apisix" ] | Static tags to
embed into generated metrics. Useful for grouping metrics over certain signals.
|
+| port | integer | False | 8125 | DogStatsD server
port.
|
+| namespace | string | False | "apisix" | Prefix for all
custom metrics sent by the APISIX agent. Useful for finding entities for
metrics graph. For example, `apisix.request.counter`. |
+| constant_tags | array | False | [ "source:apisix" ] | Static tags to
embed into generated metrics. Useful for grouping metrics over certain signals.
See [defining
tags](https://docs.datadoghq.com/getting_started/tagging/#defining-tags) for
more. |
-:::tip
+## Metrics
-See [defining
tags](https://docs.datadoghq.com/getting_started/tagging/#defining-tags) to
know more about how to effectively use tags.
+The Plugin exports the following metrics by default.
-:::
+All metrics will be prefixed by the `namespace` configured in metadata. For
example, if `namespace` is set to `apisix`, the `request.counter` metric will
be exported as `apisix.request.counter` in Datadog.
-By default, the Plugin expects the DogStatsD service to be available at
`127.0.0.1:8125`. If you want to change this, you can update the Plugin
metadata as shown below:
+| Name | StatsD Type | Description
|
+| ---------------- | ----------- |
-----------------------------------------------------------------------------------------------------
|
+| request.counter | Counter | Number of requests received.
|
+| request.latency | Histogram | Time taken to process the request, in
milliseconds. |
+| upstream.latency | Histogram | Time taken to proxy the request to the
upstream server until a response is received, in milliseconds. |
+| apisix.latency | Histogram | Time taken by the APISIX agent to process
the request, in milliseconds. |
+| ingress.size | Timer | Request body size in bytes.
|
+| egress.size | Timer | Response body size in bytes.
|
-:::note
-You can fetch the `admin_key` from `config.yaml` and save to an environment
variable with the following command:
+## Tags
-```bash
-admin_key=$(yq '.deployment.admin.admin_key[0].key' conf/config.yaml | sed
's/"//g')
-```
+The Plugin exports metrics with the following
[tags](https://docs.datadoghq.com/getting_started/tagging). When there are no
suitable values for any particular tag, the tag will be omitted.
-:::
+| Name | Description
|
+| --------------------- |
-----------------------------------------------------------------------------------------------------------------------------
|
+| route_name | Name of the Route. If not present or if the
attribute `prefer_name` is set to false, falls back to the Route ID.
|
+| service_name | Name of the Service. If not present or if the
attribute `prefer_name` is set to false, falls back to the Service ID.
|
+| consumer | Username of the Consumer if the Route is connected
to a Consumer. |
+| balancer_ip | IP address of the upstream balancer that processes
the current request. |
+| response_status | HTTP response status code, such as `201`, `404`, or
`503`. |
+| response_status_class | HTTP response status code class, such as `2xx`,
`4xx`, or `5xx`. Available from APISIX version 3.14.0. |
+| scheme | Request scheme, such as HTTP and gRPC.
|
+| path | HTTP path pattern. Only available if the attribute
`include_path` is set to `true`. Available from APISIX version 3.14.0. |
+| method | HTTP method. Only available if the attribute
`include_method` is set to `true`. Available from APISIX version 3.14.0.
|
-```shell
-curl http://127.0.0.1:9180/apisix/admin/plugin_metadata/datadog -H "X-API-KEY:
$admin_key" -X PUT -d '
-{
- "host": "172.168.45.29",
- "port": 8126,
- "constant_tags": [
- "source:apisix",
- "service:custom"
- ],
- "namespace": "apisix"
-}'
-```
+## Examples
-To reset to default configuration, make a PUT request with empty body:
+The following examples demonstrate how you can configure the `datadog` Plugin
for different scenarios.
-```shell
-curl http://127.0.0.1:9180/apisix/admin/plugin_metadata/datadog -H "X-API-KEY:
$admin_key" -X PUT -d '{}'
-```
+Before proceeding, make sure you have installed the [Datadog
agent](https://docs.datadoghq.com/agent/), which collects events and metrics
from monitored objects and sends them to Datadog.
-## Exported metrics
+Start the Datadog agent with your API key, Datadog site, and hostname. Set
`DD_DOGSTATSD_NON_LOCAL_TRAFFIC` to `true` to listen to DogStatsD packets from
other containers:
-When the `datadog` Plugin is enabled, the APISIX agent exports the following
metrics to the DogStatsD server for each request/response cycle:
+```shell
+docker run -d \
+ --name dogstatsd-agent \
+ -e DD_API_KEY=<your-api-key> \
+ -e DD_SITE="us5.datadoghq.com" \
+ -e DD_HOSTNAME=apisix.quickstart \
+ -e DD_DOGSTATSD_NON_LOCAL_TRAFFIC=true \
+ -p 8125:8125/udp \
+ datadog/dogstatsd:latest
+```
-| Metric name | StatsD type | Description
|
-| ---------------- | ----------- |
-----------------------------------------------------------------------------------------------------
|
-| Request Counter | Counter | Number of requests received.
|
-| Request Latency | Histogram | Time taken to process the request (in
milliseconds). |
-| Upstream latency | Histogram | Time taken to proxy the request to the
upstream server till a response is received (in milliseconds). |
-| APISIX Latency | Histogram | Time taken by APISIX agent to process the
request (in milliseconds). |
-| Ingress Size | Timer | Request body size in bytes.
|
-| Egress Size | Timer | Response body size in bytes.
|
-
-The metrics will be sent to the DogStatsD agent with the following tags:
-
-- `route_name`: Name specified in the Route schema definition. If not present
or if the attribute `prefer_name` is set to false, falls back to the Route ID.
-- `service_name`: If a Route has been created with an abstracted Service, the
Service name/ID based on the attribute `prefer_name`.
-- `consumer`: If the Route is linked to a Consumer, the username will be added
as a tag.
-- `balancer_ip`: IP address of the Upstream balancer that processed the
current request.
-- `response_status`: HTTP response status code. E.g. "200", "404", "503".
-- `response_status_class`: HTTP response status code class. E.g. "2xx", "4xx",
"5xx".
-- `scheme`: Request scheme such as HTTP, gRPC, and gRPCs.
-- `path`: The HTTP path pattern. Only available if the attribute
`include_path` is set to true.
-- `method`: The HTTP method. Only available if the attribute `include_method`
is set to true.
+You can configure most options in the agent's main configuration file
`datadog.yaml` through environment variables prefixed with `DD_`. For more
information, see [agent environment
variables](https://docs.datadoghq.com/agent/guide/environment-variables).
:::note
-If there are no suitable values for any particular tag, the tag will be
omitted.
+You can fetch the `admin_key` from `config.yaml` and save to an environment
variable with the following command:
+
+```bash
+admin_key=$(yq '.deployment.admin.admin_key[0].key' conf/config.yaml | sed
's/"//g')
+```
:::
-## Enable Plugin
+### Update Datadog Agent Address and Metadata
-Once you have your Datadog agent running, you can enable the Plugin as shown
below:
+By default, the Plugin expects the DogStatsD server to be available at
`127.0.0.1:8125`. To customize the address and other metadata, update the
Plugin metadata. Set the host to your Datadog agent address, the port to the
agent listening port, the namespace to prefix all metrics, and add any constant
tags:
```shell
-curl http://127.0.0.1:9180/apisix/admin/routes/1 -H "X-API-KEY: $admin_key" -X
PUT -d '
-{
- "plugins": {
- "datadog": {}
- },
- "upstream": {
- "type": "roundrobin",
- "nodes": {
- "127.0.0.1:1980": 1
- }
- },
- "uri": "/hello"
-}'
+curl "http://127.0.0.1:9180/apisix/admin/plugin_metadata/datadog"; -X PUT \
+ -H "X-API-KEY: ${admin_key}" \
+ -d '{
+ "host": "192.168.0.90",
+ "port": 8125,
+ "namespace": "apisix",
+ "constant_tags": [
+ "source:apisix",
+ "service:custom"
+ ]
+ }'
```
-Now, requests to the endpoint `/hello` will generate metrics and push it to
the DogStatsD server.
+To reset to default configuration, send a request to the `datadog` Plugin
metadata with an empty body:
-## Delete Plugin
+```shell
+curl "http://127.0.0.1:9180/apisix/admin/plugin_metadata/datadog"; -X PUT \
+ -H "X-API-KEY: ${admin_key}" \
+ -d '{}'
+```
+
+### Monitor Route Metrics
-To remove the `datadog` Plugin, you can delete the corresponding JSON
configuration from the Plugin configuration. APISIX will automatically reload
and you do not have to restart for this to take effect.
+The following example demonstrates how to send the metrics of a particular
Route to Datadog.
+
+Create a Route with the `datadog` Plugin. Set `batch_max_size` to `1` to send
each metric immediately, and `max_retry_count` to `0` to disallow retries if
metrics were unsuccessfully sent:
```shell
-curl http://127.0.0.1:9180/apisix/admin/routes/1 -H "X-API-KEY: $admin_key" -X
PUT -d '
-{
- "methods": ["GET"],
- "uri": "/hello",
- "plugins": {},
+curl "http://127.0.0.1:9180/apisix/admin/routes"; -X PUT \
+ -H "X-API-KEY: ${admin_key}" \
+ -d '{
+ "id": "datadog-route",
+ "uri": "/anything",
+ "plugins": {
+ "datadog": {
+ "batch_max_size": 1,
+ "max_retry_count": 0
+ }
+ },
"upstream": {
- "type": "roundrobin",
- "nodes": {
- "127.0.0.1:1980": 1
- }
+ "type": "roundrobin",
+ "nodes": {
+ "httpbin.org:80": 1
+ }
}
-}'
+ }'
+```
+
+Generate a few requests to the Route:
+
+```shell
+curl "http://127.0.0.1:9080/anything";
```
+
+In Datadog, select **Metrics** from the left menu and go to **Explorer**.
Select `apisix.ingress.size.count` as the metric. You should see the count
reflecting the number of requests generated.
diff --git a/docs/en/latest/plugins/elasticsearch-logger.md
b/docs/en/latest/plugins/elasticsearch-logger.md
index dac354150..b7281ab5c 100644
--- a/docs/en/latest/plugins/elasticsearch-logger.md
+++ b/docs/en/latest/plugins/elasticsearch-logger.md
@@ -125,7 +125,7 @@ curl "http://127.0.0.1:9180/apisix/admin/routes"; -X PUT \
"elasticsearch-logger": {
"endpoint_addrs": ["http://elasticsearch:9200";],
"field": {
- "index": "gateway"
+ "index": "gateway",
}
}
},
@@ -288,7 +288,7 @@ curl "http://127.0.0.1:9180/apisix/admin/routes"; -X PUT \
"elasticsearch-logger": {
"endpoint_addrs": ["http://elasticsearch:9200";],
"field": {
- "index": "gateway"
+ "index": "gateway",
},
"include_req_body": true,
"include_req_body_expr": [["arg_log_body", "==", "yes"]]
diff --git a/docs/en/latest/plugins/error-log-logger.md
b/docs/en/latest/plugins/error-log-logger.md
index 039e429e5..2af9dac59 100644
--- a/docs/en/latest/plugins/error-log-logger.md
+++ b/docs/en/latest/plugins/error-log-logger.md
@@ -5,8 +5,9 @@ keywords:
- API Gateway
- Plugin
- Error log logger
-description: This document contains information about the Apache APISIX
error-log-logger Plugin.
+description: The error-log-logger Plugin pushes APISIX's error logs to TCP,
Apache SkyWalking, Apache Kafka, or ClickHouse servers, in batches. You can
specify the severity level for which the Plugin sends the corresponding logs.
---
+
<!--
#
# Licensed to the Apache Software Foundation (ASF) under one or more
@@ -26,48 +27,62 @@ description: This document contains information about the
Apache APISIX error-lo
#
-->
+<head>
+ <link rel="canonical" href="https://docs.api7.ai/hub/error-log-logger"; />
+</head>
+
## Description
-The `error-log-logger` Plugin is used to push APISIX's error logs
(`error.log`) to TCP, [Apache SkyWalking](https://skywalking.apache.org/),
Apache Kafka or ClickHouse servers. You can also set the error log level to
send the logs to server.
-
-It might take some time to receive the log data. It will be automatically sent
after the timer function in the [batch processor](../batch-processor.md)
expires.
-
-## Attributes
-
-| Name | Type | Required | Default
| Valid values
| Description
|
-|----------------------------------|---------|----------|--------------------------------|-----------------------------------------------------------------------------------------|--------------------------------------------------------------------------------------------------------------|
-| tcp.host | string | True |
|
| IP address or the hostname of the TCP server.
|
-| tcp.port | integer | True |
| [0,...]
| Target upstream port.
|
-| tcp.tls | boolean | False | false
|
| When set to `true` performs SSL verification.
|
-| tcp.tls_server_name | string | False |
|
| Server name for the new TLS extension SNI.
|
-| skywalking.endpoint_addr | string | False |
http://127.0.0.1:12900/v3/logs |
| Apache SkyWalking HTTP endpoint.
|
-| skywalking.service_name | string | False | APISIX
|
| Service name for the SkyWalking reporter.
|
-| skywalking.service_instance_name | String | False | APISIX Instance Name
|
| Service instance name for the SkyWalking reporter. Set it
to `$hostname` to directly get the local hostname. |
-| clickhouse.endpoint_addr | String | False |
http://127.0.0.1:8213 |
| ClickHouse endpoint.
|
-| clickhouse.user | String | False | default
|
| ClickHouse username.
|
-| clickhouse.password | String | False |
|
| ClickHouse password.
|
-| clickhouse.database | String | False |
|
| Name of the database to store the logs.
|
-| clickhouse.logtable | String | False |
|
| Table name to store the logs.
|
-| kafka.brokers | array | True | |
| List of Kafka brokers (nodes).
|
-| kafka.brokers.host | string | True |
| | The host of Kafka broker, e.g, `192.168.1.1`.
|
-| kafka.brokers.port | integer | True |
| [0, 65535] | The port of Kafka broker
|
-| kafka.brokers.sasl_config | object | False |
| | The sasl config of Kafka broker
|
-| kafka.brokers.sasl_config.mechanism | string | False | "PLAIN"
| ["PLAIN"] | The mechaism of sasl config
|
-| kafka.brokers.sasl_config.user | string | True |
| | The user of sasl_config. If sasl_config exists, it's
required.
|
-| kafka.brokers.sasl_config.password | string | True |
| | The password of sasl_config. If sasl_config exists,
it's required.
|
-| kafka.kafka_topic | string | True |
| | Target topic to push the logs for organisation.
|
-| kafka.producer_type | string | False | async
| ["async", "sync"] | Message sending mode of the producer.
|
-| kafka.required_acks | integer | False | 1
| [0, 1, -1] | Number of acknowledgements the leader needs to
receive for the producer to consider the request complete. This controls the
durability of the sent records. The attribute follows the same configuration as
the Kafka `acks` attribute. See [Apache Kafka
documentation](https://kafka.apache.org/documentation/#producerconfigs_acks)
for more. |
-| kafka.key | string | False |
| | Key used for allocating partitions for messages.
|
-| kafka.cluster_name | integer | False | 1 | [0,...]
| Name of the cluster. Used when there are two or more Kafka
clusters. Only works if the `producer_type` attribute is set to `async`.
|
-| kafka.meta_refresh_interval | integer | False | 30 | [1,...]
| `refresh_interval` parameter in
[lua-resty-kafka](https://github.com/doujiang24/lua-resty-kafka) specifies the
time to auto refresh the metadata, in seconds.|
-| timeout | integer | False | 3
| [1,...]
| Timeout (in seconds) for the upstream to connect and send
data. |
-| keepalive | integer | False | 30
| [1,...]
| Time in seconds to keep the connection alive after
sending data. |
-| level | string | False | WARN
| ["STDERR", "EMERG", "ALERT", "CRIT", "ERR", "ERROR", "WARN",
"NOTICE", "INFO", "DEBUG"] | Log level to filter the error logs. `ERR` is same
as `ERROR`. |
-
-NOTE: `encrypt_fields = {"clickhouse.password"}` is also defined in the
schema, which means that the field will be stored encrypted in etcd. See
[encrypted storage fields](../plugin-develop.md#encrypted-storage-fields).
-
-This Plugin supports using batch processors to aggregate and process entries
(logs/data) in a batch. This avoids the need for frequently submitting the
data. The batch processor submits data every `5` seconds or when the data in
the queue reaches `1000`. See [Batch
Processor](../batch-processor.md#configuration) for more information or setting
your custom configuration.
+The `error-log-logger` Plugin pushes APISIX's error logs (`error.log`) to TCP,
[Apache SkyWalking](https://skywalking.apache.org/), Apache Kafka, or
ClickHouse servers, in batches. You can specify the severity level of logs that
the Plugin sends.
+
+The Plugin is disabled by default. Once enabled, it will automatically start
pushing error logs to remote servers. You should configure remote server
details in Plugin metadata only, instead of on other resources, such as Routes.
+
+## Plugin Metadata
+
+There are no attributes to configure this Plugin on Routes or Services. All
configuration is done through Plugin metadata.
+
+| Name | Type | Required | Default
| Valid values
| Description
|
+| --------------------------------------- | ------- | -------- |
------------------------------ |
---------------------------------------------------------------------------------------
|
---------------------------------------------------------------------------------------------------------------------------------------------------
|
+| tcp | object | False |
|
| TCP server configurations.
|
+| tcp.host | string | True |
|
| IP address or the hostname of the TCP server.
|
+| tcp.port | integer | True |
| [0,...]
| Target upstream port.
|
+| tcp.tls | boolean | False | false
|
| When set to `true`, performs SSL verification.
|
+| tcp.tls_server_name | string | False |
|
| Server name for the new TLS extension SNI.
|
+| skywalking | object | False |
|
| SkyWalking server configurations.
|
+| skywalking.endpoint_addr | string | False |
http://127.0.0.1:12900/v3/logs |
| Address of the SkyWalking server.
|
+| skywalking.service_name | string | False | APISIX
|
| Service name for the SkyWalking reporter.
|
+| skywalking.service_instance_name | string | False | APISIX
Service Instance |
| Service instance name for the SkyWalking
reporter. Set it to `$hostname` to directly get the local hostname.
|
+| clickhouse | object | False |
|
| ClickHouse server configurations.
|
+| clickhouse.endpoint_addr | string | True |
http://127.0.0.1:8123 |
| ClickHouse endpoint. Required if
`clickhouse` is configured.
|
+| clickhouse.user | string | True | default
|
| ClickHouse username. Required if `clickhouse` is
configured.
|
+| clickhouse.password | string | True |
|
| ClickHouse password. Required if `clickhouse` is
configured. The password is encrypted with AES before being stored in etcd. See
[encrypted storage fields](../plugin-develop.md#encrypted-storage-fields). |
+| clickhouse.database | string | True |
|
| Name of the database to store the logs. Required
if `clickhouse` is configured.
|
+| clickhouse.logtable | string | True |
|
| Table name to store the logs. Required if
`clickhouse` is configured. The table should have a `data` column where the
Plugin will push logs to. |
+| kafka | object | False |
|
| Kafka server configurations.
|
+| kafka.brokers | array | True |
|
| List of Kafka broker nodes.
|
+| kafka.brokers[].host | string | True |
|
| The host of the Kafka broker.
|
+| kafka.brokers[].port | integer | True |
| [0, 65535]
| The port of the Kafka broker.
|
+| kafka.brokers[].sasl_config | object | False |
|
| The SASL configuration of the Kafka broker.
|
+| kafka.brokers[].sasl_config.mechanism | string | False | PLAIN
| ["PLAIN"]
| The mechanism of SASL configuration.
|
+| kafka.brokers[].sasl_config.user | string | True |
|
| The user of SASL configuration. Required if
`sasl_config` is present.
|
+| kafka.brokers[].sasl_config.password | string | True |
|
| The password of SASL configuration. Required if
`sasl_config` is present.
|
+| kafka.kafka_topic | string | True |
|
| Target topic to push the logs for organization.
|
+| kafka.producer_type | string | False | async
| ["async", "sync"]
| Message sending mode of the producer.
|
+| kafka.required_acks | integer | False | 1
| [-1, 0, 1]
| Number of acknowledgements the leader needs to
receive for the producer to consider the request complete. See [Apache Kafka
documentation](https://kafka.apache.org/documentation/#producerconfigs_acks)
for more. |
+| kafka.key | string | False |
|
| Key used for allocating partitions for messages.
|
+| kafka.cluster_name | integer | False | 1
| [1,...]
| Name of the cluster. Used when there are two or
more Kafka clusters. Only works if `producer_type` is set to `async`.
|
+| kafka.meta_refresh_interval | integer | False | 30
| [1,...]
| Time interval in seconds to auto-refresh the
metadata. Same as the `refresh_interval` parameter in
[lua-resty-kafka](https://github.com/doujiang24/lua-resty-kafka). |
+| timeout | integer | False | 3
| [1,...]
| Timeout in seconds for establishing the connection
and sending data.
|
+| keepalive | integer | False | 30
| [1,...]
| Time in seconds to keep the connection alive after
sending data.
|
+| level | string | False | WARN
| ["STDERR", "EMERG", "ALERT", "CRIT", "ERR", "ERROR", "WARN",
"NOTICE", "INFO", "DEBUG"] | Severity level to filter the error logs. Note that
`ERR` is the same as `ERROR`.
|
+| name | string | False |
error-log-logger |
| Unique identifier of the Plugin for
the batch processor.
|
+| batch_max_size | integer | False | 1000
| [1,...]
| Maximum number of log entries per batch. Once
reached, the batch is sent to the configured logging service. Set to `1` for
immediate processing. |
+| inactive_timeout | integer | False | 3
| [1,...]
| Maximum time in seconds to wait for new logs
before sending the batch. The value should be smaller than `buffer_duration`.
|
+| buffer_duration | integer | False | 60
| [1,...]
| Maximum time in seconds from the earliest entry
allowed before sending the batch.
|
+| retry_delay | integer | False | 1
| [0,...]
| Time interval in seconds to retry sending the
batch if the previous attempt failed.
|
+| max_retry_count | integer | False | 0
| [0,...]
| Maximum number of unsuccessful retries before
dropping the log entries.
|
+
+This Plugin supports using batch processors to aggregate and process entries
(logs/data) in a batch. This avoids the need for frequently submitting the
data. The batch processor submits data every `3` seconds or when the data in
the queue reaches `1000`. See [Batch
Processor](../batch-processor.md#configuration) for more information or setting
your custom configuration.
### Example of default log format
@@ -77,23 +92,24 @@ This Plugin supports using batch processors to aggregate
and process entries (lo
## Enable Plugin
-To enable the Plugin, you can add it in your configuration file
(`conf/config.yaml`):
+The `error-log-logger` Plugin is disabled by default. To enable the Plugin,
add it to your configuration file (`conf/config.yaml`):
```yaml title="conf/config.yaml"
plugins:
- - request-id
- - hmac-auth
- - api-breaker
+ - ...
- error-log-logger
```
-Once you have enabled the Plugin, you can configure it through the Plugin
metadata.
+Reload APISIX for the change to take effect.
+
+Once the Plugin is enabled, configure it through Plugin metadata as shown in
the examples below.
-### Configuring TCP server address
+## Examples
-You can set the TCP server address by configuring the Plugin metadata as shown
below:
+The following examples demonstrate how you can configure the
`error-log-logger` Plugin for different scenarios.
:::note
+
You can fetch the `admin_key` from `config.yaml` and save to an environment
variable with the following command:
```bash
@@ -102,80 +118,123 @@ admin_key=$(yq '.deployment.admin.admin_key[0].key'
conf/config.yaml | sed 's/"/
:::
+### Send Logs to TCP Server
+
+The following example demonstrates how to configure the `error-log-logger`
Plugin to send error logs to a TCP server.
+
+Start a TCP server listening on port `19000`:
+
```shell
-curl http://127.0.0.1:9180/apisix/admin/plugin_metadata/error-log-logger -H
"X-API-KEY: $admin_key" -X PUT -d '
-{
- "tcp": {
- "host": "127.0.0.1",
- "port": 1999
- },
- "inactive_timeout": 1
-}'
+nc -l 19000
```
-### Configuring SkyWalking OAP server address
+Configure the Plugin metadata, setting the TCP server host and port, and the
severity level to `INFO` so most logs will be sent for easier verification:
+
+```shell
+curl "http://127.0.0.1:9180/apisix/admin/plugin_metadata/error-log-logger"; -X
PUT \
+ -H "X-API-KEY: ${admin_key}" \
+ -d '{
+ "tcp": {
+ "host": "192.168.2.103",
+ "port": 19000
+ },
+ "level": "INFO"
+ }'
+```
+
+To verify, you can manually generate a log at `warn` level by reloading
APISIX. In the terminal session where netcat is listening, you should see a log
entry similar to the following:
+
+```text
+2025/01/26 20:15:29 [warn] 211#211: *35552 [lua] plugin.lua:205: load(): new
plugins: {...}, context: init_worker_by_lua*
+```
+
+### Send Logs to SkyWalking
+
+The following example demonstrates how to configure the `error-log-logger`
Plugin to send error logs to SkyWalking.
+
+Start a SkyWalking storage, OAP, and Booster UI with Docker Compose, following
[SkyWalking's
documentation](https://skywalking.apache.org/docs/main/next/en/setup/backend/backend-docker/).
Once set up, the OAP server should be listening on `12800` and you should be
able to access the UI at [http://localhost:8080](http://localhost:8080).
-You can configure the SkyWalking OAP server address as shown below:
+Configure the Plugin metadata, setting the SkyWalking endpoint address and the
severity level to `INFO` so most logs will be sent for easier verification:
```shell
-curl http://127.0.0.1:9180/apisix/admin/plugin_metadata/error-log-logger -H
"X-API-KEY: $admin_key" -X PUT -d '
-{
- "skywalking": {
- "endpoint_addr":"http://127.0.0.1:12800/v3/logs";
- },
- "inactive_timeout": 1
-}'
+curl "http://127.0.0.1:9180/apisix/admin/plugin_metadata/error-log-logger"; -X
PUT \
+ -H "X-API-KEY: ${admin_key}" \
+ -d '{
+ "skywalking": {
+ "endpoint_addr": "http://192.168.2.103:12800/v3/logs";
+ },
+ "level": "INFO"
+ }'
```
-### Configuring ClickHouse server details
+To verify, you can manually generate a log at `warn` level by reloading
APISIX. In the SkyWalking UI, navigate to **General Service** > **Services**.
You should see a service called `APISIX` with log entries.
-The Plugin sends the error log as a string to the `data` field of a table in
your ClickHouse server.
+### Send Logs to ClickHouse
-You can configure it as shown below:
+The following example demonstrates how to configure the `error-log-logger`
Plugin to send error logs to ClickHouse.
+
+Start a sample ClickHouse server with user `default` and empty password:
```shell
-curl http://127.0.0.1:9180/apisix/admin/plugin_metadata/error-log-logger -H
"X-API-KEY: $admin_key" -X PUT -d '
-{
- "clickhouse": {
- "user": "default",
- "password": "a",
- "database": "error_log",
- "logtable": "t",
- "endpoint_addr": "http://127.0.0.1:8123";
- }
-}'
+docker run -d -p 8123:8123 -p 9000:9000 -p 9009:9009 --name clickhouse-server
clickhouse/clickhouse-server
```
-### Configuring Kafka server
+In ClickHouse database `default`, create a table named `default_logs` with a
`data` column. Note that the `data` column is expected by the Plugin to push
logs to:
+
+```shell
+curl "http://127.0.0.1:8123"; -X POST -d '
+ CREATE TABLE default.default_logs (
+ data String,
+ PRIMARY KEY(`data`)
+ )
+ ENGINE = MergeTree()
+ ORDER BY (`data`)
+' --user default:
+```
-The Plugin sends the error log to Kafka, you can configure it as shown below:
+Configure the Plugin metadata with the ClickHouse server details. Set the
severity level to `INFO` so most logs will be sent for easier verification:
```shell
-curl http://127.0.0.1:9180/apisix/admin/plugin_metadata/error-log-logger \
--H "X-API-KEY: $admin_key" -X PUT -d '
-{
- "kafka":{
- "brokers":[
- {
- "host":"127.0.0.1",
- "port":9092
- }
- ],
- "kafka_topic":"test2"
- },
- "level":"ERROR",
- "inactive_timeout":1
-}'
+curl "http://127.0.0.1:9180/apisix/admin/plugin_metadata/error-log-logger"; -X
PUT \
+ -H "X-API-KEY: ${admin_key}" \
+ -d '{
+ "clickhouse": {
+ "endpoint_addr": "http://192.168.2.103:8123";,
+ "user": "default",
+ "password": "",
+ "database": "default",
+ "logtable": "default_logs"
+ },
+ "level": "INFO"
+ }'
+```
+
+To verify, you can manually generate a log at `warn` level by reloading
APISIX. Then send a request to ClickHouse to see the log entries:
+
+```shell
+echo 'SELECT * FROM default.default_logs FORMAT Pretty' | curl
"http://127.0.0.1:8123/?"; -d @-
```
-## Delete Plugin
+### Send Logs to Kafka
-To remove the Plugin, you can remove it from your configuration file
(`conf/config.yaml`):
+The following example demonstrates how to configure the `error-log-logger`
Plugin to send error logs to a Kafka server.
-```yaml title="conf/config.yaml"
-plugins:
- - request-id
- - hmac-auth
- - api-breaker
- # - error-log-logger
+Configure the Plugin metadata with the Kafka broker details:
+
+```shell
+curl "http://127.0.0.1:9180/apisix/admin/plugin_metadata/error-log-logger"; -X
PUT \
+ -H "X-API-KEY: ${admin_key}" \
+ -d '{
+ "kafka": {
+ "brokers": [
+ {
+ "host": "127.0.0.1",
+ "port": 9092
+ }
+ ],
+ "kafka_topic": "apisix-error-logs"
+ },
+ "level": "ERROR",
+ "inactive_timeout": 1
+ }'
```
diff --git a/docs/zh/latest/plugins/datadog.md
b/docs/zh/latest/plugins/datadog.md
index 7bb50d2b5..37d21dfd8 100644
--- a/docs/zh/latest/plugins/datadog.md
+++ b/docs/zh/latest/plugins/datadog.md
@@ -1,5 +1,11 @@
---
title: datadog
+keywords:
+ - Apache APISIX
+ - API 网关
+ - Plugin
+ - Datadog
+description: datadog 插件与 Datadog 集成,将指标批量发送到 DogStatsD,助力 API 监控与性能追踪。
---
<!--
@@ -21,76 +27,98 @@ title: datadog
#
-->
-## 简介
+<head>
+ <link rel="canonical" href="https://docs.api7.ai/hub/datadog"; />
+</head>
-`datadog` 是 Apache APISIX 内置的监控插件,可与
[Datadog](https://www.datadoghq.com/)(云应用最常用的监控和可观测性平台之一)无缝集成。`datadog`
插件支持对每个请求和响应周期进行多种指标参数的获取,这些指标参数基本反映了系统的行为和健康状况。
+## 描述
-`datadog` 插件通过 UDP 协议将其自定义指标推送给 DogStatsD 服务器,该服务器通过 UDP 连接与 Datadog Agent
捆绑在一起(关于如何安装 Datadog Agent,请参考[Agent](https://docs.datadoghq.com/agent/)
)。DogStatsD 基本上是 StatsD 协议的实现,它为 Apache APISIX Agent 收集自定义指标,并将其聚合成单个数据点,发送到配置的
Datadog 服务器。更多关于 DogStatsD 的信息,请参考
[DogStatsD](https://docs.datadoghq.com/developers/dogstatsd/?tab=hostagent) 。
+`datadog` 插件支持与 [Datadog](https://www.datadoghq.com/) 集成。Datadog
是云应用中最常用的可观测性服务之一。启用后,插件通过 UDP 协议将指标推送到与 [Datadog
agent](https://docs.datadoghq.com/agent/) 捆绑的
[DogStatsD](https://docs.datadoghq.com/developers/dogstatsd/?tab=hostagent) 服务器。
-`datadog` 插件具有将多个指标参数组成一个批处理统一推送给外部 Datadog Agent 的能力,并且可以重复使用同一个数据包套接字。
+该插件支持通过 UDP 将指标以批量方式推送到外部 Datadog
代理。数据可能需要一段时间才能被接收,会在[批处理器](../batch-processor.md)的定时器到期后自动发送。
-此功能可以有效解决日志数据发送不及时的问题。在创建批处理器之后,如果对 `inactive_timeout`
参数进行配置,那么批处理器会在配置好的时间内自动发送日志数据。如果不进行配置,时间默认为 5s。
+## 属性
-关于 Apache APISIX 的批处理程序的更多信息,请参考 [Batch-Processor](../batch-processor.md#配置)
+| 名称 | 类型 | 必选项 | 默认值 | 有效值 | 描述
|
+| ---------------- | ------- | ------ | ------- | -------------- |
--------------------------------------------------------------------------------------------------
|
+| prefer_name | boolean | 否 | true | [true, false] | 如果为
`true`,在指标标签中导出路由/服务名称而非 ID。 |
+| include_path | boolean | 否 | false | [true, false] | 如果为
`true`,在指标标签中包含路径模式。 |
+| include_method | boolean | 否 | false | [true, false] | 如果为
`true`,在指标标签中包含 HTTP 方法。
|
+| constant_tags | array | 否 | [] | |
附加到该路由所有指标的静态键值标签,便于按信号对指标进行分组。 |
+| batch_max_size | integer | 否 | 1000 | [1,...] |
每个批次允许的最大指标条目数。达到后立即发送至 Datadog agent。设置为 `1` 表示立即处理。 |
+| inactive_timeout | integer | 否 | 5 | [1,...] |
等待新条目的最长时间(秒),超过则发送批次。该值应小于 `buffer_duration`。 |
+| buffer_duration | integer | 否 | 60 | [1,...] |
从最早条目起允许的最长缓冲时间(秒),超过则发送批次。 |
+| retry_delay | integer | 否 | 1 | [0,...] |
批次发送失败后重试的时间间隔,单位为秒。 |
+| max_retry_count | integer | 否 | 0 | [0,...] |
丢弃条目前允许的最大重试次数。
|
-## APISIX-Datadog plugin 工作原理
+本插件支持使用批处理器来聚合并批量处理条目(日志/数据),避免频繁提交数据。默认情况下,批处理器每 `5` 秒或队列中数据达到 `1000`
条时提交一次。详情及自定义配置请参考[批处理器](../batch-processor.md#配置)。
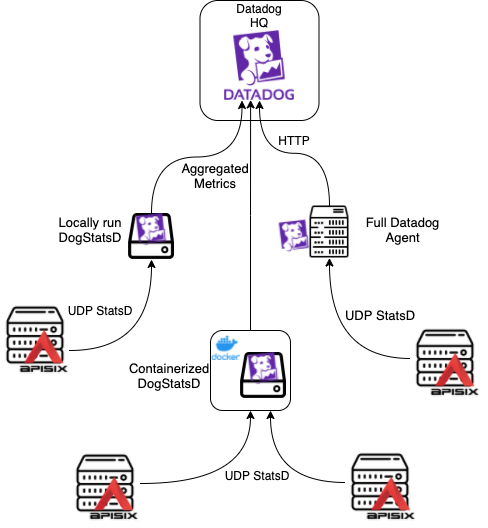
-
+## 插件元数据
-APISIX-Datadog 插件将其自定义指标推送到 DogStatsD server。而 DogStatsD server 通过 UDP 连接与
Datadog agent 捆绑在一起。DogStatsD 是 StatsD 协议的一个实现。它为 Apache APISIX agent
收集自定义指标,将其聚合成一个数据点,并将其发送到配置的 Datadog server。要了解更多关于 DogStatsD 的信息,请访问 DogStatsD
文档。
+可通过插件元数据配置该插件。
-当你启用 APISIX-Datadog 插件时,Apache APISIX agent 会在每个请求响应周期向 DogStatsD server
输出以下指标:
+| 名称 | 类型 | 必选项 | 默认值 | 描述
|
+| ------------- | ------- | ------ | ------------------- |
--------------------------------------------------------------------------------------------------------------------------------------
|
+| host | string | 否 | "127.0.0.1" | DogStatsD 服务器主机地址。
|
+| port | integer | 否 | 8125 | DogStatsD 服务器端口。
|
+| namespace | string | 否 | "apisix" | APISIX agent
发送的所有自定义指标的前缀。有助于在指标图中定位实体,例如 `apisix.request.counter`。
|
+| constant_tags | array | 否 | [ "source:apisix" ] |
嵌入到生成指标中的静态标签,便于按信号对指标进行分组。详见[标签定义](https://docs.datadoghq.com/getting_started/tagging/#defining-tags)。
|
-| 参数名称 | StatsD 类型 | 描述
|
+## 指标
+
+插件默认导出以下指标。
+
+所有指标均以元数据中配置的 `namespace` 为前缀。例如,若 `namespace` 设置为 `apisix`,则
`request.counter` 指标在 Datadog 中会导出为 `apisix.request.counter`。
+
+| 名称 | StatsD 类型 | 描述
|
| ---------------- | ----------- |
---------------------------------------------------------- |
-| Request Counter | Counter | 收到的请求数量。
|
-| Request Latency | Histogram | 处理该请求所需的时间,以毫秒为单位。 |
-| Upstream latency | Histogram | 上游 server agent 请求到收到响应所需的时间,以毫秒为单位。 |
-| APISIX Latency | Histogram | APISIX agent 处理该请求的时间,以毫秒为单位。 |
-| Ingress Size | Timer | 请求体大小,以字节为单位。
|
-| Egress Size | Timer | 响应体大小,以字节为单位。
|
+| request.counter | Counter | 收到的请求数量。
|
+| request.latency | Histogram | 处理请求所需时间,单位为毫秒。
|
+| upstream.latency | Histogram | 代理请求到上游服务器并收到响应所需时间,单位为毫秒。 |
+| apisix.latency | Histogram | APISIX agent 处理请求所需时间,单位为毫秒。
|
+| ingress.size | Timer | 请求体大小,单位为字节。
|
+| egress.size | Timer | 响应体大小,单位为字节。
|
-这些指标将被发送到 DogStatsD agent,并带有以下标签。如果任何特定的标签没有合适的值,该标签将被直接省略。
+## 标签
-| 参数名称 | 描述 |
-| --------------- |
------------------------------------------------------------ |
-| route_name | 路由的名称,如果不存在,将显示路由 ID。 |
-| service_id | 如果一个路由是用服务的抽象概念创建的,那么特定的服务 ID 将被使用。 |
-| consumer | 如果路由有一个链接的消费者,消费者的用户名将被添加为一个标签。 |
-| balancer_ip | 处理了当前请求的上游复制均衡器的的 IP。 |
-| response_status | HTTP 响应状态代码。 |
-| scheme | 已用于提出请求的协议,如 HTTP、gRPC、gRPCs 等。 |
+插件在导出指标时附带以下[标签](https://docs.datadoghq.com/getting_started/tagging)。如果某个标签没有合适的值,该标签将被省略。
-APISIX-Datadog 插件维护了一个带有 timer 的 buffer。当 timer 失效时,APISIX-Datadog 插件会将 buffer
的指标作为一个批量处理程序传送给本地运行的 DogStatsD server。这种方法通过重复使用相同的 UDP 套接字,对资源的占用较少,而且由于可以配置
timer,所以不会一直让网络过载。
+| 名称 | 描述
|
+| --------------------- |
--------------------------------------------------------------------------------------------------------------
|
+| route_name | 路由名称。如果不存在或 `prefer_name` 为 false,则回退到路由 ID。
|
+| service_name | 服务名称。如果不存在或 `prefer_name` 为 false,则回退到服务 ID。
|
+| consumer | 若路由关联了消费者,则为消费者的用户名。
|
+| balancer_ip | 处理当前请求的上游负载均衡器 IP 地址。
|
+| response_status | HTTP 响应状态码,例如 `201`、`404` 或 `503`。
|
+| response_status_class | HTTP 响应状态码类别,例如 `2xx`、`4xx` 或 `5xx`。APISIX 3.14.0
及以上版本支持。 |
+| scheme | 请求协议,例如 HTTP 和 gRPC。
|
+| path | HTTP 路径模式。仅当 `include_path` 为 `true` 时可用。APISIX
3.14.0 及以上版本支持。 |
+| method | HTTP 方法。仅当 `include_method` 为 `true` 时可用。APISIX
3.14.0 及以上版本支持。 |
-## 如何使用插件
+## 使用示例
-### 前提:Datadog Agent
+以下示例演示了 `datadog` 插件在不同场景下的配置方式。
-1. 首先你必须在系统中安装一个 Datadog agent。它可以是一个 docker 容器,一个 pod 或是一个二进制的包管理器。你只需要确保
Apache APISIX agent 可以到达 Datadog agent 的 8125 端口。
-2. 如果你从没使用过 Datadog
- 1. 首先访问 [www.datadoghq.com](http://www.datadoghq.com/) ,创建一个账户。
- 2. 然后按照下图标注的步骤生成 API 密钥。 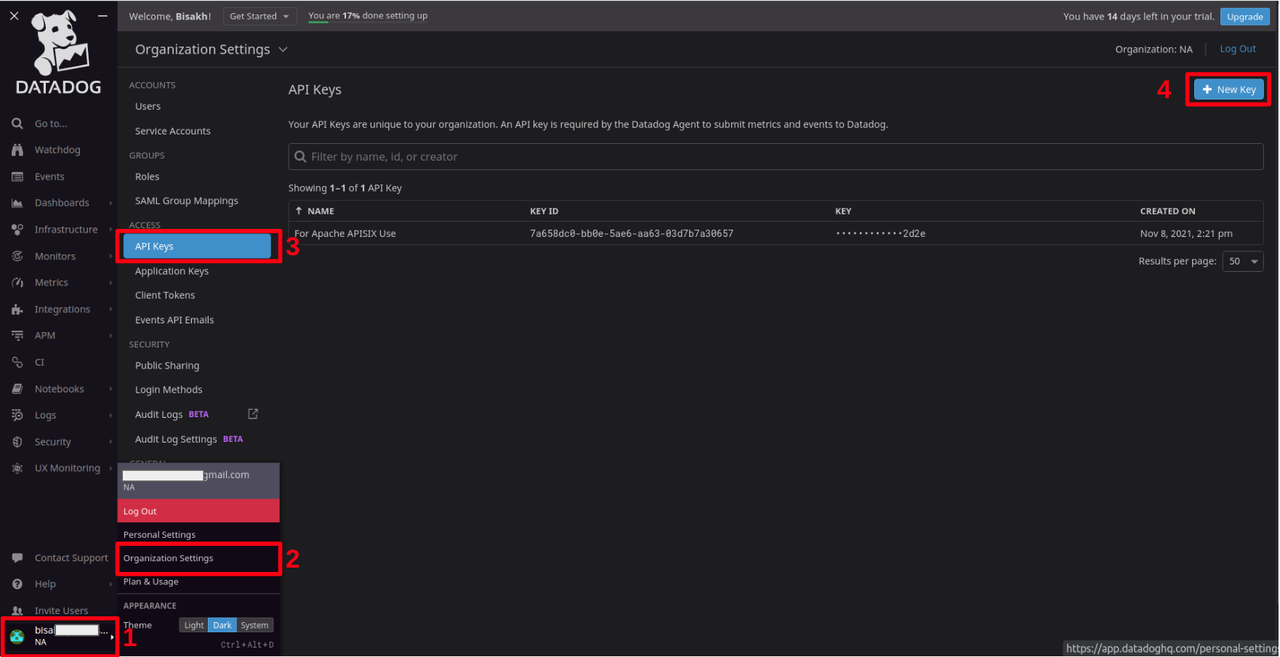
-3. APISIX-Datadog 插件只需要依赖 `datadog/agent` 的 dogstatsd 组件即可实现,因为该插件按照 statsd
协议通过标准的 UDP 套接字向 DogStatsD server 异步发送参数。我们推荐使用独立的 `datadog/dogstatsd`
镜像,而不是使用完整的`datadog/agent` ,因为 `datadog/dogstatsd` 的组件大小只有大约 11 MB,更加轻量化。而完整的
`datadog/agent` 镜像的大小为 2.8 GB。
+开始前,请确保已安装 [Datadog
agent](https://docs.datadoghq.com/agent/),它负责收集受监控对象的事件和指标并发送到 Datadog。
-运行以下命令,将它作为一个容器来运行:
+使用你的 API 密钥、Datadog 站点和主机名启动 Datadog agent。将 `DD_DOGSTATSD_NON_LOCAL_TRAFFIC`
设为 `true` 以接收来自其他容器的 DogStatsD 数据包:
```shell
-# pull the latest image
-docker pull datadog/dogstatsd:latest
-# run a detached container
-docker run -d --name dogstatsd-agent -e DD_API_KEY=<Your API Key from step 2>
-p 8125:8125/udp datadog/dogstatsd
+docker run -d \
+ --name dogstatsd-agent \
+ -e DD_API_KEY=<your-api-key> \
+ -e DD_SITE="us5.datadoghq.com" \
+ -e DD_HOSTNAME=apisix.quickstart \
+ -e DD_DOGSTATSD_NON_LOCAL_TRAFFIC=true \
+ -p 8125:8125/udp \
+ datadog/dogstatsd:latest
```
-如果你在生产环境中使用 Kubernetes,你可以将 `dogstatsd` 作为一个 `Daemonset` 或 `Multi-Container
Pod` 与 Apache APISIX agent 一起部署。
-
-### 启用插件
-
-本小节介绍了如何在指定路由上启用 `datadog` 插件。进行以下操作之前请确认您的 Datadog Agent 已经启动并正常运行。
+你可以通过 `DD_` 前缀的环境变量配置 agent 的主配置文件 `datadog.yaml` 中的大多数选项。更多信息请参阅 [agent
环境变量](https://docs.datadoghq.com/agent/guide/environment-variables)。
:::note
-您可以这样从 `config.yaml` 中获取 `admin_key` 并存入环境变量:
+你可以这样从 `config.yaml` 中获取 `admin_key` 并存入环境变量:
```bash
admin_key=$(yq '.deployment.admin.admin_key[0].key' conf/config.yaml | sed
's/"//g')
@@ -98,113 +126,63 @@ admin_key=$(yq '.deployment.admin.admin_key[0].key'
conf/config.yaml | sed 's/"/
:::
-```shell
-curl http://127.0.0.1:9180/apisix/admin/routes/1 -H "X-API-KEY: $admin_key" -X
PUT -d '
-{
- "plugins": {
- "datadog": {}
- },
- "upstream": {
- "type": "roundrobin",
- "nodes": {
- "127.0.0.1:1980": 1
- }
- },
- "uri": "/hello"
-}'
-```
+### 更新 Datadog Agent 地址及元数据
-现在,任何对 uri `/hello` 的请求都会生成上述指标,并推送到 Datadog Agent 的 DogStatsD 服务器。
+默认情况下,插件期望 DogStatsD 服务器在 `127.0.0.1:8125` 可用。如需自定义地址及其他元数据,请更新插件元数据。将主机设置为你的
Datadog agent 地址,端口设置为 agent 监听端口,命名空间用于前缀所有指标,并可添加常量标签:
-### 删除插件
+```shell
+curl "http://127.0.0.1:9180/apisix/admin/plugin_metadata/datadog"; -X PUT \
+ -H "X-API-KEY: ${admin_key}" \
+ -d '{
+ "host": "192.168.0.90",
+ "port": 8125,
+ "namespace": "apisix",
+ "constant_tags": [
+ "source:apisix",
+ "service:custom"
+ ]
+ }'
+```
-删除插件配置中相应的 JSON 配置以禁用 `datadog`。
-APISIX 插件是支持热加载的,所以不用重新启动 APISIX,配置就能生效。
+如需恢复默认配置,发送空 body 的请求到 `datadog` 插件元数据接口:
```shell
-curl http://127.0.0.1:9180/apisix/admin/routes/1 -H "X-API-KEY: $admin_key" -X
PUT -d '
-{
- "methods": ["GET"],
- "uri": "/hello",
- "plugins": {},
- "upstream": {
- "type": "roundrobin",
- "nodes": {
- "127.0.0.1:1980": 1
- }
- }
-}'
+curl "http://127.0.0.1:9180/apisix/admin/plugin_metadata/datadog"; -X PUT \
+ -H "X-API-KEY: ${admin_key}" \
+ -d '{}'
```
-### 补充:自定义配置
+### 监控路由指标
-在默认配置中,`datadog` 插件希望 Dogstatsd 服务在 `127.0.0.1:8125`
可用。如果你想更新配置,请更新插件的元数据。如果想要了解更多关于 `datadog` 插件元数据的字段,请参阅[元数据](#元数据)。
+以下示例演示如何将特定路由的指标发送到 Datadog。
-向 `/apisix/admin/plugin_metadata/datadog` 发起请求,更改其元数据。操作示例如下:
+创建一个启用 `datadog` 插件的路由。将 `batch_max_size` 设为 `1` 以立即发送每条指标,将 `max_retry_count`
设为 `0` 以禁止失败重试:
```shell
-curl http://127.0.0.1:9180/apisix/admin/plugin_metadata/datadog -H "X-API-KEY:
$admin_key" -X PUT -d '
-{
- "host": "172.168.45.29",
- "port": 8126,
- "constant_tags": [
- "source:apisix",
- "service:custom"
- ],
- "namespace": "apisix"
-}'
+curl "http://127.0.0.1:9180/apisix/admin/routes"; -X PUT \
+ -H "X-API-KEY: ${admin_key}" \
+ -d '{
+ "id": "datadog-route",
+ "uri": "/anything",
+ "plugins": {
+ "datadog": {
+ "batch_max_size": 1,
+ "max_retry_count": 0
+ }
+ },
+ "upstream": {
+ "type": "roundrobin",
+ "nodes": {
+ "httpbin.org:80": 1
+ }
+ }
+ }'
```
-上述命令将会更新元数据,后续各指标将通过 UDP StatsD 推送到 `172.168.45.29:8126`
上对应的服务,并且配置将被热加载,不需要重新启动 APISIX 实例,就可以使配置生效。
-
-如果你想把 `datadog` 插件的元数据 schema 恢复到默认值,只需向同一个服务地址再发出一个 Body 为空的 PUT 请求。示例如下:
+向路由发送几条请求:
```shell
-curl http://127.0.0.1:9180/apisix/admin/plugin_metadata/datadog \
--H "X-API-KEY: $admin_key" -X PUT -d '{}'
+curl "http://127.0.0.1:9080/anything";
```
-## 配置属性
-
-### 属性
-
-| 名称 | 类型 | 必选项 | 默认值 | 有效值 | 描述
|
-| ----------- | ------ | ----------- | ------- | ----- |
------------------------------------------------------------
|
-| prefer_name | boolean | optional | true | true/false |
如果设置为 `false`,将使用路由/服务的 id 值作为插件的 `route_name`,而不是带有参数的标签名称。 |
-
-该插件支持使用批处理程序来聚集和处理条目(日志/数据)的批次。这就避免了插件频繁地提交数据,默认情况下,批处理程序每 `5` 秒或当队列中的数据达到
`1000` 时提交数据。有关信息或自定义批处理程序的参数设置,请参阅[批处理程序](../batch-processor.md#configuration)
配置部分。
-
-### 元数据
-
-| 名称 | 类型 | 必选项 | 默认值 | 描述
|
-| ----------- | ------ | ----------- | ------- |
---------------------------------------------------------------------- |
-| host | string | optional | "127.0.0.1" | DogStatsD
服务器的主机地址 |
-| port | integer | optional | 8125 | DogStatsD
服务器的主机端口 |
-| namespace | string | optional | "apisix" | 由 APISIX
代理发送的所有自定义参数的前缀。对寻找指标图的实体很有帮助,例如:apisix.request.counter。
|
-| constant_tags | array | optional | [ "source:apisix" ] |
静态标签嵌入到生成的指标中。这对某些信号的度量进行分组很有用。 |
-
-要了解更多关于如何有效地编写标签,请访问[这里](https://docs.datadoghq.com/getting_started/tagging/#defining-tags)
-
-### 输出指标
-
-启用 datadog 插件之后,APISIX 就会按照下面的指标格式,将数据整理成数据包最终发送到 DogStatsD server。
-
-| Metric Name | StatsD Type | Description |
-| ----------- | ----------- | ------- |
-| Request Counter | Counter | 收到的请求数量。 |
-| Request Latency | Histogram | 处理该请求所需的时间(以毫秒为单位)。 |
-| Upstream latency | Histogram | 代理请求到上游服务器直到收到响应所需的时间(以毫秒为单位)。 |
-| APISIX Latency | Histogram | APISIX 代理处理该请求的时间(以毫秒为单位)。|
-| Ingress Size | Timer | 以字节为单位的请求体大小。 |
-| Egress Size | Timer | 以字节为单位的响应体大小。 |
-
-这些指标会带有以下标签,并首先被发送到本地 DogStatsD Agent。
-
-> 如果一个标签没有合适的值,该标签将被直接省略。
-
-- **route_name**:在路由模式定义中指定的名称,如果不存在或插件属性 `prefer_name` 被设置为
`false`,它将默认使用路由/服务的 id 值。
-- **service_name**:如果一个路由是用服务的抽象概念创建的,特定的服务 name/id(基于插件的 `prefer_name`
属性)将被使用。
-- **consumer**:如果路由有一个正在链接中的消费者,那么消费者的用户名将被添加为一个标签。
-- **balancer_ip**:处理当前请求的上游负载均衡器的 IP。
-- **response_status**:HTTP 响应状态代码。
-- **scheme**:已用于提出请求的协议,如 HTTP、gRPC、gRPCs 等。
+在 Datadog 中,从左侧菜单选择**指标**,进入**资源管理器**,选择 `apisix.ingress.size.count`
指标,可以看到计数反映了已生成的请求数量。
diff --git a/docs/zh/latest/plugins/elasticsearch-logger.md
b/docs/zh/latest/plugins/elasticsearch-logger.md
index 01db48059..5ff61d8f1 100644
--- a/docs/zh/latest/plugins/elasticsearch-logger.md
+++ b/docs/zh/latest/plugins/elasticsearch-logger.md
@@ -126,7 +126,7 @@ curl "http://127.0.0.1:9180/apisix/admin/routes"; -X PUT \
"elasticsearch-logger": {
"endpoint_addrs": ["http://elasticsearch:9200";],
"field": {
- "index": "gateway"
+ "index": "gateway",
}
}
},
@@ -289,7 +289,7 @@ curl "http://127.0.0.1:9180/apisix/admin/routes"; -X PUT \
"elasticsearch-logger": {
"endpoint_addrs": ["http://elasticsearch:9200";],
"field": {
- "index": "gateway"
+ "index": "gateway",
},
"include_req_body": true,
"include_req_body_expr": [["arg_log_body", "==", "yes"]]
diff --git a/docs/zh/latest/plugins/error-log-logger.md
b/docs/zh/latest/plugins/error-log-logger.md
index 3aaec65c6..f6411855d 100644
--- a/docs/zh/latest/plugins/error-log-logger.md
+++ b/docs/zh/latest/plugins/error-log-logger.md
@@ -5,7 +5,7 @@ keywords:
- API 网关
- 错误日志
- Plugin
-description: API 网关 Apache APISIX error-log-logger 插件用于将 APISIX 的错误日志推送到
TCP、Apache SkyWalking、Apache Kafka 或 ClickHouse 服务器。
+description: error-log-logger 插件将 APISIX 的错误日志批量推送到 TCP、Apache
SkyWalking、Apache Kafka 或 ClickHouse 服务器,并支持指定日志级别进行过滤。
---
<!--
@@ -27,46 +27,62 @@ description: API 网关 Apache APISIX error-log-logger 插件用于将
APISIX
#
-->
+<head>
+ <link rel="canonical" href="https://docs.api7.ai/hub/error-log-logger"; />
+</head>
+
## 描述
-`error-log-logger` 插件用于将 APISIX 的错误日志 (`error.log`) 推送到 TCP、Apache
SkyWalking、Apache Kafka 或 ClickHouse 服务器,你还可以设置错误日志级别以将日志发送到服务器。
-
-## 属性
-
-| 名称 | 类型 | 必选项 | 默认值
| 有效值 | 描述
|
-| -------------------------------- | ------- | ------ |
------------------------------ | ------------- |
--------------------------------------------------------------------------------
|
-| tcp.host | string | 是 |
| | TCP 服务的 IP 地址或主机名。
|
-| tcp.port | integer | 是 |
| [0,...] | 目标端口。
|
-| tcp.tls | boolean | 否 | false
| [false, true] | 当设置为 `true` 时执行 SSL 验证。
|
-| tcp.tls_server_name | string | 否 |
| | TLS 服务名称标记。
|
-| skywalking.endpoint_addr | string | 否 |
http://127.0.0.1:12900/v3/logs | | SkyWalking 的 HTTP endpoint
地址,例如:http://127.0.0.1:12800。 |
-| skywalking.service_name | string | 否 | APISIX
| | SkyWalking 上报的 service 名称。
|
-| skywalking.service_instance_name | String | 否 | APISIX Instance Name
| | SkyWalking 上报的 service 实例名,如果希望直接获取本机主机名请设置为
`$hostname`。 |
-| clickhouse.endpoint_addr | String | 否 | http://127.0.0.1:8213
| | ClickHouse 的 HTTP endpoint 地址,例如
`http://127.0.0.1:8213`。 |
-| clickhouse.user | String | 否 | default
| | ClickHouse 的用户名。
|
-| clickhouse.password | String | 否 |
| | ClickHouse 的密码。
|
-| clickhouse.database | String | 否 |
| | ClickHouse 的用于接收日志的数据库。
|
-| clickhouse.logtable | String | 否 |
| | ClickHouse 的用于接收日志的表。
|
-| kafka.brokers | array | 是 |
| | 需要推送的 Kafka broker 列表。 |
-| kafka.brokers.host | string | 是 | |
| Kafka broker 的节点 host 配置,例如 `192.168.1.1`|
-| kafka.brokers.port | string | 是 | |
| Kafka broker 的节点端口配置 |
-| kafka.brokers.sasl_config | object | 否 | |
| Kafka broker 中的 sasl_config |
-| kafka.brokers.sasl_config.mechanism | string | 否 | "PLAIN" |
["PLAIN"] | Kafka broker 中的 sasl 认证机制 |
-| kafka.brokers.sasl_config.user | string | 是 | |
| Kafka broker 中 sasl 配置中的 user,如果 sasl_config 存在,则必须填写 |
-| kafka.brokers.sasl_config.password | string | 是 | |
| Kafka broker 中 sasl 配置中的 password,如果 sasl_config 存在,则必须填写 |
-| kafka.kafka_topic | string | 是 | |
| 需要推送的 Kafka topic。|
-| kafka.producer_type | string | 否 | async |
["async", "sync"] | 生产者发送消息的模式。|
-| kafka.required_acks | integer | 否 | 1 | [0,
1, -1] | 生产者在确认一个请求发送完成之前需要收到的反馈信息的数量。该参数是为了保证发送请求的可靠性。该属性的配置与 Kafka
`acks` 属性相同,具体配置请参考 [Apache Kafka
文档](https://kafka.apache.org/documentation/#producerconfigs_acks)。 |
-| kafka.key | string | 否 | |
| 用于消息分区而分配的密钥。 |
-| kafka.cluster_name | integer | 否 | 1 | [0,...]
| Kafka 集群的名称,当有两个及以上 Kafka 集群时使用。只有当 `producer_type` 设为 `async`
模式时才可以使用该属性。|
-| kafka.meta_refresh_interval | integer | 否 | 30 | [1,...] | 对应
[lua-resty-kafka](https://github.com/doujiang24/lua-resty-kafka) 中的
`refresh_interval` 参数,用于指定自动刷新 metadata 的间隔时长,单位为秒。 |
-| timeout | integer | 否 | 3
| [1,...] | 连接和发送数据超时间,以秒为单位。
|
-| keepalive | integer | 否 | 30
| [1,...] | 复用连接时,连接保持的时间,以秒为单位。
|
-| level | string | 否 | WARN
| | 进行错误日志筛选的级别,默认为 `WARN`,取值 ["STDERR", "EMERG", "ALERT",
"CRIT", "ERR", "ERROR", "WARN", "NOTICE", "INFO", "DEBUG"],其中 `ERR` 与 `ERROR`
级别一致。 |
-
-注意:schema 中还定义了 `encrypt_fields = {"clickhouse.password"}`,这意味着该字段将会被加密存储在
etcd 中。具体参考 [加密存储字段](../plugin-develop.md#加密存储字段)。
-
-本插件支持使用批处理器来聚合并批量处理条目(日志/数据)。这样可以避免插件频繁地提交数据,默认设置情况下批处理器会每 `5` 秒钟或队列中的数据达到
`1000` 条时提交数据,如需了解或自定义批处理器相关参数设置,请参考
[Batch-Processor](../batch-processor.md#配置) 配置部分。
+`error-log-logger` 插件将 APISIX 的错误日志(`error.log`)批量推送到 TCP、[Apache
SkyWalking](https://skywalking.apache.org/)、Apache Kafka 或 ClickHouse
服务器。你可以指定日志严重级别,插件只发送符合条件的日志。
+
+该插件默认为禁用状态。启用后,插件会自动开始将错误日志推送到远端服务器。你只需在插件元数据中配置远端服务器的详细信息,无需在路由等其他资源上进行配置。
+
+## 插件元数据
+
+该插件没有路由或服务级别的属性,所有配置均通过插件元数据完成。
+
+| 名称 | 类型 | 必选项 | 默认值
| 有效值
| 描述
|
+| --------------------------------------- | ------- | ------ |
------------------------------ |
---------------------------------------------------------------------------------------
|
--------------------------------------------------------------------------------------------------------------------------------------------------------------
|
+| tcp | object | 否 |
|
| TCP 服务器配置。
|
+| tcp.host | string | 是 |
|
| TCP 服务器的 IP 地址或主机名。
|
+| tcp.port | integer | 是 |
| [0,...]
| 目标端口。
|
+| tcp.tls | boolean | 否 | false
|
| 设置为 `true` 时启用 SSL 验证。
|
+| tcp.tls_server_name | string | 否 |
|
| TLS 服务名称标记(SNI)。
|
+| skywalking | object | 否 |
|
| SkyWalking 服务器配置。
|
+| skywalking.endpoint_addr | string | 否 |
http://127.0.0.1:12900/v3/logs |
| SkyWalking 服务器的地址。
|
+| skywalking.service_name | string | 否 | APISIX
|
| SkyWalking 上报的服务名称。
|
+| skywalking.service_instance_name | string | 否 | APISIX Service
Instance |
| SkyWalking 上报的服务实例名称。设置为 `$hostname` 可直接获取本机主机名。
|
+| clickhouse | object | 否 |
|
| ClickHouse 服务器配置。
|
+| clickhouse.endpoint_addr | string | 是 |
http://127.0.0.1:8123 |
| ClickHouse 的 HTTP endpoint 地址。当
`clickhouse` 存在时为必填。
|
+| clickhouse.user | string | 是 | default
|
| ClickHouse 用户名。当 `clickhouse` 存在时为必填。
|
+| clickhouse.password | string | 是 |
|
| ClickHouse 密码。当 `clickhouse` 存在时为必填。密码在存入 etcd 前会经过
AES 加密。详见[加密存储字段](../plugin-develop.md#加密存储字段)。 |
+| clickhouse.database | string | 是 |
|
| 用于存储日志的数据库名称。当 `clickhouse` 存在时为必填。
|
+| clickhouse.logtable | string | 是 |
|
| 用于存储日志的表名称。当 `clickhouse` 存在时为必填。该表需包含 `data`
列,插件将日志推送至该列。 |
+| kafka | object | 否 |
|
| Kafka 服务器配置。
|
+| kafka.brokers | array | 是 |
|
| Kafka broker 节点列表。
|
+| kafka.brokers[].host | string | 是 |
|
| Kafka broker 的主机地址。
|
+| kafka.brokers[].port | integer | 是 |
| [0, 65535]
| Kafka broker 的端口号。
|
+| kafka.brokers[].sasl_config | object | 否 |
|
| Kafka broker 的 SASL 配置。
|
+| kafka.brokers[].sasl_config.mechanism | string | 否 | PLAIN
| ["PLAIN"]
| SASL 认证机制。
|
+| kafka.brokers[].sasl_config.user | string | 是 |
|
| SASL 配置的用户名。当 `sasl_config` 存在时为必填。
|
+| kafka.brokers[].sasl_config.password | string | 是 |
|
| SASL 配置的密码。当 `sasl_config` 存在时为必填。
|
+| kafka.kafka_topic | string | 是 |
|
| 推送日志的目标 topic。
|
+| kafka.producer_type | string | 否 | async
| ["async", "sync"]
| 生产者发送消息的模式。
|
+| kafka.required_acks | integer | 否 | 1
| [-1, 0, 1]
| 生产者确认请求完成所需的 ack 数量。详见 [Apache Kafka
文档](https://kafka.apache.org/documentation/#producerconfigs_acks)。
|
+| kafka.key | string | 否 |
|
| 用于消息分区的键。
|
+| kafka.cluster_name | integer | 否 | 1
| [1,...]
| 集群名称,当存在两个及以上 Kafka 集群时使用。仅在 `producer_type` 为
`async` 时有效。
|
+| kafka.meta_refresh_interval | integer | 否 | 30
| [1,...]
| 自动刷新 metadata 的时间间隔,单位为秒。对应
[lua-resty-kafka](https://github.com/doujiang24/lua-resty-kafka) 中的
`refresh_interval` 参数。 |
+| timeout | integer | 否 | 3
| [1,...]
| 连接和发送数据的超时时间,单位为秒。
|
+| keepalive | integer | 否 | 30
| [1,...]
| 发送数据后保持连接的时间,单位为秒。
|
+| level | string | 否 | WARN
| ["STDERR", "EMERG", "ALERT", "CRIT", "ERR", "ERROR", "WARN",
"NOTICE", "INFO", "DEBUG"] | 过滤错误日志的严重级别。`ERR` 与 `ERROR` 级别一致。
|
+| name | string | 否 | error-log-logger
|
| 批处理器中插件的唯一标识符。
|
+| batch_max_size | integer | 否 | 1000
| [1,...]
| 每个批次允许的最大日志条目数。达到后立即发送批次。设置为 `1` 表示立即处理。
|
+| inactive_timeout | integer | 否 | 3
| [1,...]
| 等待新日志的最长时间(秒),超过则发送批次。该值应小于 `buffer_duration`。
|
+| buffer_duration | integer | 否 | 60
| [1,...]
| 从最早条目起允许的最长缓冲时间(秒),超过则发送批次。
|
+| retry_delay | integer | 否 | 1
| [0,...]
| 批次发送失败后重试的时间间隔,单位为秒。
|
+| max_retry_count | integer | 否 | 0
| [0,...]
| 丢弃日志条目前允许的最大重试次数。
|
+
+本插件支持使用批处理器来聚合并批量处理条目(日志/数据),避免频繁提交数据。默认情况下,批处理器每 `3` 秒或队列中数据达到 `1000`
条时提交一次。详情及自定义配置请参考[批处理器](../batch-processor.md#配置)。
### 默认日志格式示例
@@ -76,32 +92,25 @@ description: API 网关 Apache APISIX error-log-logger 插件用于将
APISIX
## 启用插件
-该插件默认为禁用状态,你可以在 `./conf/config.yaml` 中启用 `error-log-logger` 插件。你可以参考如下示例启用插件:
+`error-log-logger` 插件默认为禁用状态。如需启用,请在配置文件(`conf/config.yaml`)中添加该插件:
-```yaml title="./conf/config.yaml"
-plugins: # plugin list
- ......
- - request-id
- - hmac-auth
- - api-breaker
- - error-log-logger # enable plugin `error-log-logger
+```yaml title="conf/config.yaml"
+plugins:
+ - ...
+ - error-log-logger
```
-完成插件配置后,你需要重新加载 APISIX,插件才会生效。
-
-:::note 注意
+重新加载 APISIX 使更改生效。
-该插件属于 APISIX 全局性插件,不需要在任何路由或服务中绑定。
-
-:::
+启用插件后,通过插件元数据进行配置,示例见下文。
-### 配置 TCP 服务器地址
+## 使用示例
-你可以通过配置插件元数据来设置 TCP 服务器地址,如下所示:
+以下示例演示了 `error-log-logger` 插件在不同场景下的配置方式。
:::note
-您可以这样从 `config.yaml` 中获取 `admin_key` 并存入环境变量:
+你可以这样从 `config.yaml` 中获取 `admin_key` 并存入环境变量:
```bash
admin_key=$(yq '.deployment.admin.admin_key[0].key' conf/config.yaml | sed
's/"//g')
@@ -109,84 +118,123 @@ admin_key=$(yq '.deployment.admin.admin_key[0].key'
conf/config.yaml | sed 's/"/
:::
+### 发送日志到 TCP 服务器
+
+以下示例演示如何配置 `error-log-logger` 插件将错误日志发送到 TCP 服务器。
+
+启动一个监听 `19000` 端口的 TCP 服务器:
+
+```shell
+nc -l 19000
+```
+
+配置插件元数据,设置 TCP 服务器的主机和端口,并将日志级别设为 `INFO` 以便发送更多日志进行验证:
+
```shell
-curl http://127.0.0.1:9180/apisix/admin/plugin_metadata/error-log-logger \
--H "X-API-KEY: $admin_key" -X PUT -d '
-{
- "tcp": {
- "host": "127.0.0.1",
- "port": 1999
- },
- "inactive_timeout": 1
-}'
+curl "http://127.0.0.1:9180/apisix/admin/plugin_metadata/error-log-logger"; -X
PUT \
+ -H "X-API-KEY: ${admin_key}" \
+ -d '{
+ "tcp": {
+ "host": "192.168.2.103",
+ "port": 19000
+ },
+ "level": "INFO"
+ }'
+```
+
+如需验证,可以通过重新加载 APISIX 手动生成一条 `warn` 级别的日志。在 netcat 监听的终端中,你应该看到类似以下的日志条目:
+
+```text
+2025/01/26 20:15:29 [warn] 211#211: *35552 [lua] plugin.lua:205: load(): new
plugins: {...}, context: init_worker_by_lua*
```
-### 配置 SkyWalking OAP 服务器地址
+### 发送日志到 SkyWalking
+
+以下示例演示如何配置 `error-log-logger` 插件将错误日志发送到 SkyWalking。
-通过以下配置插件元数据设置 SkyWalking OAP 服务器地址,如下所示:
+参照 [SkyWalking
文档](https://skywalking.apache.org/docs/main/next/en/setup/backend/backend-docker/)
使用 Docker Compose 启动 SkyWalking 存储、OAP 和 Booster UI。完成后,OAP 服务器应在 `12800`
端口监听,你可以通过 [http://localhost:8080](http://localhost:8080) 访问 UI。
+
+配置插件元数据,设置 SkyWalking endpoint 地址,并将日志级别设为 `INFO` 以便发送更多日志进行验证:
```shell
-curl http://127.0.0.1:9180/apisix/admin/plugin_metadata/error-log-logger \
--H "X-API-KEY: $admin_key" -X PUT -d '
-{
- "skywalking": {
- "endpoint_addr": "http://127.0.0.1:12800/v3/logs";
- },
- "inactive_timeout": 1
-}'
+curl "http://127.0.0.1:9180/apisix/admin/plugin_metadata/error-log-logger"; -X
PUT \
+ -H "X-API-KEY: ${admin_key}" \
+ -d '{
+ "skywalking": {
+ "endpoint_addr": "http://192.168.2.103:12800/v3/logs";
+ },
+ "level": "INFO"
+ }'
```
-### 配置 ClickHouse 数据库
+如需验证,可以通过重新加载 APISIX 手动生成一条 `warn` 级别的日志。在 SkyWalking UI 中,导航至**General
Service** > **Services**,应看到名为 `APISIX` 的服务及其日志条目。
+
+### 发送日志到 ClickHouse
-该插件支持将错误日志作为字符串发送到 ClickHouse 服务器中对应表的 `data` 字段。
+以下示例演示如何配置 `error-log-logger` 插件将错误日志发送到 ClickHouse。
-你可以按照如下方式进行配置:
+启动一个使用 `default` 用户和空密码的 ClickHouse 服务器:
```shell
-curl http://127.0.0.1:9180/apisix/admin/plugin_metadata/error-log-logger \
--H "X-API-KEY: $admin_key" -X PUT -d '
-{
- "clickhouse": {
- "user": "default",
- "password": "a",
- "database": "error_log",
- "logtable": "t",
- "endpoint_addr": "http://127.0.0.1:8123";
- }
-}'
+docker run -d -p 8123:8123 -p 9000:9000 -p 9009:9009 --name clickhouse-server
clickhouse/clickhouse-server
```
-### 配置 Kafka
+在 ClickHouse 的 `default` 数据库中,创建一个包含 `data` 列的 `default_logs` 表。插件会将日志推送到该列:
+
+```shell
+curl "http://127.0.0.1:8123"; -X POST -d '
+ CREATE TABLE default.default_logs (
+ data String,
+ PRIMARY KEY(`data`)
+ )
+ ENGINE = MergeTree()
+ ORDER BY (`data`)
+' --user default:
+```
-该插件支持将错误日志发送到 Kafka,你可以按照如下方式进行配置:
+配置插件元数据,填写 ClickHouse 服务器详情,并将日志级别设为 `INFO` 以便发送更多日志进行验证:
```shell
-curl http://127.0.0.1:9180/apisix/admin/plugin_metadata/error-log-logger \
--H "X-API-KEY: $admin_key" -X PUT -d '
-{
- "kafka":{
- "brokers":[
- {
- "host":"127.0.0.1",
- "port":9092
- }
- ],
- "kafka_topic":"test2"
- },
- "level":"ERROR",
- "inactive_timeout":1
-}'
+curl "http://127.0.0.1:9180/apisix/admin/plugin_metadata/error-log-logger"; -X
PUT \
+ -H "X-API-KEY: ${admin_key}" \
+ -d '{
+ "clickhouse": {
+ "endpoint_addr": "http://192.168.2.103:8123";,
+ "user": "default",
+ "password": "",
+ "database": "default",
+ "logtable": "default_logs"
+ },
+ "level": "INFO"
+ }'
```
-## 删除插件
+如需验证,可以通过重新加载 APISIX 手动生成一条 `warn` 级别的日志,然后向 ClickHouse 发送查询请求查看日志条目:
-当你不再需要该插件时,只需要在 `./conf/config.yaml` 中删除或注释该插件即可。
+```shell
+echo 'SELECT * FROM default.default_logs FORMAT Pretty' | curl
"http://127.0.0.1:8123/?"; -d @-
+```
+
+### 发送日志到 Kafka
+
+以下示例演示如何配置 `error-log-logger` 插件将错误日志发送到 Kafka 服务器。
-```yaml
-plugins: # plugin list
- ... ...
- - request-id
- - hmac-auth
- - api-breaker
- #- error-log-logger # enable plugin `error-log-logger
+配置插件元数据,填写 Kafka broker 的详情:
+
+```shell
+curl "http://127.0.0.1:9180/apisix/admin/plugin_metadata/error-log-logger"; -X
PUT \
+ -H "X-API-KEY: ${admin_key}" \
+ -d '{
+ "kafka": {
+ "brokers": [
+ {
+ "host": "127.0.0.1",
+ "port": 9092
+ }
+ ],
+ "kafka_topic": "apisix-error-logs"
+ },
+ "level": "ERROR",
+ "inactive_timeout": 1
+ }'
```


