iamif3000 opened a new issue #8383:
URL: https://github.com/apache/shardingsphere/issues/8383
Hi,
I made a performance test on sharding-proxy(4.1.1), the performance is a
bad. And the result looks strange.
server.yaml
-----------------------
```
authentication:
users:
root:
password: root
sharding:
password: sharding
authorizedSchemas: master_slave_db
props:
max.connections.size.per.query: 1
acceptor.size: 4
executor.size: 100
proxy.frontend.flush.threshold: 128
proxy.transaction.type: LOCAL
proxy.opentracing.enabled: false
proxy.hint.enabled: false
query.with.cipher.column: true
sql.show: true
allow.range.query.with.inline.sharding: false
```
config-master_slave.yaml
---------------------------
```
schemaName: master_slave_db
dataSources:
master_ds:
url:
jdbc:mysql://172.31.197.149:3306/proxy?serverTimezone=UTC&useSSL=false
username: proxy
password: p123456
connectionTimeoutMilliseconds: 30000
idleTimeoutMilliseconds: 60000
maxLifetimeMilliseconds: 1800000
maxPoolSize: 1000
minPoolSize: 400
slave_ds_0:
url:
jdbc:mysql://172.31.197.150:3306/proxy?serverTimezone=UTC&useSSL=false
username: proxy
password: p123456
connectionTimeoutMilliseconds: 30000
idleTimeoutMilliseconds: 60000
maxLifetimeMilliseconds: 1800000
maxPoolSize: 1000
minPoolSize: 400
masterSlaveRule:
name: ms_ds
masterDataSourceName: master_ds
slaveDataSourceNames:
- slave_ds_0
```
Test env
--------------------
```
4 2core4G vms.
2 for mariadb8.5 master-slave cluster
1 for sharding-proxy
1 for jmeter
And the test is simple.
insert: insert into jmeter_test values(null, now(), now(), ...,
unix_timestamp(), ...); // 25 now(), and 4 unix_time_stamp()
query: select id, field1, field29 from jmeter_test limit 100;
```
The test result
---------------------------
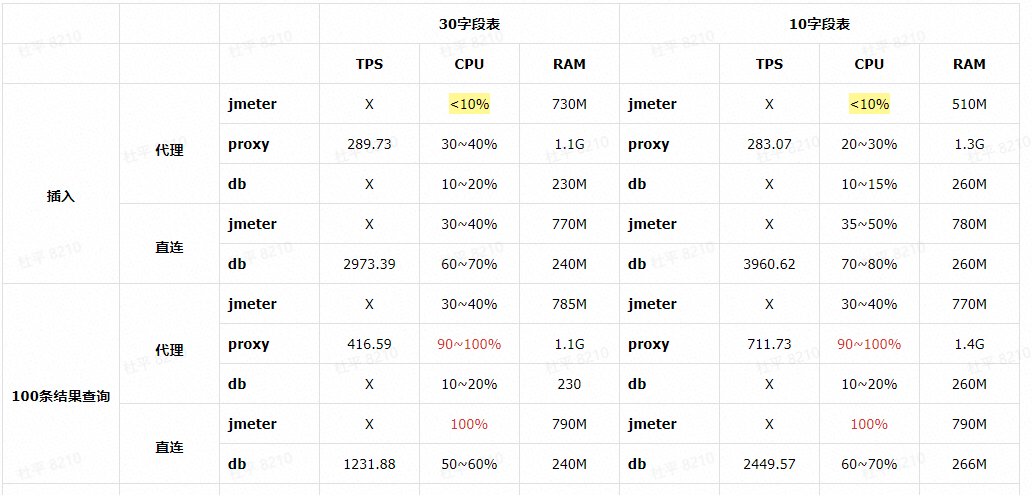
You can see that "select" works OK. But for "insert", the cpu of jmeter,
proxy are both low.
So, my question is "is there any problem with my configuration? or is there
any other config items for performance tuning?"
----------------------------------------------------------------
This is an automated message from the Apache Git Service.
To respond to the message, please log on to GitHub and use the
URL above to go to the specific comment.
For queries about this service, please contact Infrastructure at:
[email protected]