This is an automated email from the ASF dual-hosted git repository.

hanahmily pushed a commit to branch main
in repository https://gitbox.apache.org/repos/asf/skywalking-banyandb.git
The following commit(s) were added to refs/heads/main by this push:
new 3da02593 [GSoC] [UI] Dashboard Page (#496)
3da02593 is described below
commit 3da0259308565484b917c81477281dc2280ab7cc
Author: Sylvie-Wxr <129717259+sylvie-...@users.noreply.github.com>
AuthorDate: Thu Jul 25 18:37:07 2024 -0700
[GSoC] [UI] Dashboard Page (#496)
* Add Dashboard Page to UI
---------
Co-authored-by: Xinrui Wu <xinru...@xinrui-wus-mac.lan>
Co-authored-by: Gao Hongtao <hanahm...@gmail.com>
---
docs/installation/cluster.md | 6 +
docs/observability.md | 28 +-
test/docker/base-compose.yml | 4 +-
ui/src/components/Header/components/header.vue | 10 +
ui/src/components/Header/index.vue | 6 +-
ui/src/components/Read/index.vue | 12 +-
ui/src/styles/elementPlus.scss | 30 +-
ui/src/views/Dashboard/index.vue | 549 ++++++++++++++++++++++++-
8 files changed, 629 insertions(+), 16 deletions(-)
diff --git a/docs/installation/cluster.md b/docs/installation/cluster.md
index 4fbb8055..b0bfee28 100644
--- a/docs/installation/cluster.md
+++ b/docs/installation/cluster.md
@@ -72,3 +72,9 @@ The etcd client certificates can be setup by the [etcd
transport security model]
$ ./banyand-server-static storage --etcd-endpoints=your-https-endpoints
--etcd-tls-ca-file=youf-file-path --etcd-tls-cert-file=youf-file-path
--etcd-tls-key-file=youf-file-path <flags>
$ ./banyand-server-static liaison --etcd-endpoints=your-https-endpoints
--etcd-tls-ca-file=youf-file-path --etcd-tls-cert-file=youf-file-path
--etcd-tls-key-file=youf-file-path <flags>
```
+
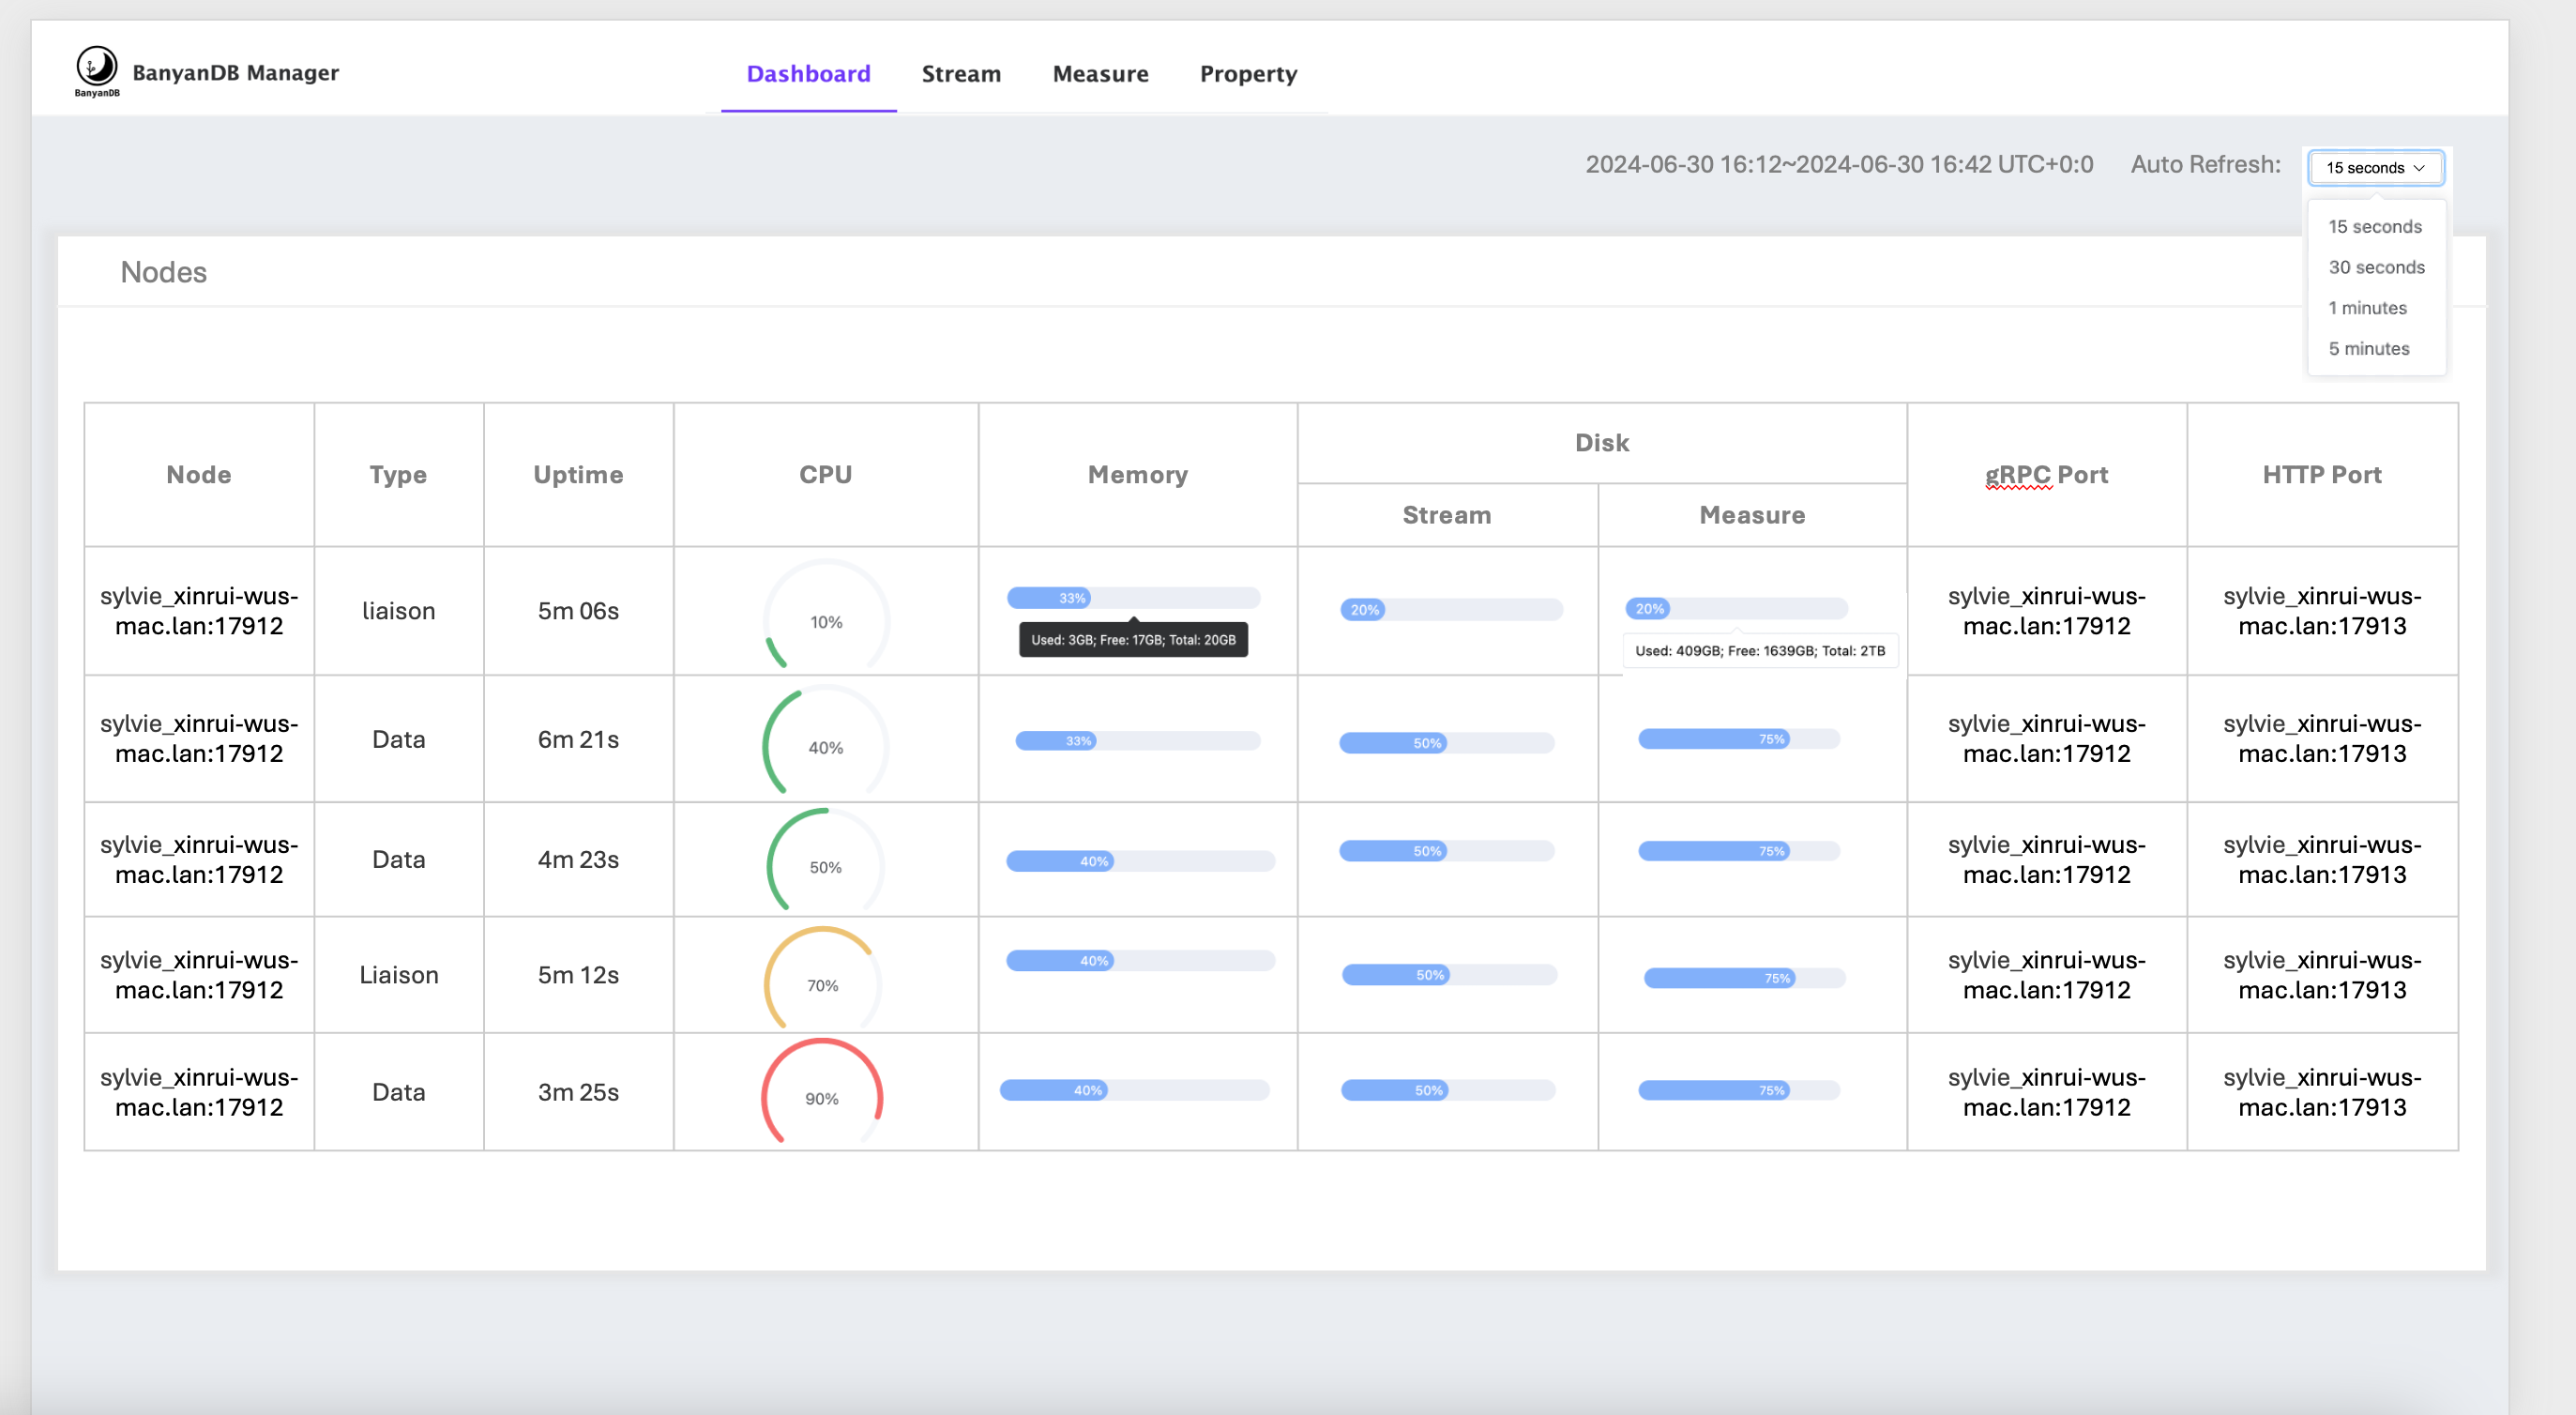
+### Self-observability dashboard
+
+If self-observability mode is on, there will be a dashboard in
[banyandb-ui](http://localhost:17913/) to monitor the nodes status in the
cluster.
+
+
\ No newline at end of file
diff --git a/docs/observability.md b/docs/observability.md
index 2a29e2b7..9f339aaf 100644
--- a/docs/observability.md
+++ b/docs/observability.md
@@ -4,11 +4,35 @@ This document outlines the observability features of
BanyanDB, which include met
## Metrics
-BanyanDB has built-in support for metrics collection. Currently, there is only
one supported metrics provider: `Prometheus`. It is auto enabled at run time
through `observability-modes` flag.
+BanyanDB has built-in support for metrics collection. Currently, there are two
supported metrics provider: `prometheus` and `native`. These can be enabled
through `observability-modes` flag, allowing you to activate one or both of
them.
+
+### Prometheus
+
+Prometheus is auto enabled at run time, if no flag is passed or if `promethus`
is set in `observability-modes` flag.
When the Prometheus metrics provider is enabled, the metrics server listens on
port `2121`. This allows Prometheus to scrape metrics data from BanyanDB for
monitoring and analysis.
-The Docker image is tagged as "prometheus" to facilitate cloud-native
operations and simplify deployment on Kubernetes. This allows users to directly
deploy the Docker image onto their Kubernetes cluster without having to rebuild
it with the "prometheus" tag.
+
+### Self-observability
+
+If the `observability-modes` flag is set to `native`, the self-observability
metrics provider will be enabled. The some of metrics will be displayed in the
dashboard of [banyandb-ui](http://localhost:17913/)
+
+
+
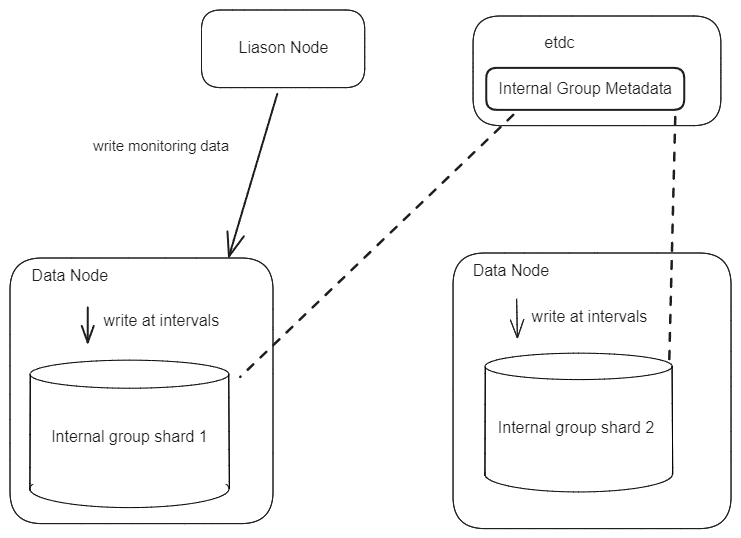
+#### Metrics storage
+
+In self-observability, the metrics data is stored in BanyanDB within the `
_monitoring` internal group. Each metric will be created as a new `measure`
within this group.
+
+You can use BanyanDB-UI or bydbctl to retrieve the data.
+
+#### Write Flow
+
+When starting any node, the `_monitoring` internal group will be created, and
the metrics will be created as measures within this group. All metric values
will be collected and written together at a configurable fixed interval. For a
data node, it will write metric values to its own shard using a local pipeline.
For a liaison node, it will use nodeSelector to select a data node to write its
metric data.
+
+
+
+#### Read Flow
+The read flow is the same as reading data from `measure`, with each metric
being a new measure.
## Profiling
diff --git a/test/docker/base-compose.yml b/test/docker/base-compose.yml
index 77e8c5e6..ac7d0c33 100644
--- a/test/docker/base-compose.yml
+++ b/test/docker/base-compose.yml
@@ -32,7 +32,7 @@ services:
- 17912
- 2121
- 6060
- command: liaison --etcd-endpoints=http://etcd:2379
+ command: liaison --etcd-endpoints=http://etcd:2379
healthcheck:
test: ["CMD", "./bydbctl", "health", "--addr=http://liaison:17913";]
interval: 30s
@@ -45,7 +45,7 @@ services:
- 17912
- 2121
- 6060
- command: data --etcd-endpoints=http://etcd:2379
+ command: data --etcd-endpoints=http://etcd:2379
healthcheck:
test: ["CMD", "./bydbctl", "health", "--grpc-addr=data:17912"]
interval: 30s
diff --git a/ui/src/components/Header/components/header.vue
b/ui/src/components/Header/components/header.vue
index 433cf60c..1df66364 100644
--- a/ui/src/components/Header/components/header.vue
+++ b/ui/src/components/Header/components/header.vue
@@ -117,20 +117,30 @@ initData()
<style lang="scss" scoped>
.image {
+ display: flex;
+ align-items: center;
+ justify-content: space-between;
width: 665px;
height: 100%;
.el-image {
width: 59px;
height: 59px;
+ flex-shrink: 0;
+ flex-grow: 0;
}
.title {
height: 100%;
line-height: 59px;
+ flex-shrink: 0;
+ flex-grow: 0;
+ white-space: nowrap;
+ margin-left: 10px;
}
}
+
.el-menu-item {
font-weight: var(--weight-lt);
font-size: var(--size-lt);
diff --git a/ui/src/components/Header/index.vue
b/ui/src/components/Header/index.vue
index c736a500..bca792d4 100644
--- a/ui/src/components/Header/index.vue
+++ b/ui/src/components/Header/index.vue
@@ -27,7 +27,7 @@ import Header from './components/header.vue'
<el-header>
<Header class="size"></Header>
</el-header>
- <el-main>
+ <el-main class="no-scroll">
<RouterView></RouterView>
</el-main>
</el-container>
@@ -37,6 +37,10 @@ import Header from './components/header.vue'
<style lang="scss" scoped>
+.no-scroll {
+ overflow: hidden;
+}
+
.el-container {
height: 100%;
padding: 0;
diff --git a/ui/src/components/Read/index.vue b/ui/src/components/Read/index.vue
index 6e71fe4f..e1c8f4d0 100644
--- a/ui/src/components/Read/index.vue
+++ b/ui/src/components/Read/index.vue
@@ -413,28 +413,28 @@ function changeFields() {
</div>
</template>
<el-row>
- <el-col :span="12">
+ <el-col :span="16">
<div class="flex align-item-center" style="height: 40px;
width: 100%;">
<el-select v-model="data.tagFamily"
@change="changeTagFamilies" filterable
- placeholder="Please select">
+ placeholder="Please select" style="flex: 0 0
300px;">
<el-option v-for="item in data.options"
:key="item.value" :label="item.label"
:value="item.value">
</el-option>
</el-select>
<el-select v-if="data.type == 'measure'"
v-model="data.handleFields" collapse-tags
- style="margin: 0 0 0 10px; width: 400px;"
@change="changeFields" filterable multiple
+ style="margin: 0 0 0 10px; flex: 0 0 300px;"
@change="changeFields" filterable multiple
placeholder="Please select Fields">
<el-option v-for="item in data.fields"
:key="item.name" :label="item.name" :value="item.name">
</el-option>
</el-select>
- <el-date-picker @change="changeDatePicker"
@visible-change="resetDatePicker" style="margin: 0 10px 0 10px"
v-model="data.timeValue"
+ <el-date-picker @change="changeDatePicker"
@visible-change="resetDatePicker" style="margin: 0 10px 0 10px; flex: 1 1 0;"
v-model="data.timeValue"
type="datetimerange" :shortcuts="shortcuts"
range-separator="to" start-placeholder="begin"
end-placeholder="end" align="right">
</el-date-picker>
- <el-button :icon="Search" @click="searchTableData"
color="#6E38F7" plain></el-button>
+ <el-button :icon="Search" @click="searchTableData"
style="flex: 0 0 auto;" color="#6E38F7" plain></el-button>
</div>
</el-col>
- <el-col :span="12">
+ <el-col :span="8">
<div class="flex align-item-center justify-end"
style="height: 30px;">
<el-button :icon="RefreshRight" @click="getTableData"
plain></el-button>
</div>
diff --git a/ui/src/styles/elementPlus.scss b/ui/src/styles/elementPlus.scss
index dbbc1273..95525560 100644
--- a/ui/src/styles/elementPlus.scss
+++ b/ui/src/styles/elementPlus.scss
@@ -253,4 +253,32 @@
--el-checkbox-checked-bg-color: var(--color-main) !important;
--el-checkbox-checked-input-border-color: var(--color-main) !important;
--el-checkbox-input-border-color-hover: var(--color-main) !important;
-}
\ No newline at end of file
+}
+
+/*==================
+ el-date-picker
+===================*/
+.el-picker-panel__sidebar {
+ width: 120px !important;
+}
+
+.el-date-range-picker .el-picker-panel__body {
+ margin-left: 120px !important;
+}
+
+/*==================
+ el-table in dashboard
+===================*/
+.dashboard .el-table {
+ max-width: 100%;
+ width: auto;
+ margin: 0 auto;
+}
+
+/*==================
+ el-card in dashboard
+===================*/
+.dashboard .el-card {
+ margin: 15px;
+ padding: 0;
+}
diff --git a/ui/src/views/Dashboard/index.vue b/ui/src/views/Dashboard/index.vue
index f6c1b98b..3fa71a1e 100644
--- a/ui/src/views/Dashboard/index.vue
+++ b/ui/src/views/Dashboard/index.vue
@@ -18,16 +18,557 @@
-->
<script setup>
+import { ref, watchEffect, computed } from 'vue';
+import { getTableList } from '@/api/index'
+
+const tableLayout = ref('auto')
+
+const autoRefresh = ref('off');
+
+const options = ref([
+ { value: 'off', label: 'Off' },
+ { value: 15000, label: '15 seconds' },
+ { value: 30000, label: '30 seconds' },
+ { value: 60000, label: '1 minute' },
+ { value: 300000, label: '5 minutes' },
+]);
+
+const utcTime = ref({
+ end: '',
+ oneMinuteAgo: ''
+});
+const commonParams = {
+ groups: ["_monitoring"],
+ offset: 0,
+ orderBy: {
+ indexRuleName: "",
+ sort: "SORT_UNSPECIFIED"
+ },
+ fieldProjection: {
+ names: [
+ "value"
+ ]
+ }
+};
+const tagProjectionUptime = {
+ tagFamilies: [
+ {
+ name: "default",
+ tags: ["node_type", "node_id", "grpc_address", "http_address"]
+ }
+ ]
+}
+const tagProjection = {
+ tagFamilies: [
+ {
+ name: "default",
+ tags: ["node_id", "kind"]
+ }
+ ]
+}
+const tagProjectionDisk = {
+ tagFamilies: [
+ {
+ name: "default",
+ tags: ["node_id", "kind", "path"]
+ }
+ ]
+}
+const nodes = ref([]);
+
+const colors = [
+ { color: '#5cb87a', percentage: 50 },
+ { color: '#edc374', percentage: 80 },
+ { color: '#f56c6c', percentage: 100 },
+];
+
+const pickedShortCutTimeRanges = ref(false);
+
+// Time constants
+const last15Minutes = 15 * 60 * 1000;
+const lastWeek = 7 * 24 * 60 * 60 * 1000;
+const lastMonth = 30 * 24 * 60 * 60 * 1000;
+const last3Months = 3 * 30 * 24 * 60 * 60 * 1000;
+
+// Shortcuts for the date picker
+const shortcuts = [
+ {
+ text: 'Last 15 minutes',
+ value: () => {
+ const end = new Date();
+ const start = new Date(end.getTime() - last15Minutes);
+ pickedShortCutTimeRanges.value = true;
+ return [start, end];
+ },
+ },
+ {
+ text: 'Last week',
+ value: () => {
+ const end = new Date();
+ const start = new Date(end.getTime() - lastWeek);
+ pickedShortCutTimeRanges.value = true;
+ return [start, end];
+ },
+ },
+ {
+ text: 'Last month',
+ value: () => {
+ const end = new Date();
+ const start = new Date(end.getTime() - lastMonth);
+ pickedShortCutTimeRanges.value = true;
+ return [start, end];
+ },
+ },
+ {
+ text: 'Last 3 months',
+ value: () => {
+ const end = new Date();
+ const start = new Date(end.getTime() - last3Months);
+ pickedShortCutTimeRanges.value = true;
+ return [start, end];
+ },
+ },
+];
+
+// State for date picker default 30 mins
+const dateRange = ref([new Date(Date.now() - 30 * 60 * 1000), new Date()]);
+
+const timezoneOffset = computed(() => {
+ const offset = new Date().getTimezoneOffset();
+ const hours = Math.floor(Math.abs(offset) / 60);
+ const minutes = Math.abs(offset) % 60;
+ const sign = offset <= 0 ? "+" : "-";
+ return `UTC${sign}${hours}:${minutes.toString().padStart(2, "0")}`;
+});
+
+const truncatePath = (path) => {
+ if (path.length <= 35) return path;
+ return path.slice(0, 5) + '...' + path.slice(-30);
+};
+
+const isTruncated = (path) => {
+ return path.length > 35;
+};
+
+function formatUptime(seconds) {
+ const hrs = Math.floor(seconds / 3600);
+ const mins = Math.floor((seconds % 3600) / 60);
+ const secs = Math.floor(seconds % 60);
+ return `${hrs > 0 ? `${hrs}h ` : ''}${mins}m ${secs}s`;
+}
+
+function extractAddress(fullAddress) {
+ const parts = fullAddress.split(':');
+ return parts[parts.length - 1];
+}
+
+function formatBytes(bytes) {
+ if (bytes === 0 || bytes === undefined) return 'N/A';
+ const sizes = ['Bytes', 'KB', 'MB', 'GB', 'TB'];
+ const i = Math.floor(Math.log(bytes) / Math.log(1024));
+ return parseFloat((bytes / Math.pow(1024, i)).toFixed(2)) + ' ' + sizes[i];
+}
+
+async function fetchNodes() {
+ getCurrentUTCTime()
+ const [upTimeDataPoints, cpuDataPoints, memoryDataPoints, diskDataPoints]
= await Promise.all([
+ fetchDataPoints("up_time", tagProjectionUptime),
+ fetchDataPoints("cpu_state", tagProjection),
+ fetchDataPoints("memory_state", tagProjection),
+ fetchDataPoints("disk", tagProjectionDisk),
+ ]);
+ // create table rows using uptime datapoints
+ const rows = getLatestForEachNode(upTimeDataPoints).map(item => {
+ const tags = item.tagFamilies[0].tags;
+ const nodeType = tags.find(tag => tag.key ===
'node_type').value.str.value;
+ const nodeId = tags.find(tag => tag.key === 'node_id').value.str.value;
+ const grpcAddress = extractAddress(tags.find(tag => tag.key ===
'grpc_address').value.str.value);
+ const httpAddress = extractAddress(tags.find(tag => tag.key ===
'http_address').value.str.value);
+ const value = item.fields.find(field => field.name ===
'value').value.float.value;
+ return {
+ node_id: nodeId,
+ node_type: nodeType,
+ grpc_address: grpcAddress,
+ http_address: httpAddress,
+ uptime: value
+ };
+ });
+ rows.sort((a, b) => {
+ return a.node_id.localeCompare(b.node_id);
+ });
+ // group by other metrics
+ const cpuData = groupBy(cpuDataPoints, "kind");
+ const memoryData = groupBy(memoryDataPoints, "kind")
+ const paths = groupBy(diskDataPoints, "path")
+ const sortedPaths = sortObject(paths)
+ const diskData = Object.keys(sortedPaths).reduce((acc, path) => {
+ acc[path] = groupBy(sortedPaths[path], 'kind');
+ return acc;
+ }, {});
+ rows.forEach(row => {
+ row.cpu = getLatestField(cpuData.user, row.node_id);
+ row.memory = {
+ used: getLatestField(memoryData.used, row.node_id),
+ total: getLatestField(memoryData.total, row.node_id),
+ used_percent: getLatestField(memoryData.used_percent, row.node_id),
+ };
+ if (row.node_type == "data") {
+ row.disk = {}
+ for (const path in diskData) {
+ row.disk[path] = {
+ used: getLatestField(diskData[path].used, row.node_id),
+ total: getLatestField(diskData[path].total, row.node_id),
+ used_percent: getLatestField(diskData[path].used_percent,
row.node_id)
+ }
+ }
+ }
+ });
+
+ // Post-process row data
+ rows.forEach(row => {
+ row.uptime = formatUptime(row.uptime);
+ });
+ nodes.value = rows
+}
+
+function getCurrentUTCTime() {
+ const end = dateRange.value[1];
+ utcTime.value.end = end.toISOString();
+
+ const oneMinuteAgo = new Date(end.getTime() - 60000);
+ utcTime.value.oneMinuteAgo = oneMinuteAgo.toISOString();
+}
+
+async function fetchDataPoints(type, tagProjection) {
+ const params = JSON.parse(JSON.stringify(commonParams));
+ params.name = type;
+ params.timeRange = {
+ begin: utcTime.value.oneMinuteAgo,
+ end: utcTime.value.end,
+ };
+ params.tagProjection = tagProjection
+ const res = await getTableList(params, "measure");
+ if (res.status === 200) {
+ return res.data.dataPoints;
+ }
+ return null;
+}
+
+function groupBy(data, key) {
+ return data.reduce((acc, obj) => {
+ const keyValue = obj.tagFamilies[0].tags.find(tag => tag.key ===
key).value.str.value;
+ if (!acc[keyValue]) {
+ acc[keyValue] = [];
+ }
+ acc[keyValue].push(obj);
+ return acc;
+ }, {});
+}
+
+function sortObject(groupedObject) {
+ // sort by key
+ const keys = Object.keys(groupedObject);
+ keys.sort();
+ const sortedObject = {};
+ keys.forEach(key => {
+ sortedObject[key] = groupedObject[key];
+ });
+ return sortedObject;
+}
+
+// depuplicate by getting the latest data for each node id
+function getLatestForEachNode(data) {
+ const nodeDataMap = {};
+ data.forEach(item => {
+ const nodeIdTag = item.tagFamilies[0].tags.find(tag => tag.key ===
"node_id");
+ const nodeId = nodeIdTag.value.str.value;
+ const timestamp = new Date(item.timestamp).getTime();
+
+ if (!nodeDataMap[nodeId] || timestamp > nodeDataMap[nodeId].timestamp)
{
+ nodeDataMap[nodeId] = { ...item, timestamp };
+ }
+ });
+
+ const uniqueNodeData = Object.values(nodeDataMap).map(item => {
+ delete item.timestamp;
+ return item;
+ });
+ return uniqueNodeData
+}
+
+// get latest field value by nodeId
+function getLatestField(data, nodeId) {
+ let latestItem = null;
+ let latestTimestamp = 0;
+
+ // Iterate through each item in the data array
+ data.forEach(item => {
+ const nodeIdTag = item.tagFamilies[0].tags.find(tag => tag.key ===
'node_id');
+ const currentNodeId = nodeIdTag.value.str.value;
+ const timestamp = new Date(item.timestamp).getTime();
+
+ // Check if the current item matches the nodeId and is the latest
+ if (currentNodeId === nodeId && timestamp > latestTimestamp) {
+ latestTimestamp = timestamp;
+ latestItem = item;
+ }
+ });
+
+ // Return the first field value if a matching latest item is found
+ if (latestItem && latestItem.fields.length > 0) {
+ return latestItem.fields[0].value.float.value;
+ }
+ return null;
+}
+
+function changeDatePicker(value) {
+ dateRange.value = value;
+ fetchNodes();
+}
+
+// watch update to auto fresh
+let intervalId;
+watchEffect(() => {
+ if (intervalId) clearInterval(intervalId);
+ fetchNodes();
+ if (autoRefresh.value !== 'off') {
+ intervalId = setInterval(() => {
+ const currentStart = dateRange.value[0];
+ const currentEnd = dateRange.value[1];
+ const newEnd = new Date(currentEnd.getTime() + autoRefresh.value);
+ const newStart = new Date(currentStart.getTime() +
autoRefresh.value);
+ dateRange.value = [newStart, newEnd];
+ fetchNodes();
+ }, autoRefresh.value);
+ }
+});
</script>
<template>
- <div>
- <h1 class="home">
- This is the dashboard page
- </h1>
+ <div class="dashboard">
+ <div class="header-container">
+ <span class="timestamp">
+ <el-date-picker @change="changeDatePicker" v-model="dateRange"
type="datetimerange"
+ :shortcuts="shortcuts" range-separator="to"
start-placeholder="begin" end-placeholder="end"
+ align="right" style="margin: 0 10px 0
10px"></el-date-picker>
+ <span class="timestamp-item">{{ timezoneOffset }}</span>
+ </span>
+ <span class="autofresh">
+ <span class="timestamp-item">Auto Fresh:</span>
+ <el-select v-model="autoRefresh" placeholder="Select"
class="auto-fresh-select">
+ <el-option v-for="item in options" :key="item.value"
:label="item.label" :value="item.value" />
+ </el-select>
+ </span>
+ </div>
+
+ <el-card shadow="always">
+ <template #header>
+ <div class="card-header">
+ <span>Nodes</span>
+ </div>
+ </template>
+ <div class="table-container">
+ <el-table v-loading="nodes.loading"
element-loading-text="loading"
+ element-loading-spinner="el-icon-loading"
element-loading-background="rgba(0, 0, 0, 0.8)" stripe
+ border highlight-current-row tooltip-effect="dark"
empty-text="No data yet" :data="nodes"
+ :table-layout="tableLayout">
+ <el-table-column prop="node_id" label="Node
ID"></el-table-column>
+ <el-table-column prop="node_type"
label="Type"></el-table-column>
+ <el-table-column prop="uptime"
label="Uptime"></el-table-column>
+ <el-table-column label="CPU">
+ <template #default="scope">
+ <el-progress type="dashboard"
:percentage="parseFloat((scope.row.cpu * 100).toFixed(2))"
+ :color="colors" />
+ </template>
+ </el-table-column>
+ <el-table-column label="Memory">
+ <template #default="scope">
+ <div class="memory-detail">
+ <div class="progress-container">
+ <el-progress type="line"
+
:percentage="parseFloat((scope.row.memory.used_percent * 100).toFixed(2))"
+ :color="colors" :stroke-width="6"
:show-text="true"
+ class="fixed-progress-bar" />
+ </div>
+ <div class="memory-stats">
+ <span>Used: {{
formatBytes(scope.row.memory.used) }}</span>
+ <span>Total: {{
formatBytes(scope.row.memory.total) }}</span>
+ <span>
+ Free: {{
+ scope.row.memory.total &&
scope.row.memory.used
+ ?
formatBytes(scope.row.memory.total - scope.row.memory.used)
+ : 'N/A'
+ }}
+ </span>
+ </div>
+ </div>
+ </template>
+ </el-table-column>
+
+ <el-table-column label="Disk Details">
+ <template #default="scope">
+ <div v-if="!scope.row.disk">
+ N/A
+ </div>
+ <div class="disk-detail" v-else v-for="(value,
key) in scope.row.disk" :key="key">
+ <div class="progress-container">
+ <span v-if="isTruncated(key)"
class="disk-key">
+ <el-tooltip class="box-item"
effect="light" :content="key" placement="top"
+ :popper-class="'custom-tooltip'">
+ <span>{{ truncatePath(key)
}}:</span>
+ </el-tooltip>
+ </span>
+ <span v-else class="disk-key">{{ key
}}:</span>
+ </div>
+ <div class="progress-container">
+ <el-progress type="line"
+
:percentage="parseFloat((value.used_percent * 100).toFixed(2))" :color="colors"
+ :stroke-width="6" :show-text="true"
class="fixed-progress-bar" />
+ </div>
+ <div class="disk-stats">
+ <span>Used: {{ formatBytes(value.used)
}}</span>
+ <span>Total: {{ formatBytes(value.total)
}}</span>
+ <span>
+ Free: {{
+ value.total && value.used
+ ? formatBytes(value.total -
value.used)
+ : 'N/A'
+ }}
+ </span>
+ </div>
+ </div>
+ </template>
+ </el-table-column>
+
+ <el-table-column label="Port">
+ <template #default="scope">
+ <div>
+ <div>gRPC: {{ scope.row.grpc_address }}</div>
+ <div>HTTP: {{ scope.row.http_address || 'N/A'
}}</div>
+ </div>
+ </template>
+ </el-table-column>
+ </el-table>
+ </div>
+ </el-card>
+
</div>
</template>
<style lang="scss" scoped>
+.dashboard {
+ position: relative;
+}
+
+
+.header-container {
+ display: flex;
+ align-items: center;
+ justify-content: flex-end;
+ margin: 15px 15px 10px 15px;
+ position: sticky;
+ top: 0;
+ z-index: 1000;
+ padding: 10px;
+ background-color: inherit;
+}
+
+@media (max-width: 900px) {
+ .header-container {
+ flex-direction: column;
+ align-items: flex-end;
+ }
+
+ .timestamp,
+ .autofresh {
+ margin-bottom: 10px;
+ }
+
+ .autofresh {
+ display: flex;
+ align-items: center;
+ }
+
+ .timestamp-item {
+ margin-right: 5px;
+ }
+
+}
+
+.timestamp {
+ font-size: 16px;
+ color: #666;
+}
+
+.timestamp-item {
+ margin-right: 12px;
+}
+
+.auto-fresh-select {
+ width: 200px;
+}
+
+.card-header {
+ font-size: 20px;
+ height: 10px;
+}
+
+.header-text {
+ padding: 0;
+ margin: 0;
+
+ hr {
+ margin: 0;
+ border-top: 1px solid grey;
+ }
+}
+
+.fixed-progress-bar {
+ width: 65%;
+ min-width: 150px;
+}
+
+.table-container {
+ max-height: 625px;
+ overflow-y: auto;
+}
+
+.memory-detail,
+.disk-detail {
+ display: flex;
+ flex-direction: column;
+ align-items: flex-start;
+ margin-bottom: 20px;
+}
+
+.disk-key {
+ margin-right: 10px;
+ color: #606266;
+
+}
+
+.progress-container,
+.memory-stats,
+.disk-stats {
+ display: flex;
+ justify-content: flex-start;
+ text-align: left;
+ width: 100%;
+ gap: 10px;
+ padding-top: 6px;
+}
+
+
+@media (max-width: 1200px) {
+
+ .disk-key,
+ .memory-stats,
+ .disk-stats {
+ display: none;
+ }
+ .fixed-progress-bar {
+ width: 80%;
+ }
+}
</style>
\ No newline at end of file