This is an automated email from the ASF dual-hosted git repository.

liuhan pushed a commit to branch main
in repository https://gitbox.apache.org/repos/asf/skywalking-banyandb.git
The following commit(s) were added to refs/heads/main by this push:
new 95378733 Add read write benchmark document for 0.9.0 release (#866)
95378733 is described below
commit 95378733265104c42d813c5e943b552e9b9fe14d
Author: mrproliu <[email protected]>
AuthorDate: Thu Nov 27 14:06:45 2025 +0800
Add read write benchmark document for 0.9.0 release (#866)
---
CHANGES.md | 4 +
docs/menu.yml | 4 +
docs/operation/benchmark/benchmark-0.9.0.md | 158 ++++++++++++++++++++++++++++
3 files changed, 166 insertions(+)
diff --git a/CHANGES.md b/CHANGES.md
index 19d75419..0098c88a 100644
--- a/CHANGES.md
+++ b/CHANGES.md
@@ -12,6 +12,10 @@ Release Notes.
- Fix the wrong retention setting of each measure/stream/trace.
+### Document
+
+- Add read write benchmark document for 0.9.0 release.
+
## 0.9.0
### Features
diff --git a/docs/menu.yml b/docs/menu.yml
index a27cd9ab..434c9be6 100644
--- a/docs/menu.yml
+++ b/docs/menu.yml
@@ -151,6 +151,10 @@ catalog:
path: "/operation/mcp/build"
- name: "Property Background Repair"
path: "/concept/property-repair"
+ - name: "Benchmark"
+ catalog:
+ - name: "v0.9.0"
+ path: "/operation/benchmark/benchmark-0.9.0"
- name: "File Format"
catalog:
- name: "v1.3.0"
diff --git a/docs/operation/benchmark/benchmark-0.9.0.md
b/docs/operation/benchmark/benchmark-0.9.0.md
new file mode 100644
index 00000000..8016da13
--- /dev/null
+++ b/docs/operation/benchmark/benchmark-0.9.0.md
@@ -0,0 +1,158 @@
+# Benchmark
+
+## Version Information
+
+- **BanyanDB Version**: 0.9.0
+- **Commit**: a2479b1c7dd805b74bffbc5f9317da9df6ac95a5
+
+## Test Environment
+
+This benchmark was conducted on a Kubernetes cluster with a single node (16
cores, 64GB RAM), deploying a complete BanyanDB cluster with lifecycle support
using the [skywalking-banyandb-helm
chart](https://github.com/apache/skywalking-banyandb-helm).
+Each BanyanDB Pod is configured with resource limits of 2 cores and 4GB
memory. The benchmark represents 3 days of continuous data ingestion, with all
resource usage and query performance metrics captured after this period. The
specific cluster configuration is as follows:
+
+```yaml
+cluster:
+ enabled: true
+ liaison:
+ replicas: 2
+ env:
+ - name: BYDB_MEASURE_WRITE_TIMEOUT
+ value: "1m"
+ - name: BYDB_STREAM_WRITE_TIMEOUT
+ value: "1m"
+ - name: BYDB_TRACE_WRITE_TIMEOUT
+ value: "1m"
+ - name: BYDB_STREAM_FLUSH_TIMEOUT
+ value: "0s"
+ resources:
+ requests:
+ - key: cpu
+ value: 2
+ - key: memory
+ value: 4Gi
+ limits:
+ - key: cpu
+ value: 2
+ - key: memory
+ value: 4Gi
+ data:
+ nodeTemplate:
+ replicas: 2
+ resources:
+ requests:
+ - key: cpu
+ value: 2
+ - key: memory
+ value: 4Gi
+ limits:
+ - key: cpu
+ value: 2
+ - key: memory
+ value: 4Gi
+
+storage:
+ data:
+ enabled: true
+ persistentVolumeClaims:
+ - mountTargets: [ "measure" ]
+ nodeRole: hot
+ existingClaimName: null
+ claimName: hot-measure-data
+ size: 50Gi
+ accessModes:
+ - ReadWriteOnce
+ storageClass: null
+ volumeMode: Filesystem
+ - mountTargets: [ "stream" ]
+ nodeRole: hot
+ existingClaimName: null
+ claimName: hot-stream-data
+ size: 100Gi
+ accessModes:
+ - ReadWriteOnce
+ storageClass: null
+ volumeMode: Filesystem
+ - mountTargets: [ "property" ]
+ nodeRole: hot
+ existingClaimName: null
+ claimName: hot-property-data
+ size: 5Gi
+ accessModes:
+ - ReadWriteOnce
+ storageClass: null
+ volumeMode: Filesystem
+ - mountTargets: [ "trace" ]
+ nodeRole: hot
+ existingClaimName: null
+ claimName: hot-trace-data
+ size: 500Gi
+ accessModes:
+ - ReadWriteOnce
+ storageClass: null
+ volumeMode: Filesystem
+```
+
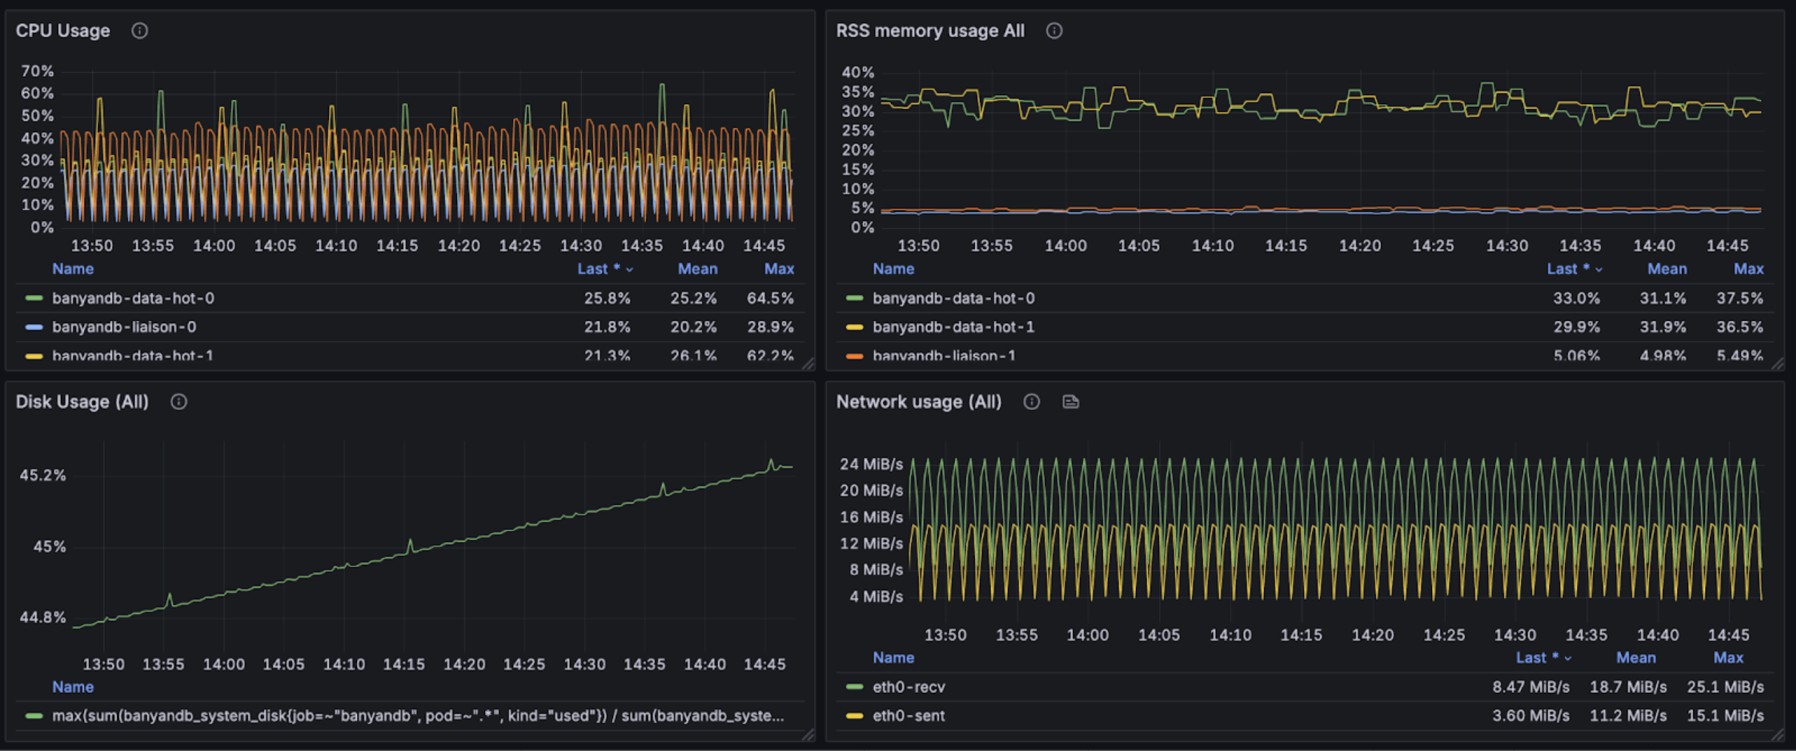
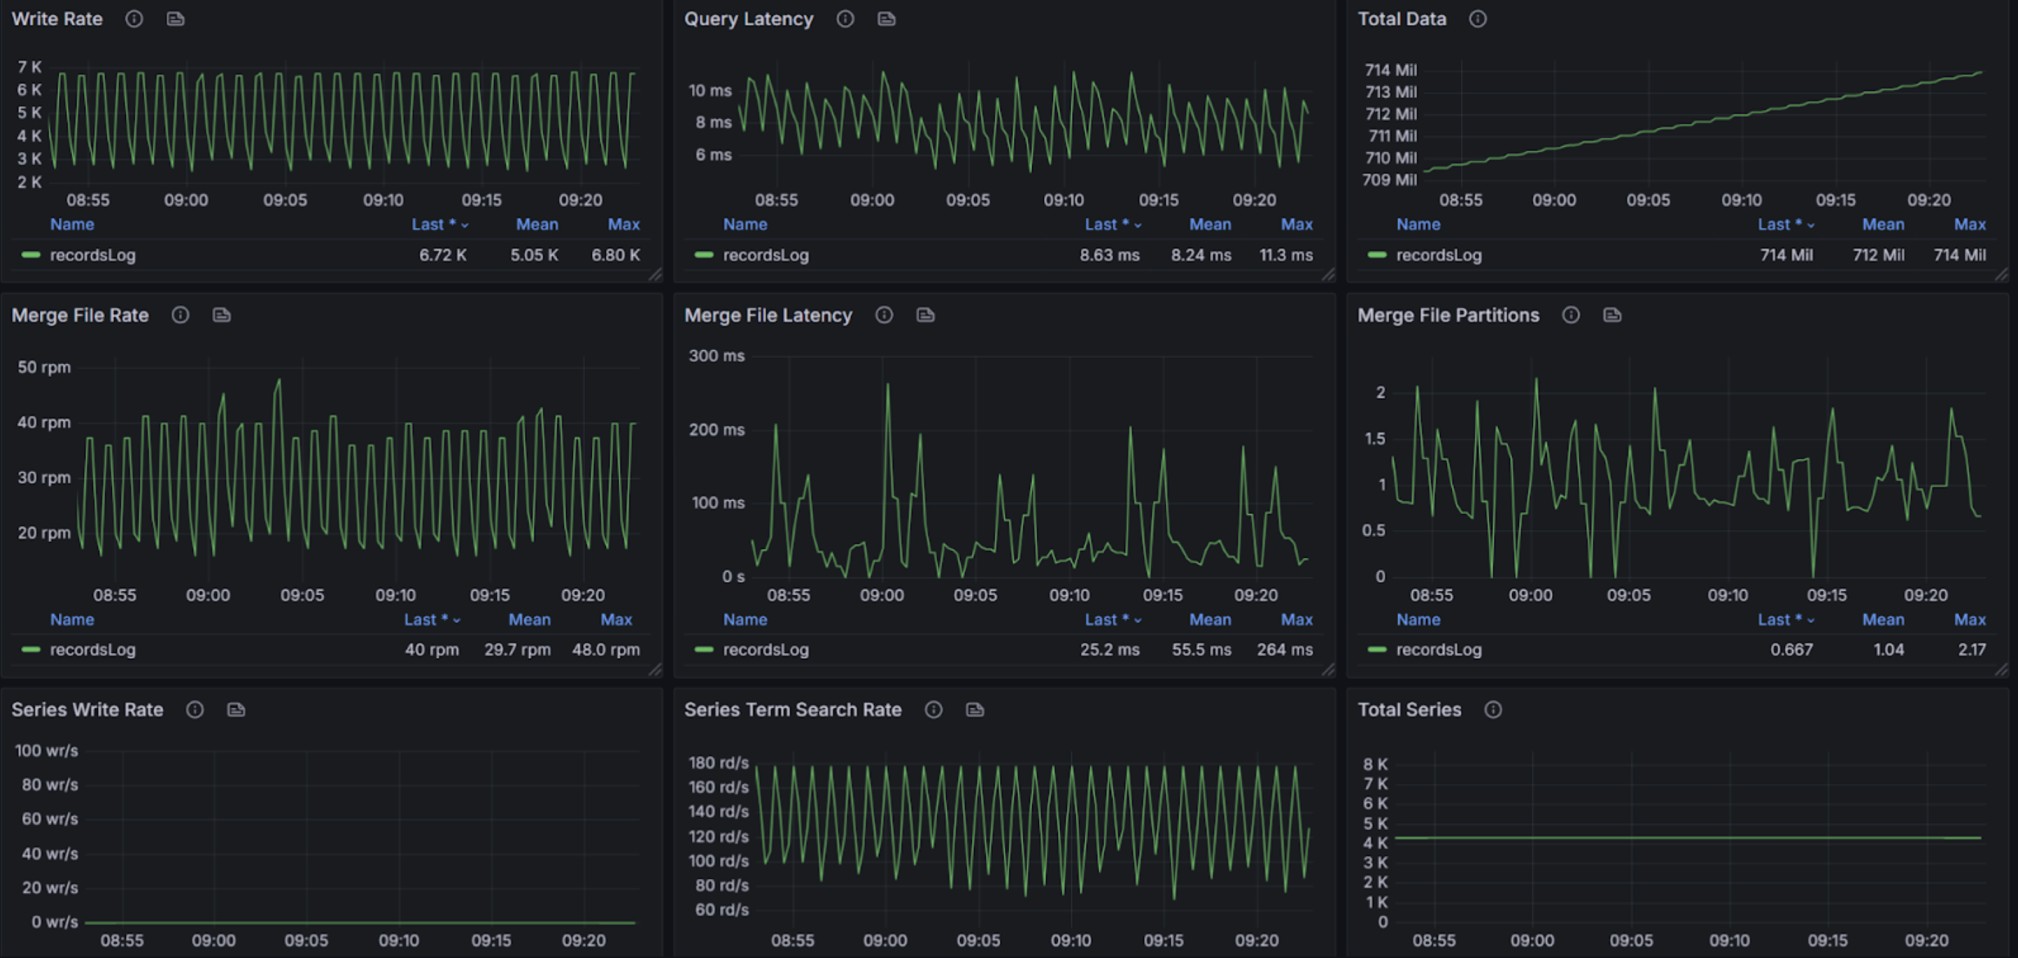
+## Measure
+
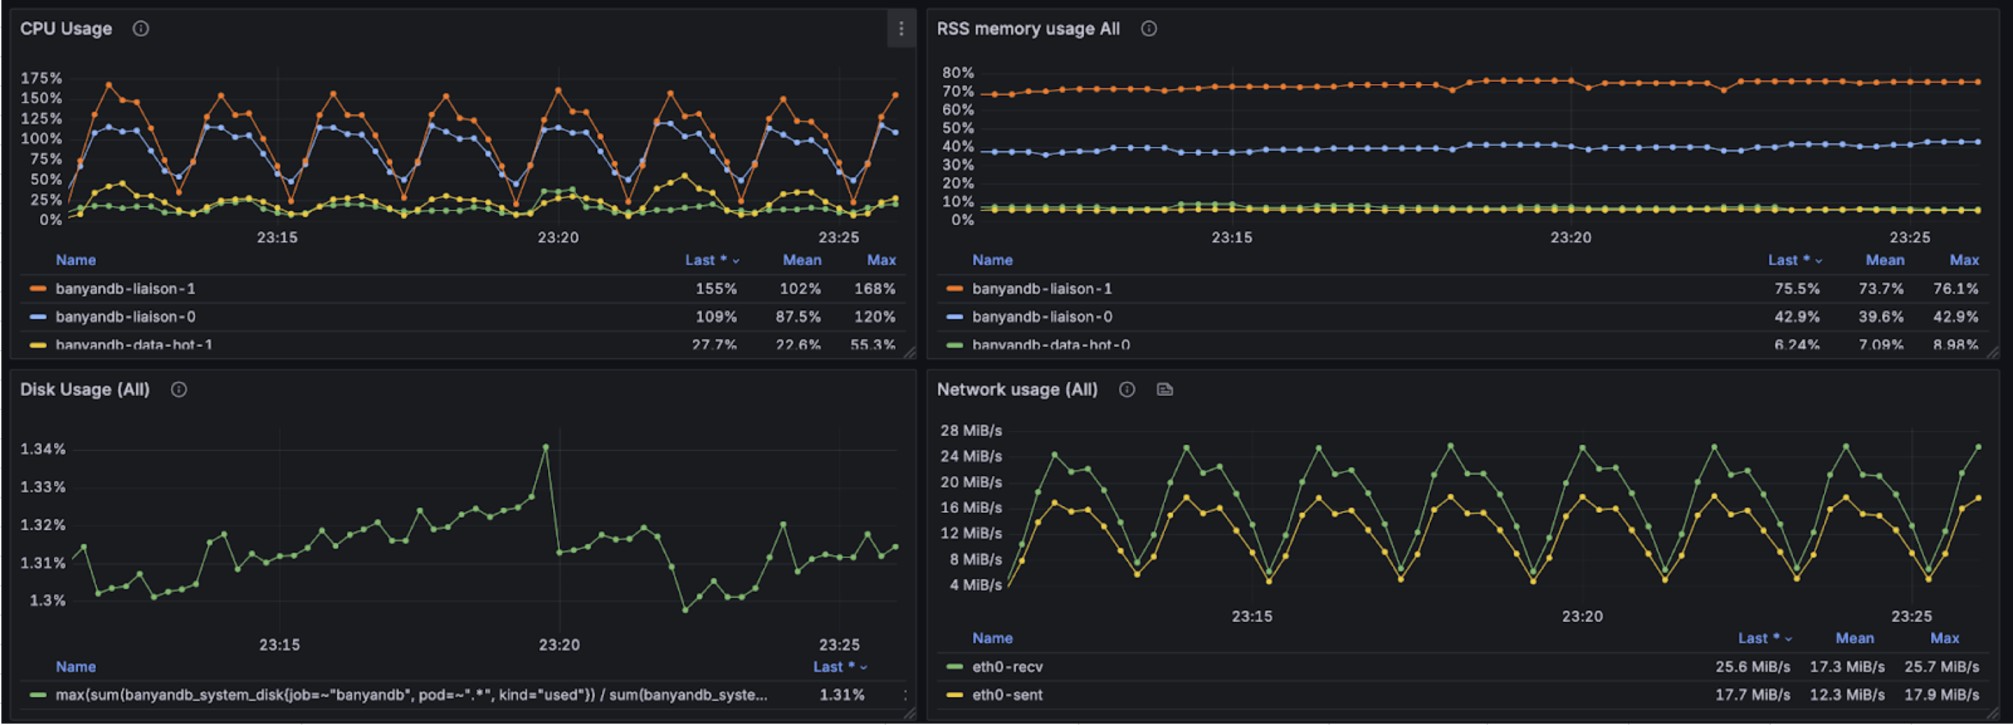
+The test involves 852 services, 5,640 instances, and 9,000 endpoints. These
entities produce over 571,000 metric data points per minute for ingestion, with
some metrics from identical entities written every 30 seconds.
+
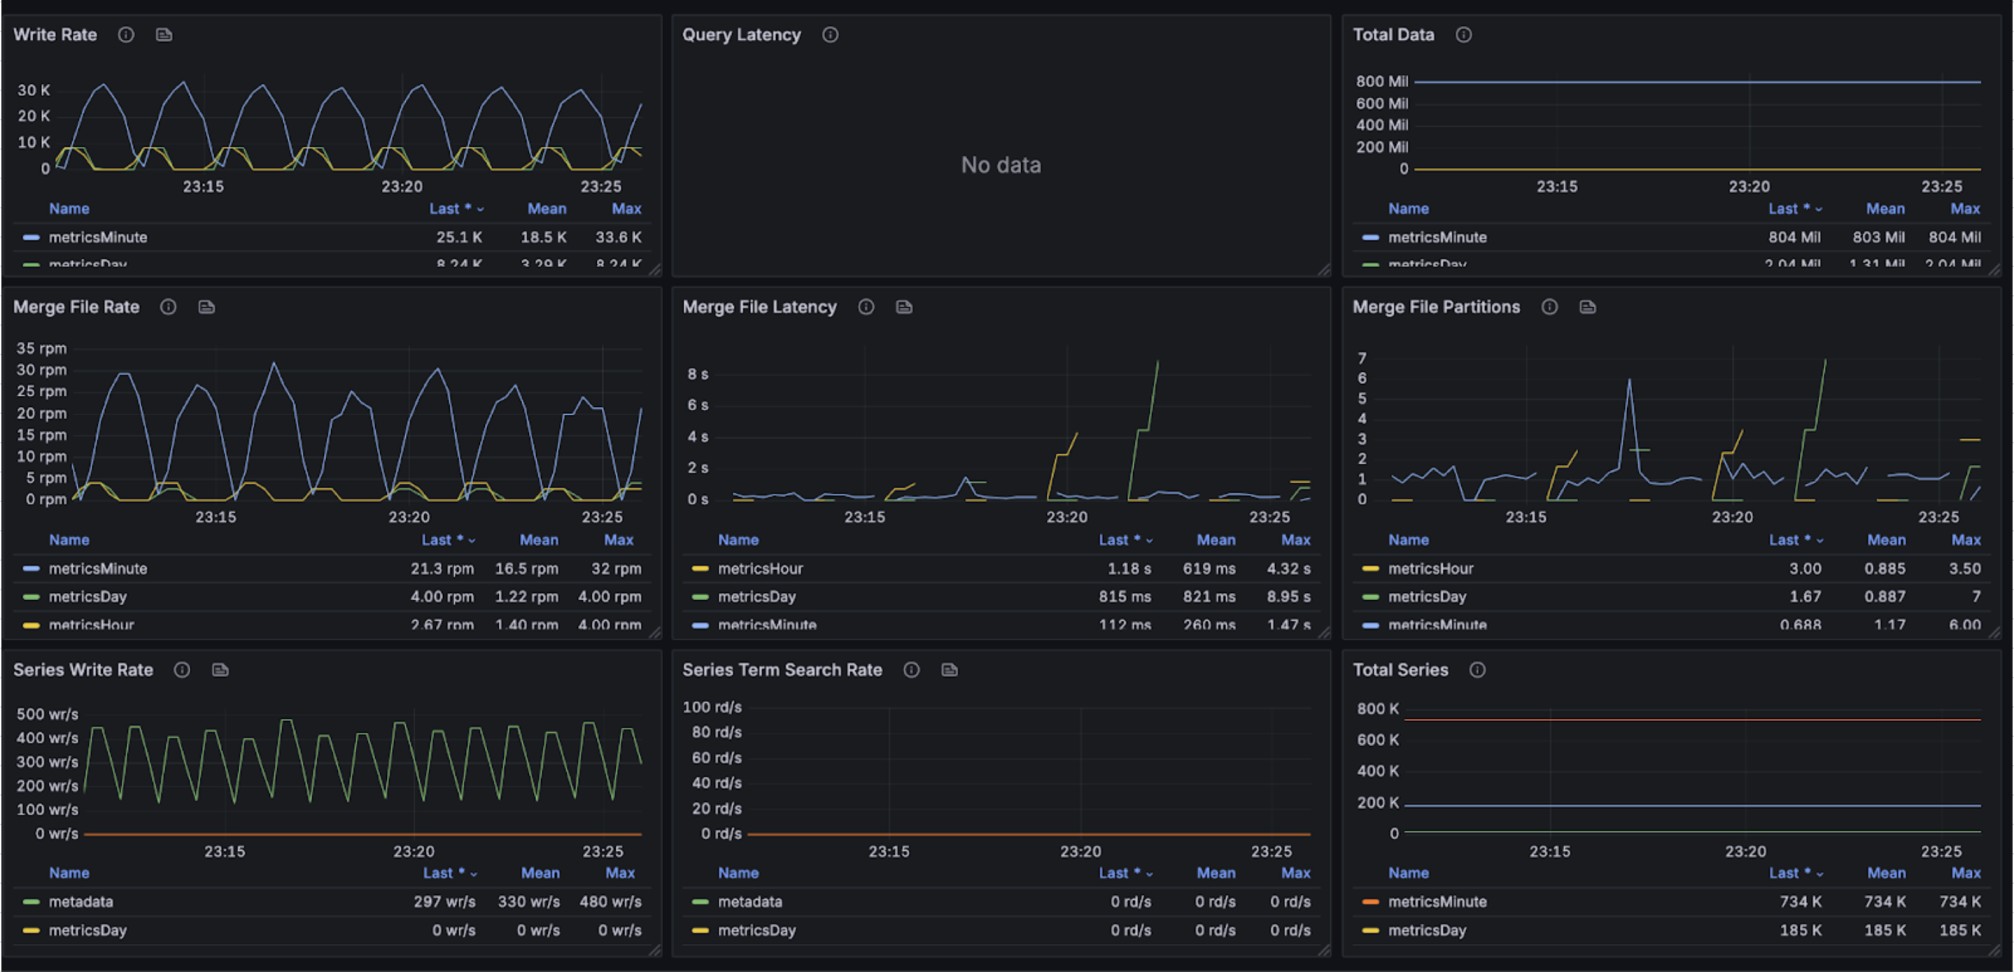
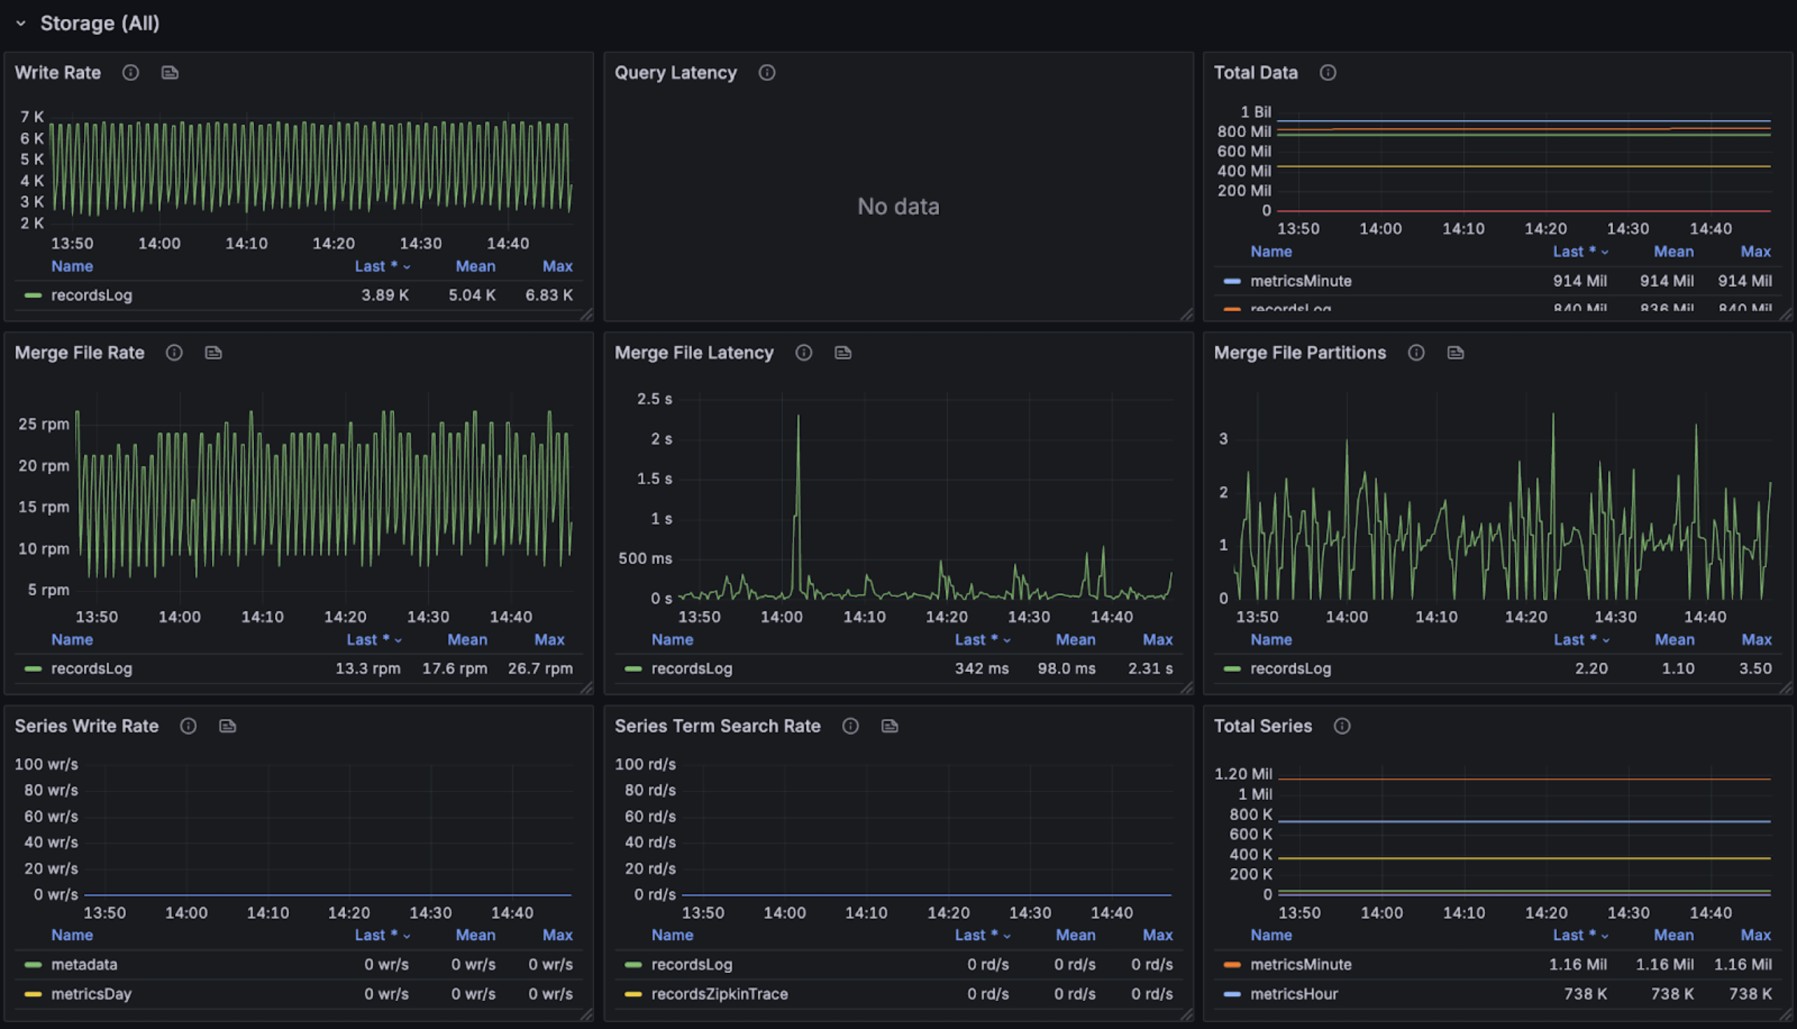
+The following graphs illustrate the resource usage during write operations,
showing CPU and memory consumption across the BanyanDB cluster:
+
+
+
+
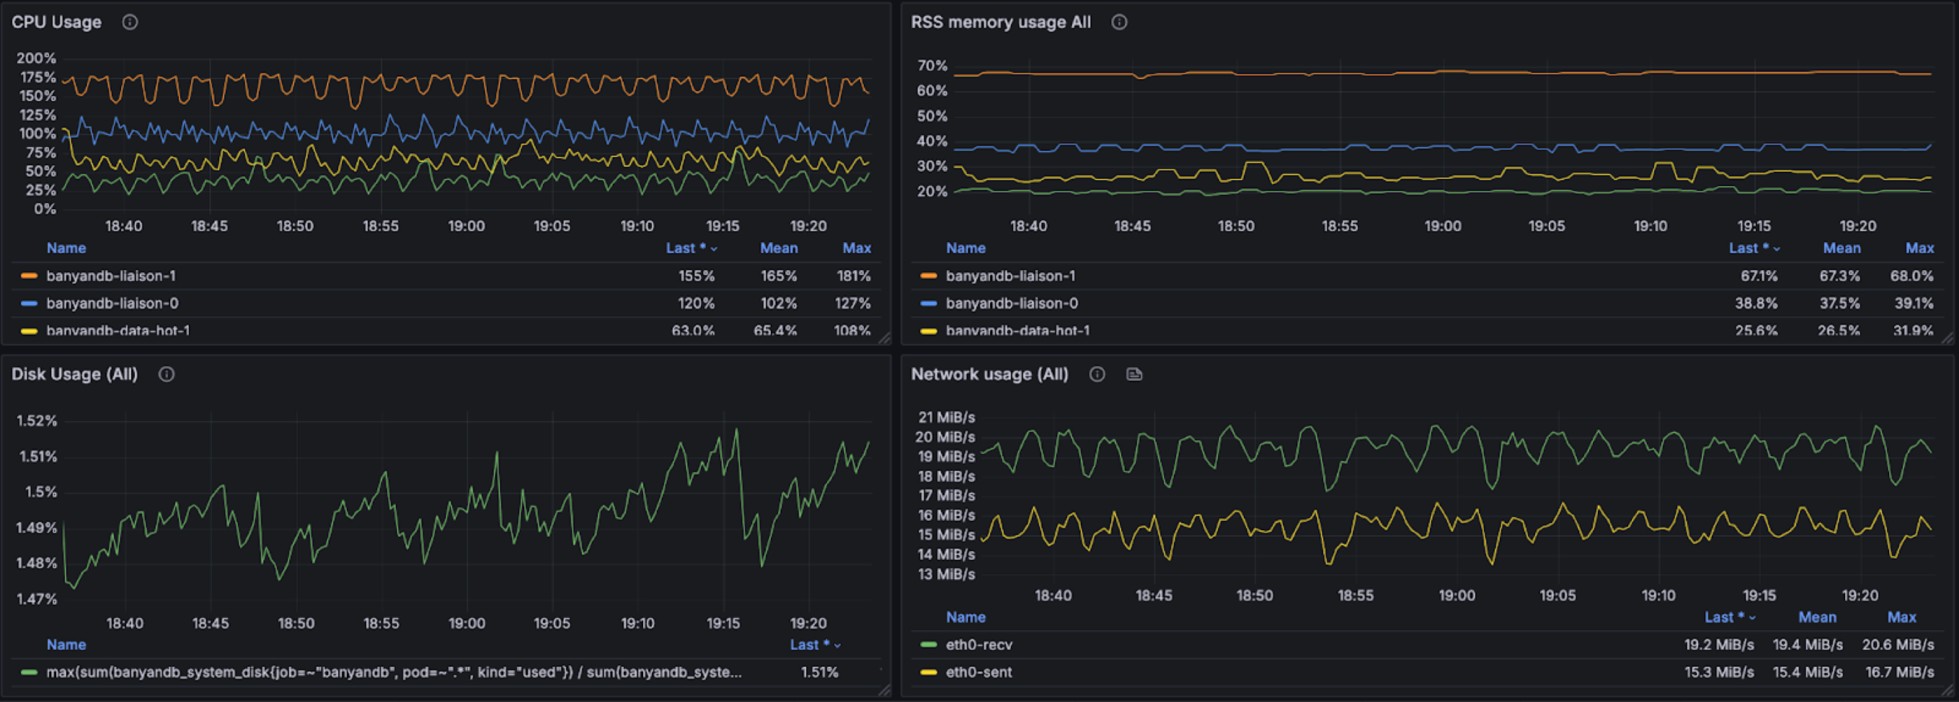
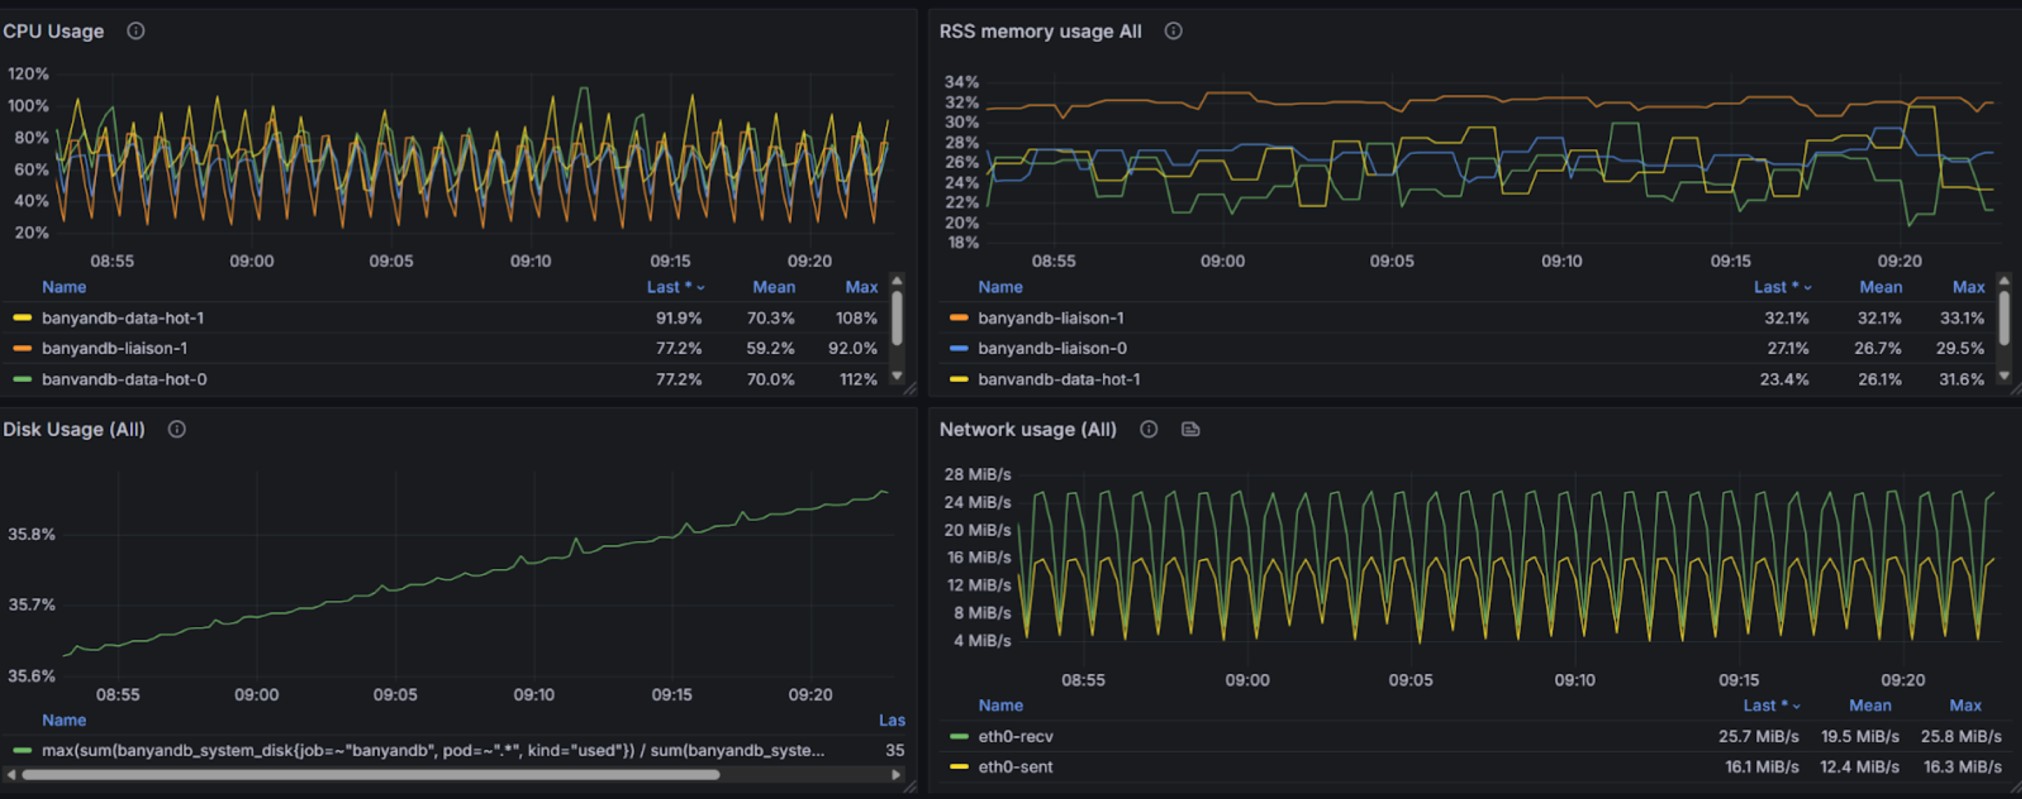
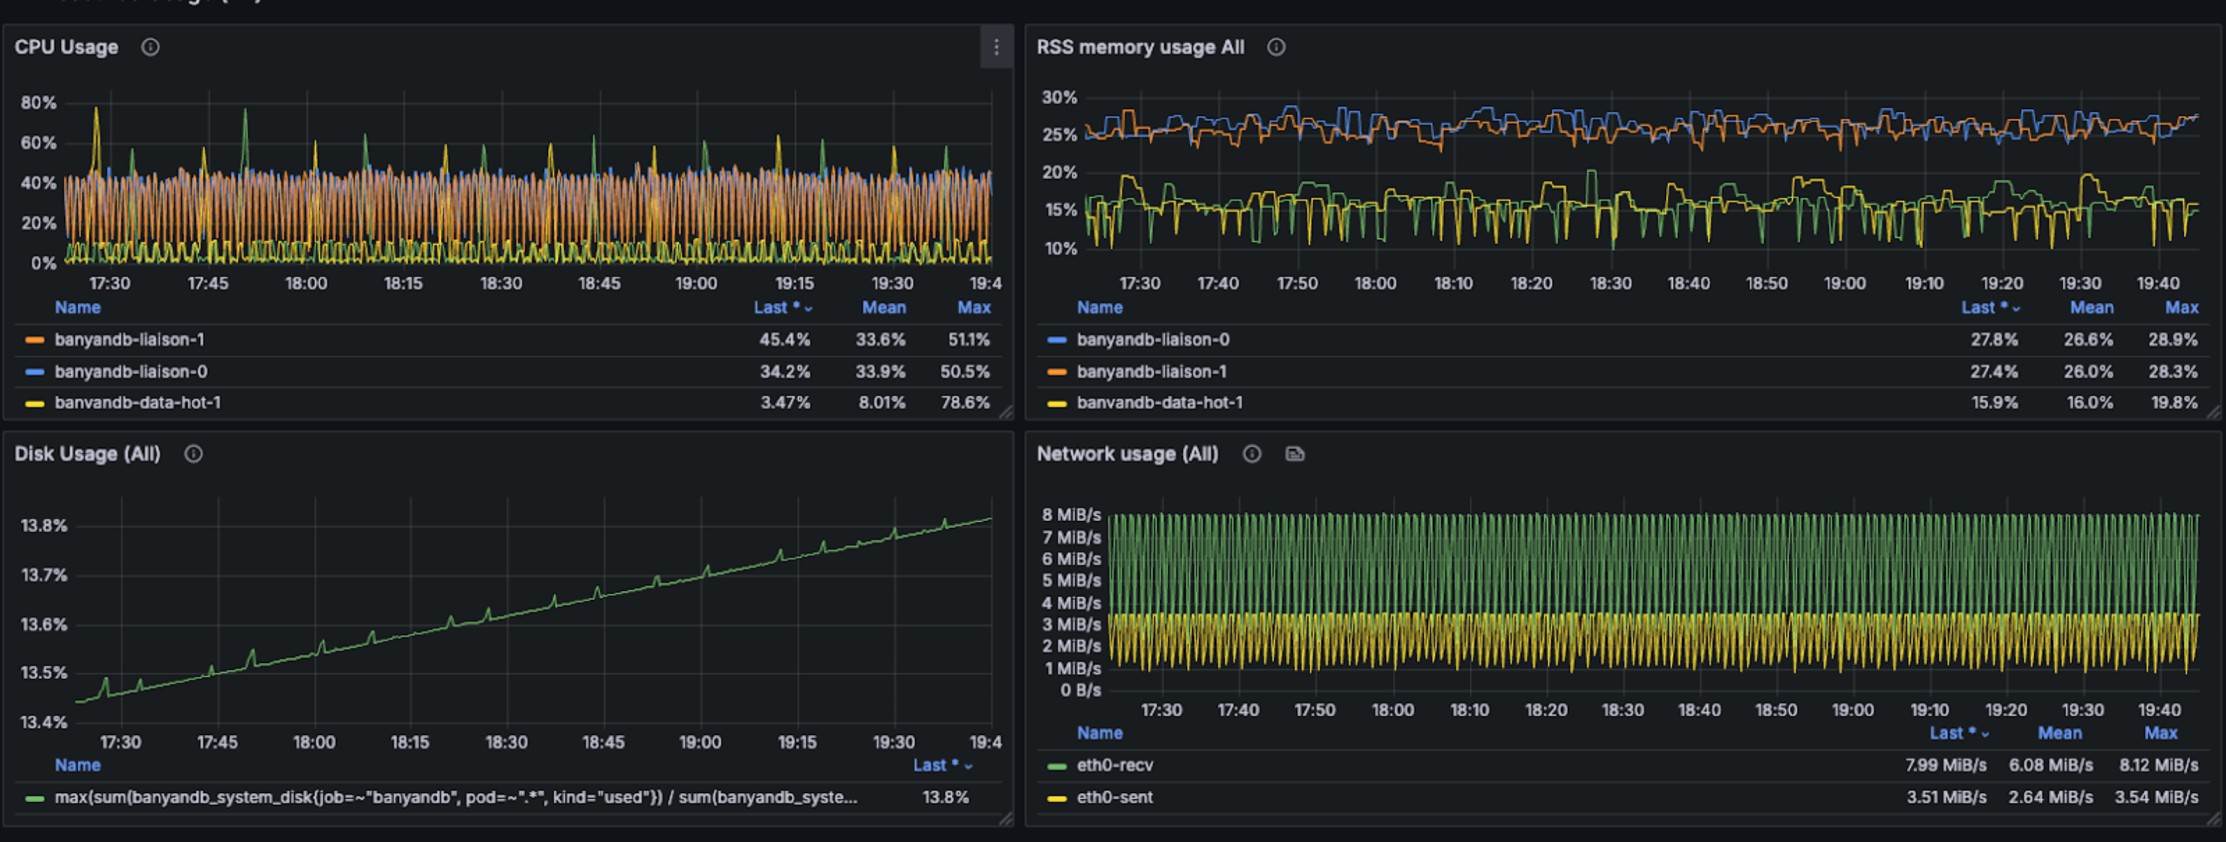
+During concurrent write operations, queries were executed against the most
recent 15 minutes of data with 50 concurrent requests. The query performance
metrics per request are as follows:
+
+Per Request min, max, mean, median, p90, p95, p98, p99 duration
(milliseconds): 1.312920, 618.915122, 48.609702, 26.664489, 118.913909,
171.488923, 229.585007, 288.611386
+
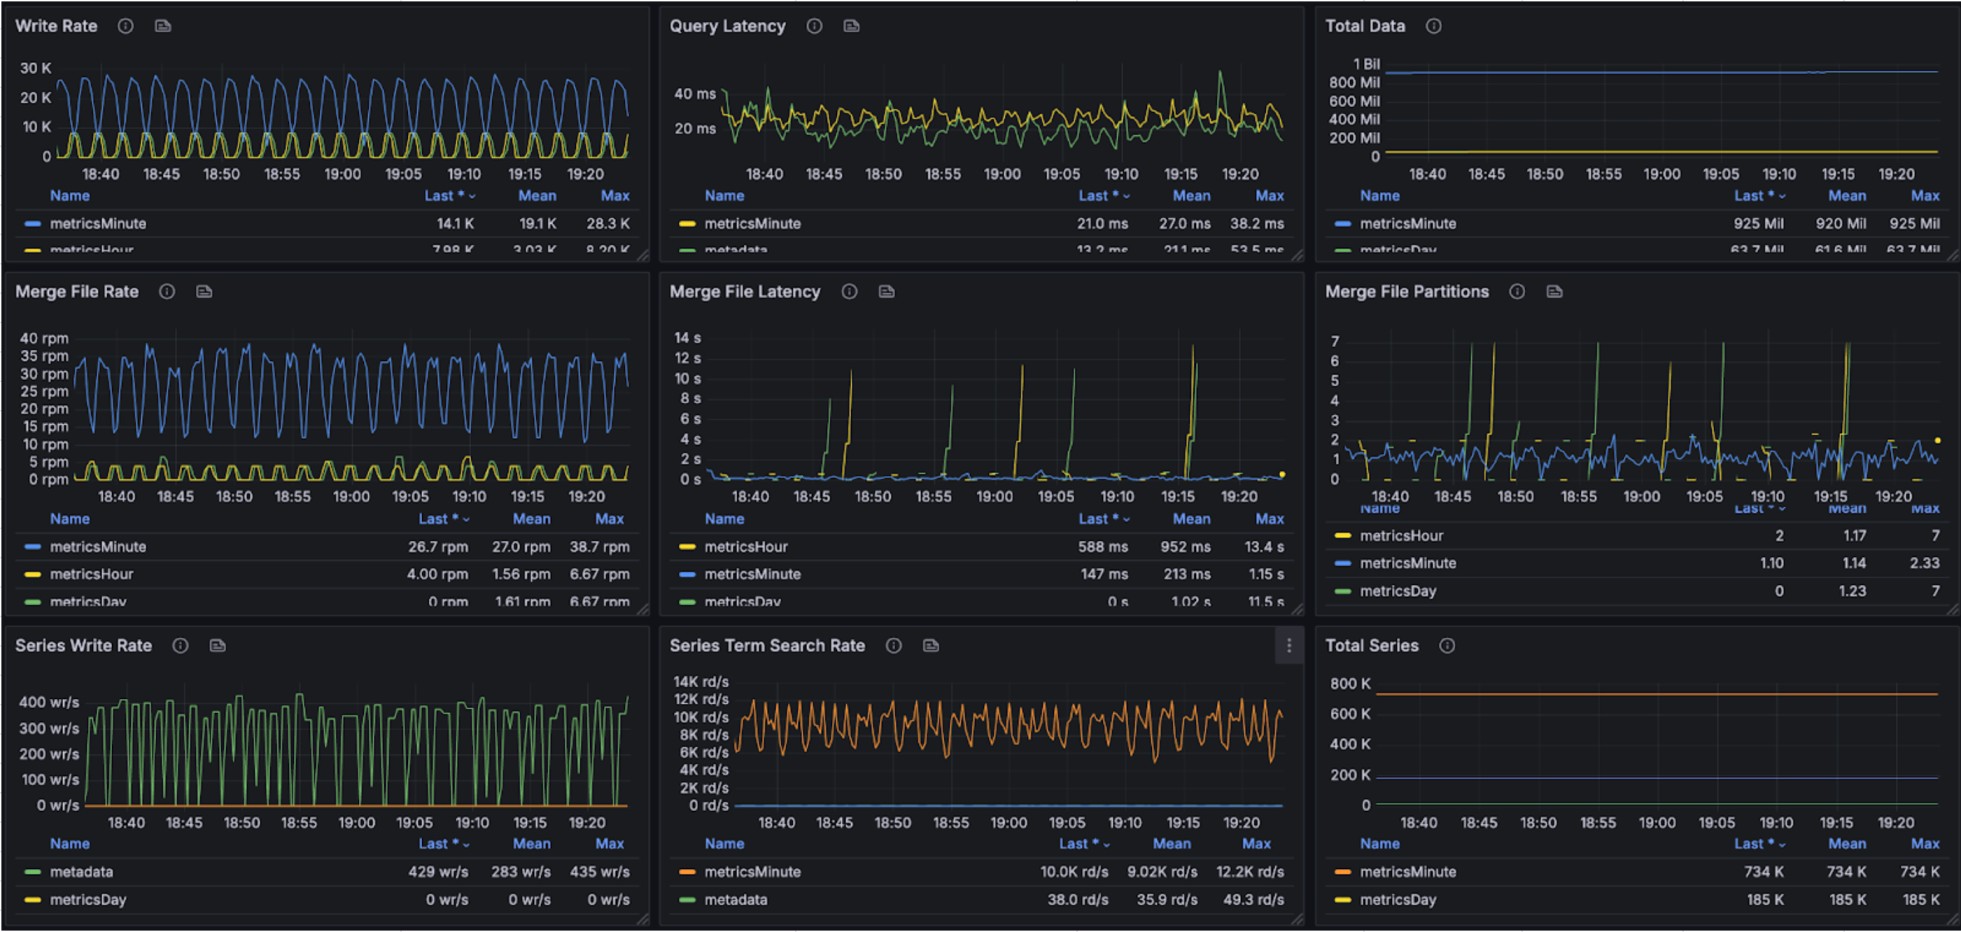
+The graphs below show resource utilization during combined read and write
operations, demonstrating BanyanDB's ability to handle concurrent workloads:
+
+
+
+
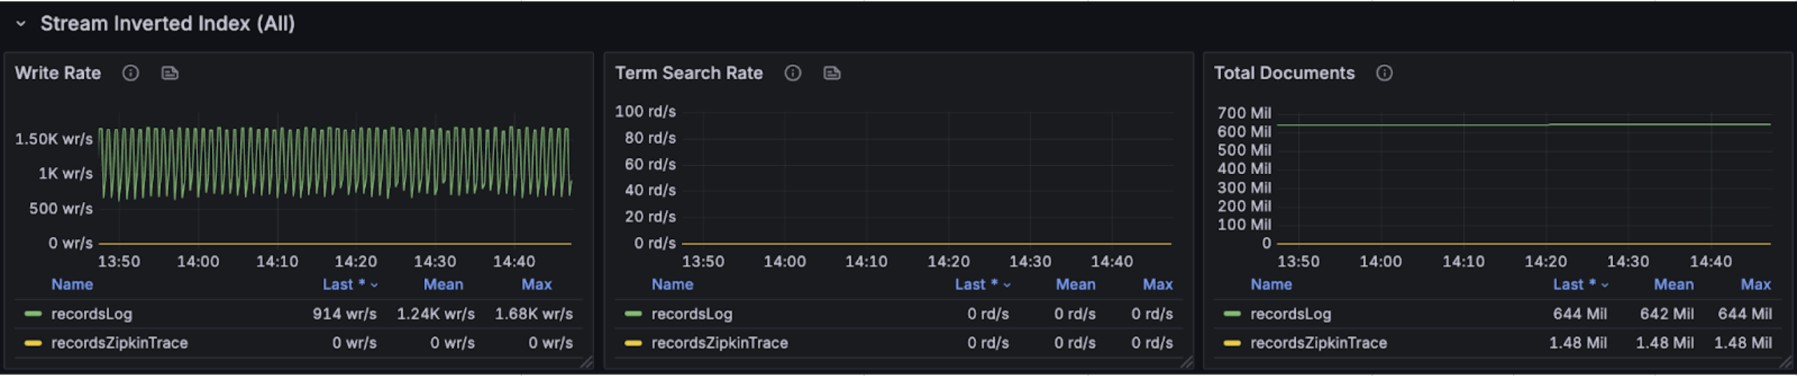
+## Stream
+
+The test involves 54 services and 1,080 instances writing stream data,
generating 151,000 stream records per minute.
+
+The graphs below display resource usage and index performance during stream
write operations:
+
+
+
+
+
+During concurrent write operations, queries were executed to retrieve stream
data from the most recent 15 minutes. The stream query performance per request
is as follows:
+
+Per Request min, max, mean, median, p90, p95, p98, p99 duration
(milliseconds): 3.394290, 237.884627, 10.186698, 7.443185, 13.951209,
21.687960, 49.968980, 72.631009
+
+The following graphs show resource usage during combined read and write
operations for stream data:
+
+
+
+
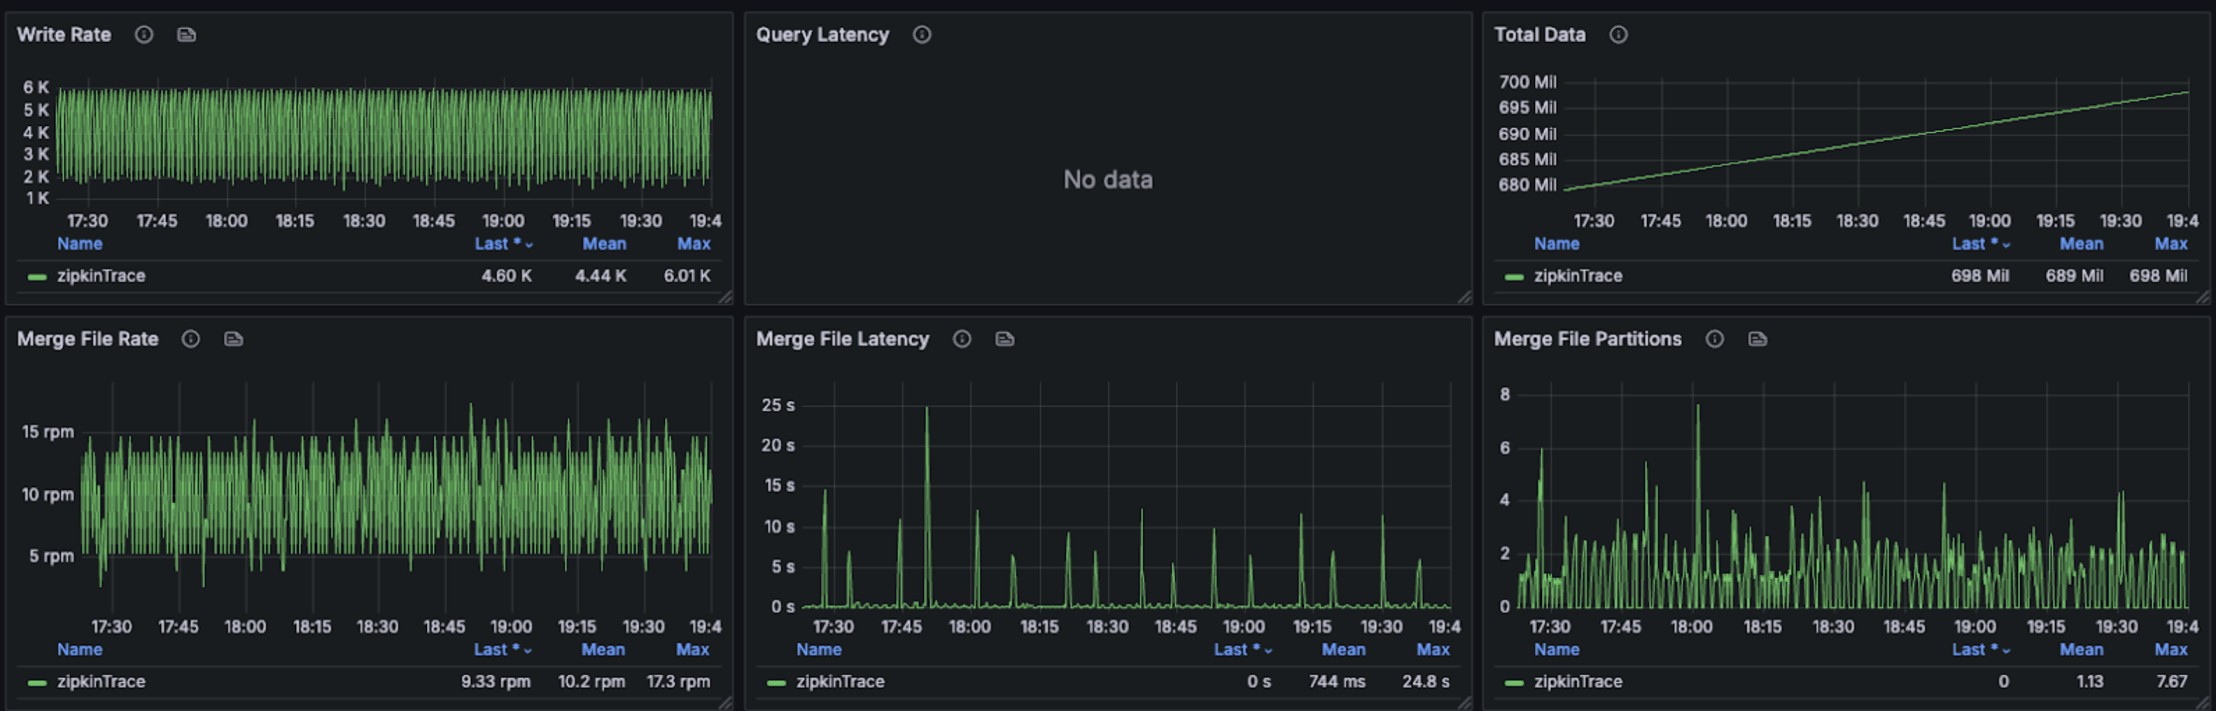
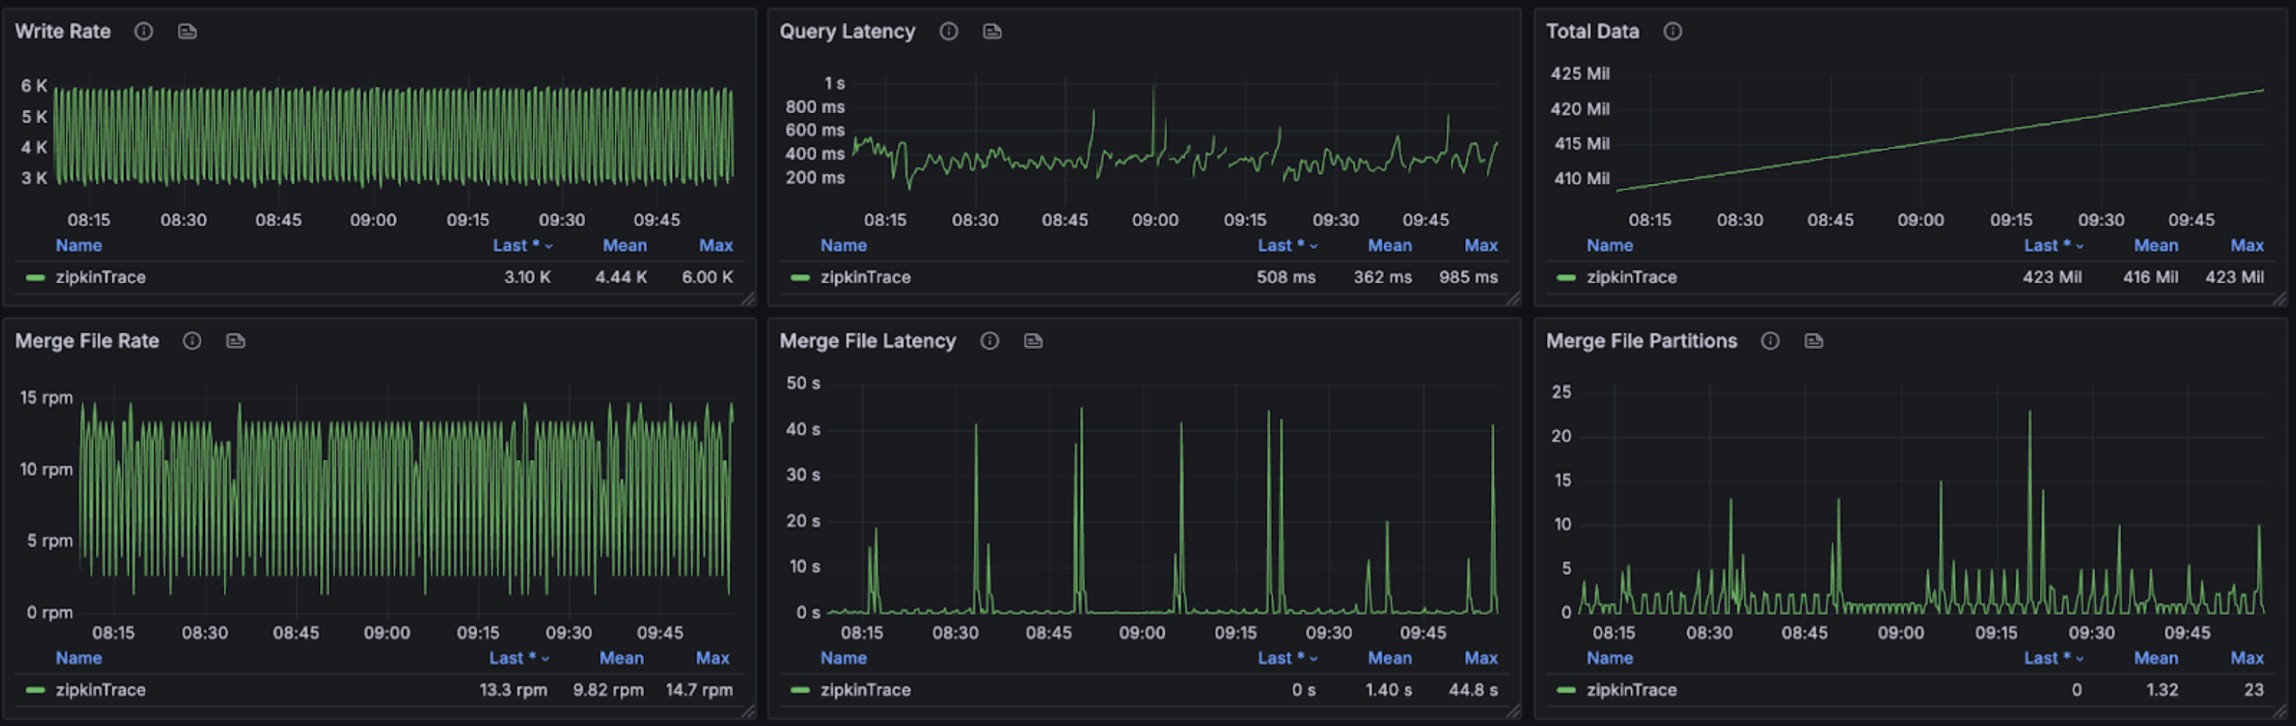
+## Trace
+
+The test involves 48 services and 1,800 instances writing trace data,
generating 6,600 traces within 133,200 spans per minute.
+
+The graphs below illustrate resource consumption during trace write operations:
+
+
+
+
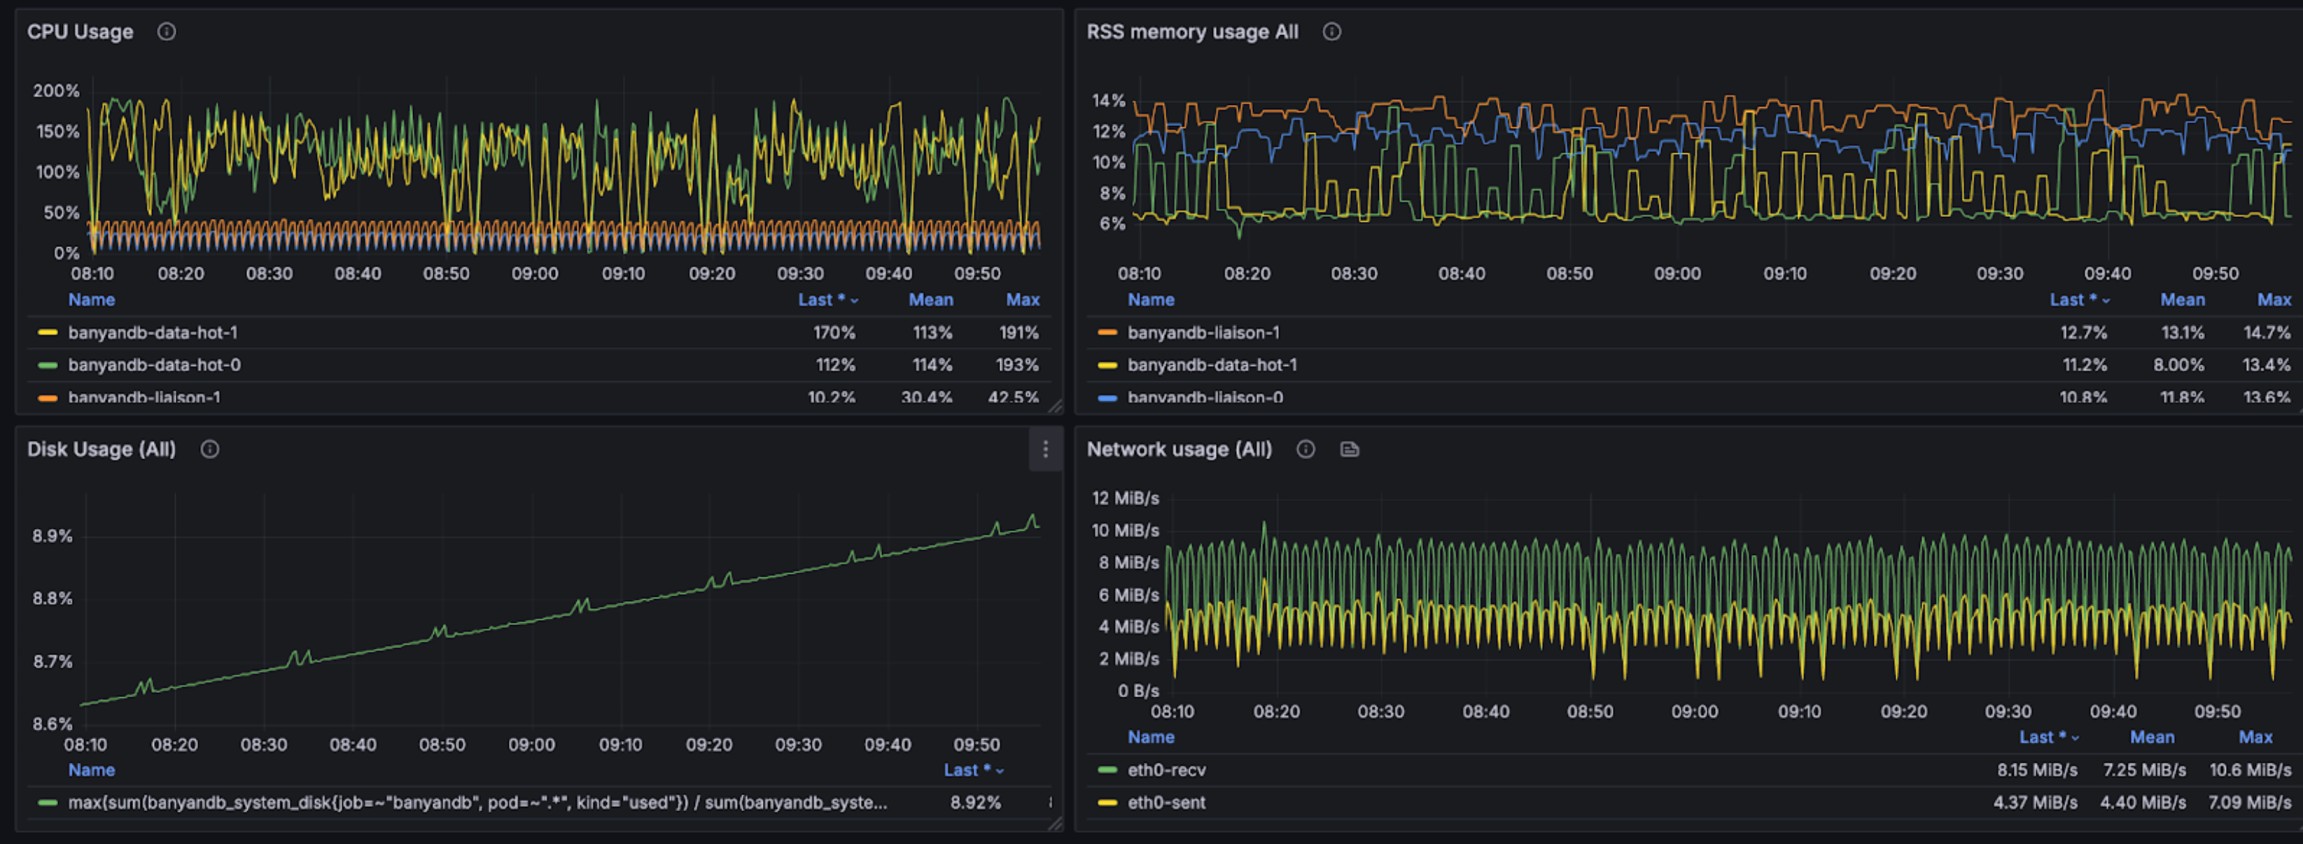
+During concurrent write operations, three different query patterns were
executed against the most recent 15 minutes of trace data. The trace query
performance per request is as follows:
+
+Per Request min, max, mean, median, p90, p95, p98, p99 duration
(milliseconds): 37.750859, 1249.673034, 472.815065, 436.212444, 931.519287,
1007.228856, 1043.850870, 1097.840105
+
+The following graphs show resource usage during combined read and write
operations for trace data:
+
+
+
+
+## Summary
+
+The benchmark demonstrates BanyanDB's ability to handle high-throughput
observability workloads efficiently. Over a sustained 3-day period, the cluster
successfully ingested over 571,000 metric data points, 151,000 stream records,
and 133,200 trace spans per minute while maintaining stable resource
utilization with each pod limited to just 2 cores and 4GB memory.
+
+Query performance remained responsive even under concurrent read/write
workloads. Measure queries showed median latency of 26ms with p99 at 288ms,
while stream queries achieved even better performance with median latency of
7ms and p99 at 72ms. Trace queries, which are typically more complex, showed
median latency of 436ms with p99 at approximately 1.1 seconds.
+
+The resource graphs demonstrate consistent CPU and memory usage throughout the
test period, indicating efficient resource management and the absence of memory
leaks or performance degradation over time. BanyanDB's ability to handle
concurrent read and write operations without significant resource spikes makes
it well-suited for production observability workloads.
+
+These results were achieved on a modest single-node setup (16 cores, 64GB
RAM), suggesting that BanyanDB can deliver strong performance even in
resource-constrained environments. For larger deployments, the cluster mode
with multiple liaison and data nodes can provide additional scalability and
throughput.