wu-sheng commented on code in PR #880:
URL:
https://github.com/apache/skywalking-banyandb/pull/880#discussion_r2589203247
########## docs/operation/benchmark/benchmark-mix-0.9.0.md: ########## @@ -0,0 +1,93 @@ +# Benchmark + +The [previous article](./benchmark-single-each-0.9.0.md) introduced the read/write capabilities of each individual data structure. +This article conduct a mixed read/write test on all data structures. + +## Version Information + +- **BanyanDB Version**: 0.9.0 +- **Commit**: a2479b1c7dd805b74bffbc5f9317da9df6ac95a5 + +## Small specification Test Environment + +This small specification benchmark was conducted on a Kubernetes cluster with a single node (16 cores, 64GB RAM), deploying a complete BanyanDB cluster with lifecycle support using the [skywalking-banyandb-helm chart](https://github.com/apache/skywalking-banyandb-helm). +Each BanyanDB Pod is configured with resource limits of 2 cores and 4GB memory. + +### Write + +The test involves 426 services, 2,820 instances, and 4,500 endpoints. These entities produce over 21,600 logs per minute, +write 26640 spans per minute(max 4000 spans per second). +1.178g disk volume in 2 hours for all telemetry data, 0.85g disk volume in 2 hours for trace. Review Comment: Please calculate for 7 days. It makes more sense for end users. ########## docs/operation/benchmark/benchmark-mix-0.9.0.md: ########## @@ -0,0 +1,93 @@ +# Benchmark + +The [previous article](./benchmark-single-each-0.9.0.md) introduced the read/write capabilities of each individual data structure. +This article conduct a mixed read/write test on all data structures. + +## Version Information + +- **BanyanDB Version**: 0.9.0 +- **Commit**: a2479b1c7dd805b74bffbc5f9317da9df6ac95a5 + +## Small specification Test Environment + +This small specification benchmark was conducted on a Kubernetes cluster with a single node (16 cores, 64GB RAM), deploying a complete BanyanDB cluster with lifecycle support using the [skywalking-banyandb-helm chart](https://github.com/apache/skywalking-banyandb-helm). +Each BanyanDB Pod is configured with resource limits of 2 cores and 4GB memory. + +### Write + +The test involves 426 services, 2,820 instances, and 4,500 endpoints. These entities produce over 21,600 logs per minute, +write 26640 spans per minute(max 4000 spans per second). +1.178g disk volume in 2 hours for all telemetry data, 0.85g disk volume in 2 hours for trace. + +The following graphs illustrate the resource usage during write operations, showing CPU and memory consumption across the BanyanDB cluster: + +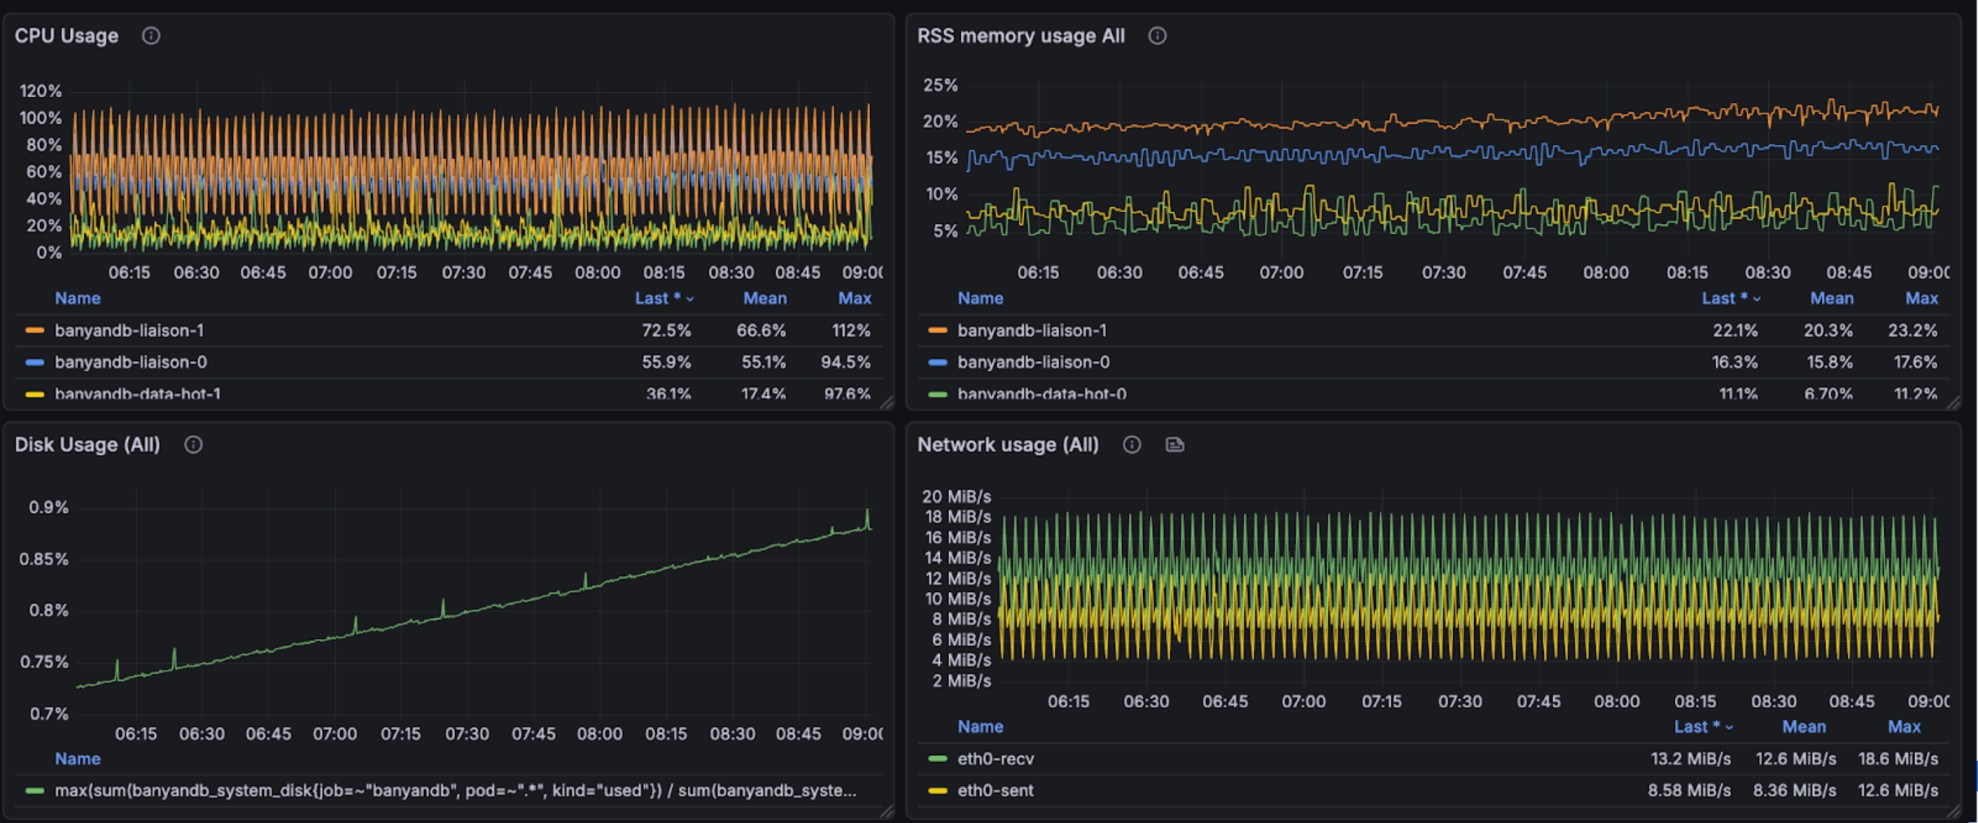 +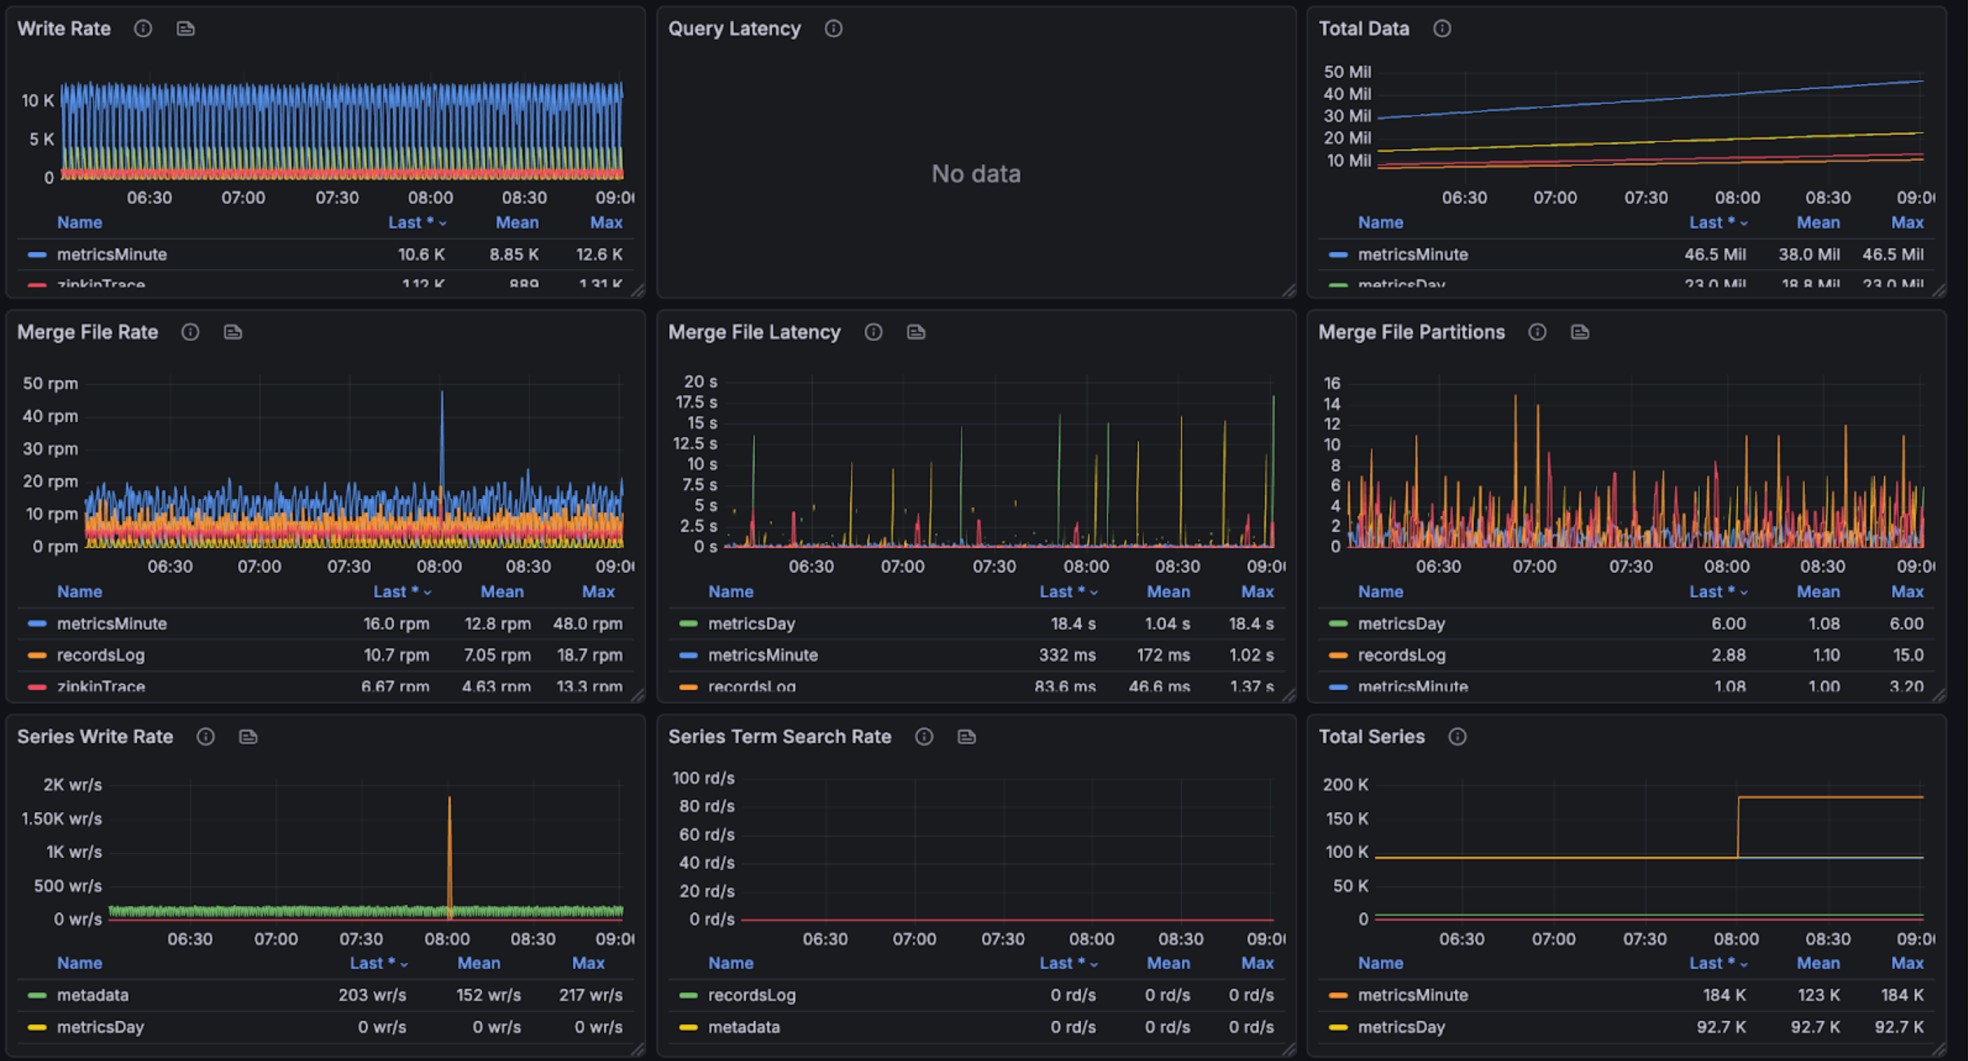 +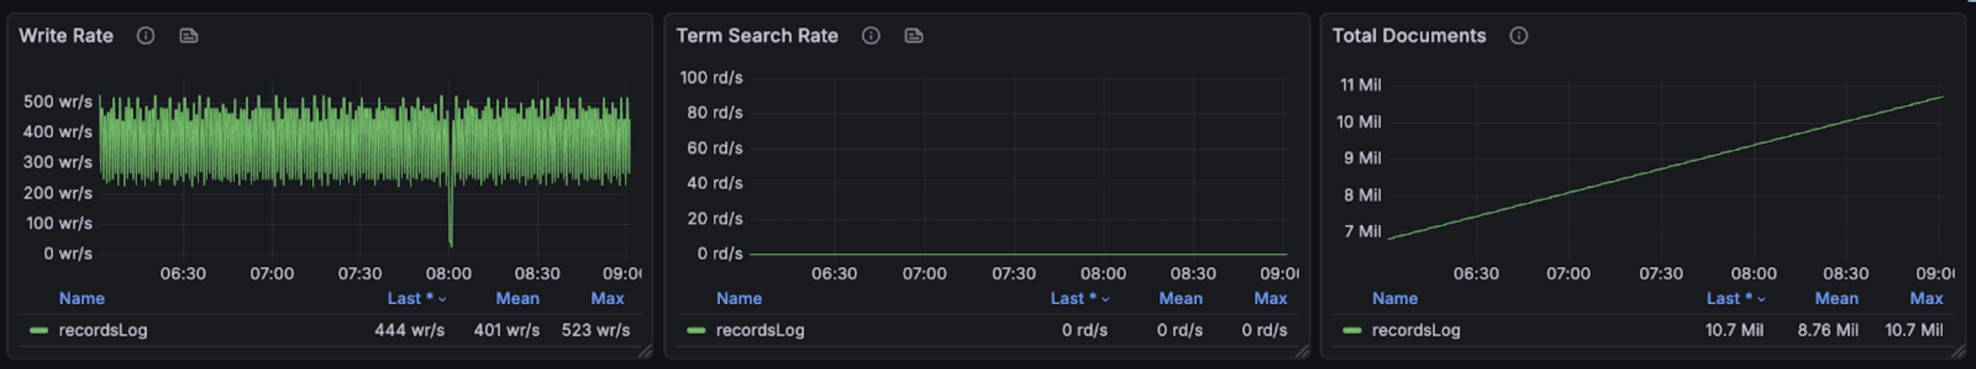 + +### Read + +During query and writing, it takes 200% CPU, 26% avg, 35% peak memory cost(total 4g). +Note, other parts are used by OS Page Cache. We don't have measurement to check the efficiency of that. + +The query performance metrics per request are as follows: + +- Log Query Performance: min,max,mean,median,p90,p95,p98,p99 duration(millisecond): 3.977926, 368.129126, 58.283439, 46.903162, 114.155032, 152.219269, 190.683562, 271.887189 +- Trace Query Performance: min,max,mean,median,p90,p95,p98,p99 duration(millisecond): 40.465124, 1223.494809, 337.795821, 305.647714, 610.154281, 703.630915, 905.547645, 988.851445 +- Metrics query in major dashboards are good. + +The graphs below show resource utilization during combined read and write operations, demonstrating BanyanDB's ability to handle concurrent workloads: + +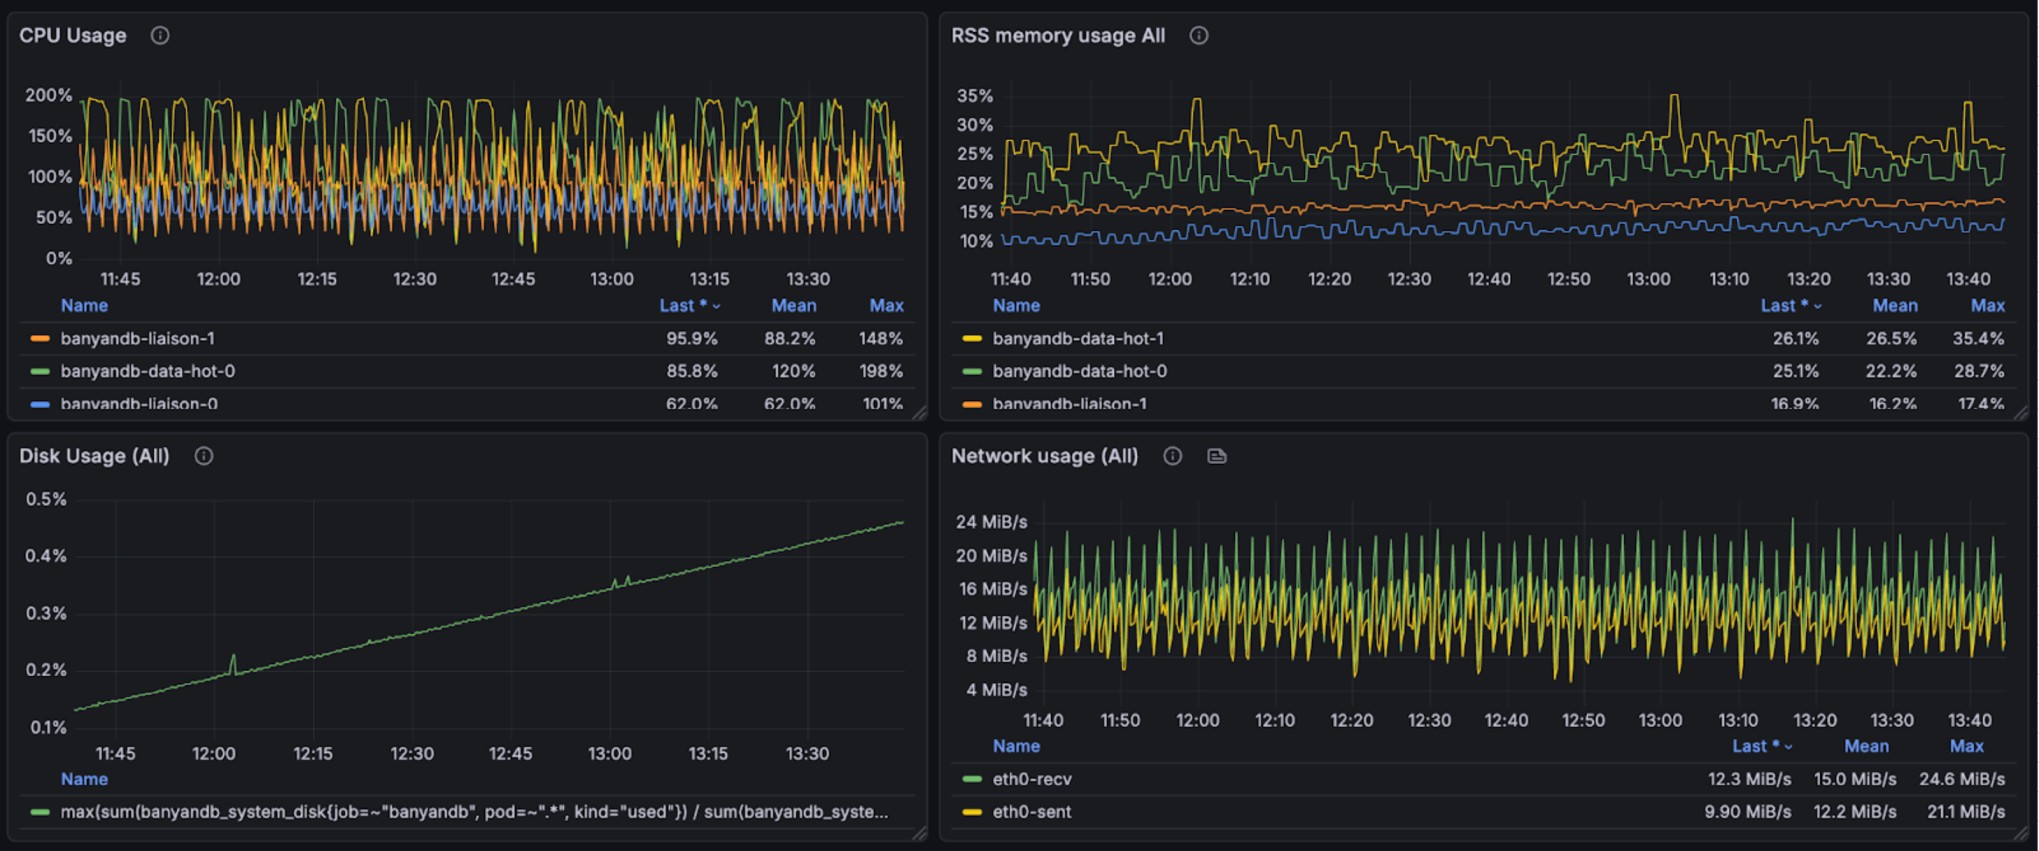 +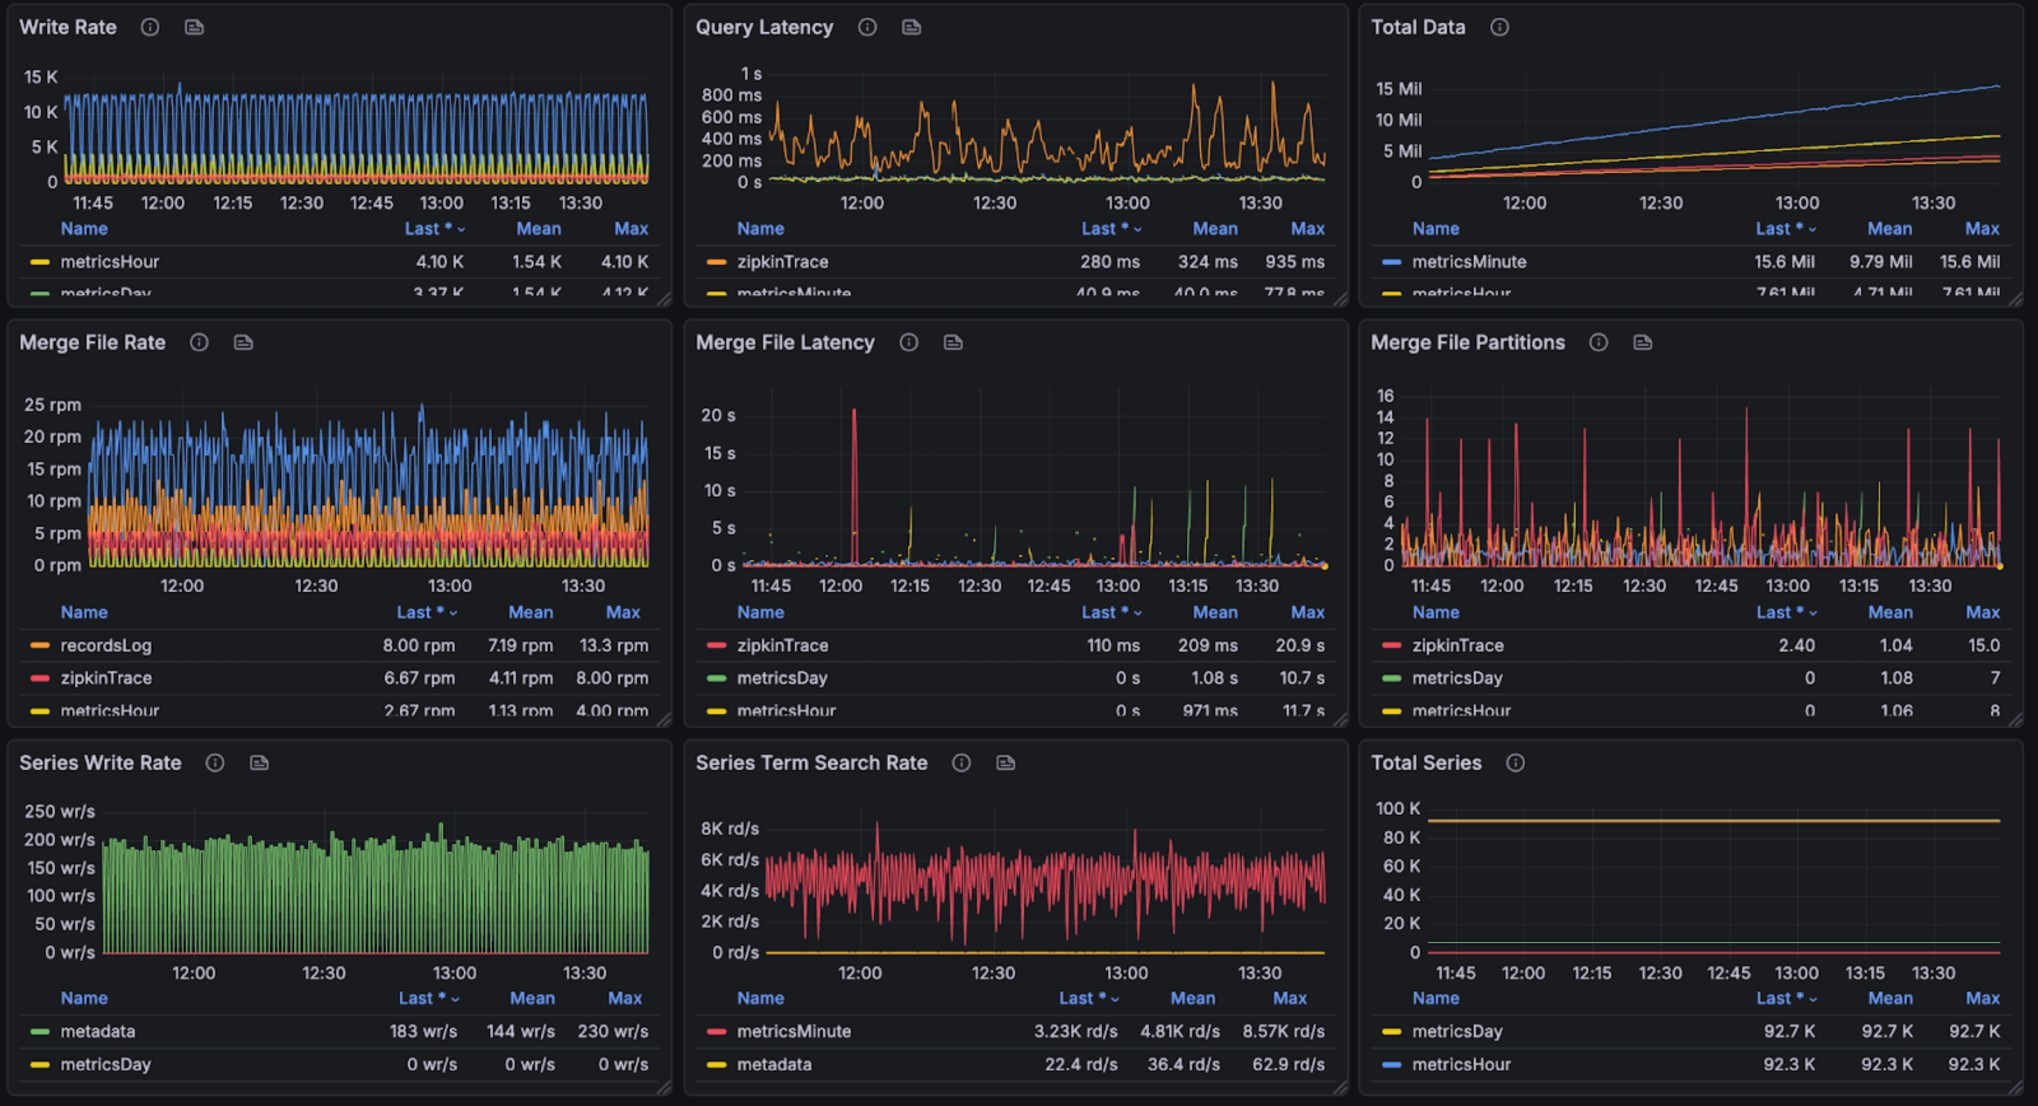 +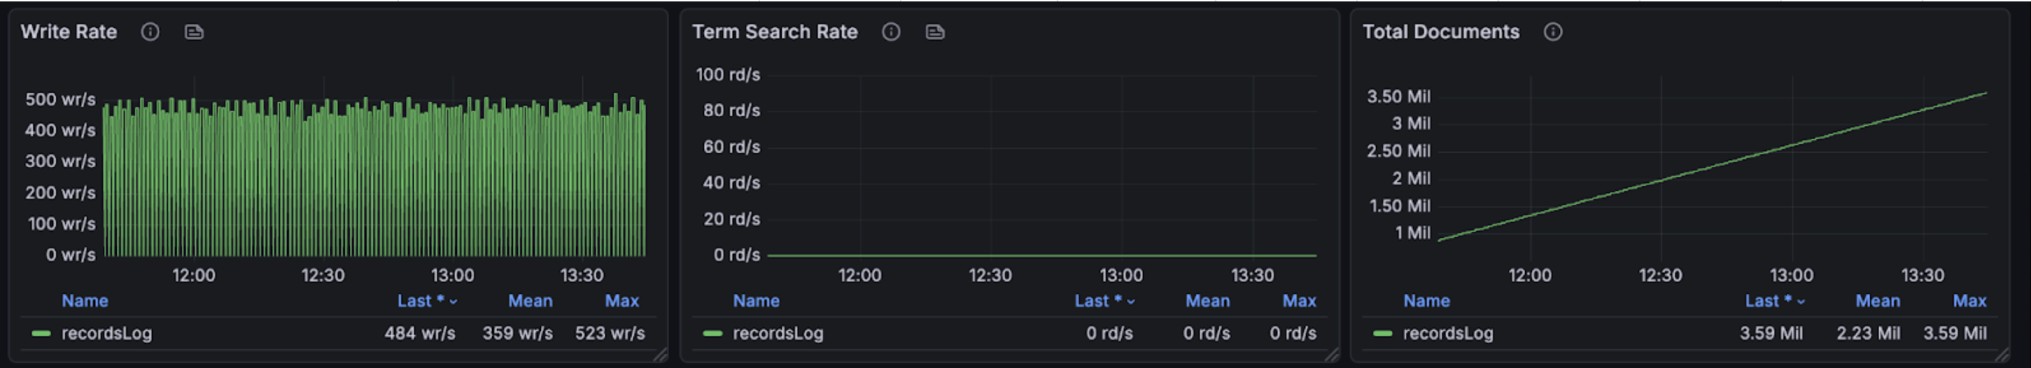 + +## Large specification Test Environment + +This large specification benchmark was conducted on a Kubernetes cluster with a single node (32 cores, 128GB RAM), deploying a complete BanyanDB cluster with lifecycle support using the [skywalking-banyandb-helm chart](https://github.com/apache/skywalking-banyandb-helm). +Similar to the small specification configuration, except that in the large specification setup, **both the liaison and data nodes have been upgraded from 2 cores and 4GB memory to 4 cores and 8GB memory**. + +### Write + +The test involves 426 services, 2,820 instances, and 4,500 endpoints. These entities produce over 21,600 logs per minute, +write 599,400 spans per minute(max 8,000 spans per second). +Note, ~23x more spans compared with small specification test. +31.44g disk volume in 2 hours for all telemetry data, 31.2g disk volume in 2 hours for trace. Review Comment: Please calculate for 7 days. It makes more sense for end users. -- This is an automated message from the Apache Git Service. To respond to the message, please log on to GitHub and use the URL above to go to the specific comment. To unsubscribe, e-mail: [email protected] For queries about this service, please contact Infrastructure at: [email protected]