This is an automated email from the ASF dual-hosted git repository.

wusheng pushed a commit to branch main
in repository https://gitbox.apache.org/repos/asf/skywalking-banyandb.git
The following commit(s) were added to refs/heads/main by this push:
new 25dbf45f Add mix write and read scenario benchmark (#880)
25dbf45f is described below
commit 25dbf45fadc45133ade54253fe774ae0edcb5405
Author: mrproliu <[email protected]>
AuthorDate: Fri Dec 5 00:46:17 2025 +0800
Add mix write and read scenario benchmark (#880)
---
docs/menu.yml | 6 +-
docs/operation/benchmark/benchmark-hybrid-0.9.0.md | 96 ++++++++++++++++++++++
...rk-0.9.0.md => benchmark-single-model-0.9.0.md} | 2 +-
3 files changed, 101 insertions(+), 3 deletions(-)
diff --git a/docs/menu.yml b/docs/menu.yml
index 434c9be6..7d42ada3 100644
--- a/docs/menu.yml
+++ b/docs/menu.yml
@@ -153,8 +153,10 @@ catalog:
path: "/concept/property-repair"
- name: "Benchmark"
catalog:
- - name: "v0.9.0"
- path: "/operation/benchmark/benchmark-0.9.0"
+ - name: "Single‑Model Benchmark (Trace / Log / Measure / Property)"
+ path: "/operation/benchmark/benchmark-single-model-0.9.0"
+ - name: "Hybrid Scenario Benchmark"
+ path: "/operation/benchmark/benchmark-hybrid-0.9.0"
- name: "File Format"
catalog:
- name: "v1.3.0"
diff --git a/docs/operation/benchmark/benchmark-hybrid-0.9.0.md
b/docs/operation/benchmark/benchmark-hybrid-0.9.0.md
new file mode 100644
index 00000000..8a27c870
--- /dev/null
+++ b/docs/operation/benchmark/benchmark-hybrid-0.9.0.md
@@ -0,0 +1,96 @@
+# Hybrid Scenario Benchmark
+
+The Hybrid Scenario Benchmark is designed for the SkyWalking OAP to evaluate
typical full‑stack observability scenarios.
+It generates metrics, logs, and traces in proportional ratios, and conducts
performance tests under various cluster scales and sampling rates.
+The goal is to simulate and reproduce real‑world production performance
characteristics and resource consumption.
+
+## Version Information
+
+- **BanyanDB Version**: 0.9.0
+- **Commit**: a2479b1c7dd805b74bffbc5f9317da9df6ac95a5
+
+## Minimal specification Test Environment
+
+This small specification benchmark was conducted on a Kubernetes cluster with
a single node (16 cores, 64GB RAM), deploying a complete BanyanDB cluster with
lifecycle support using the [skywalking-banyandb-helm
chart](https://github.com/apache/skywalking-banyandb-helm).
+Each BanyanDB Pod is configured with resource limits of 2 cores and 4GB memory.
+
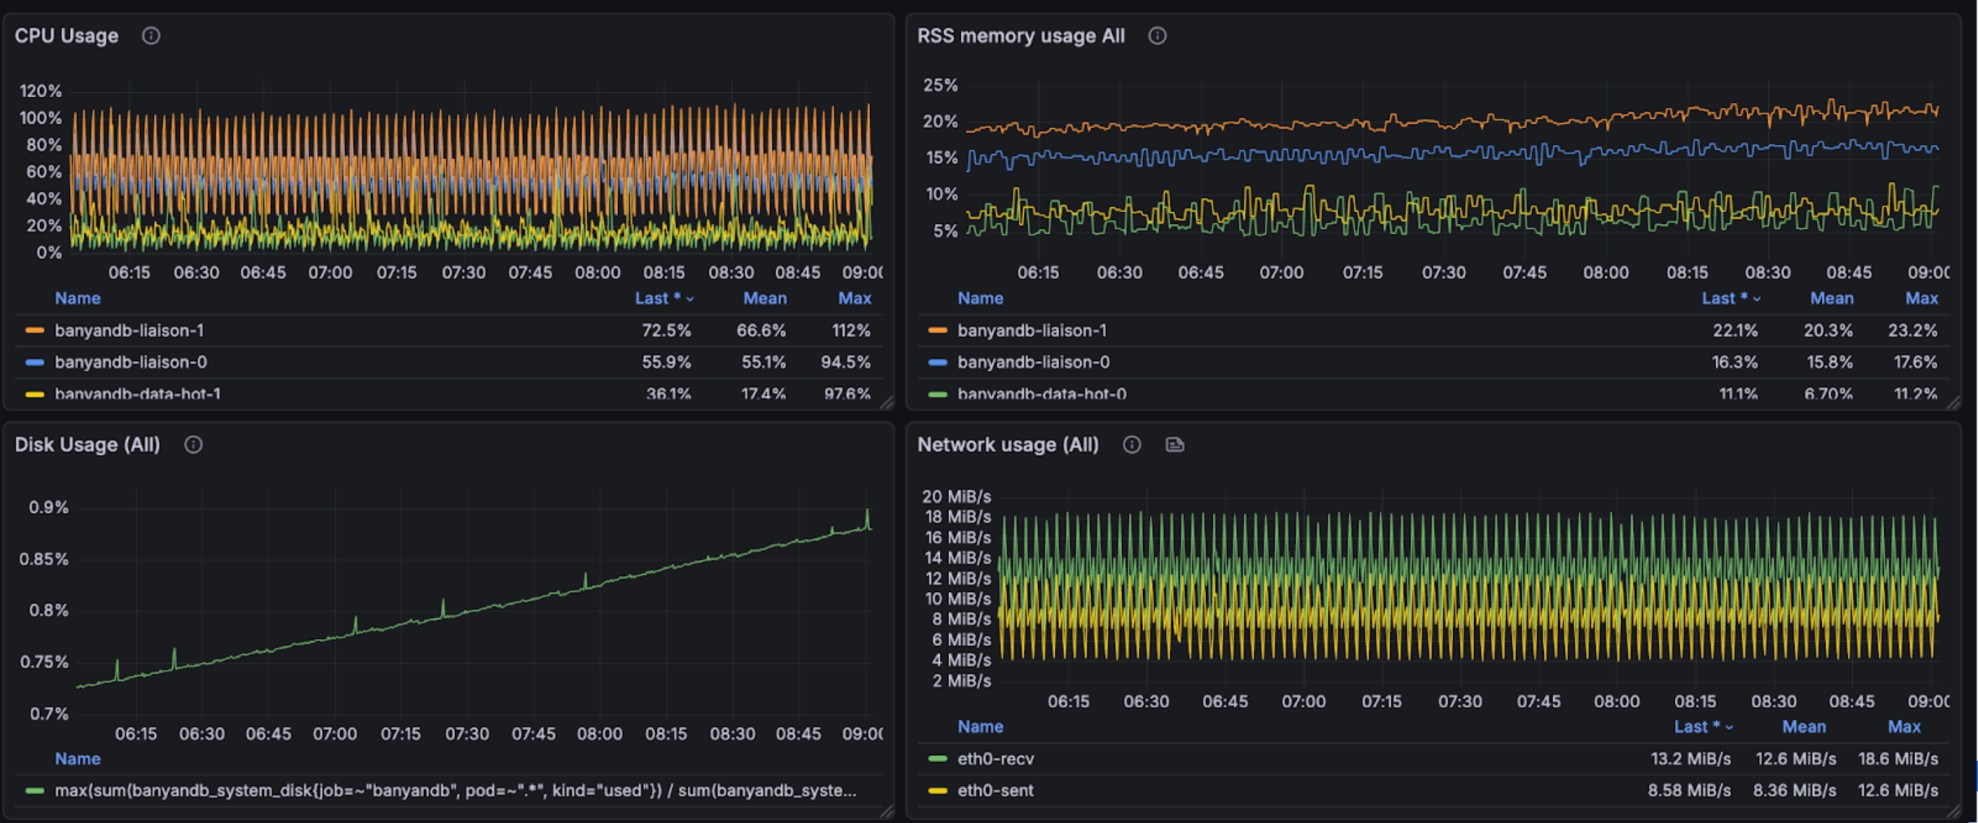
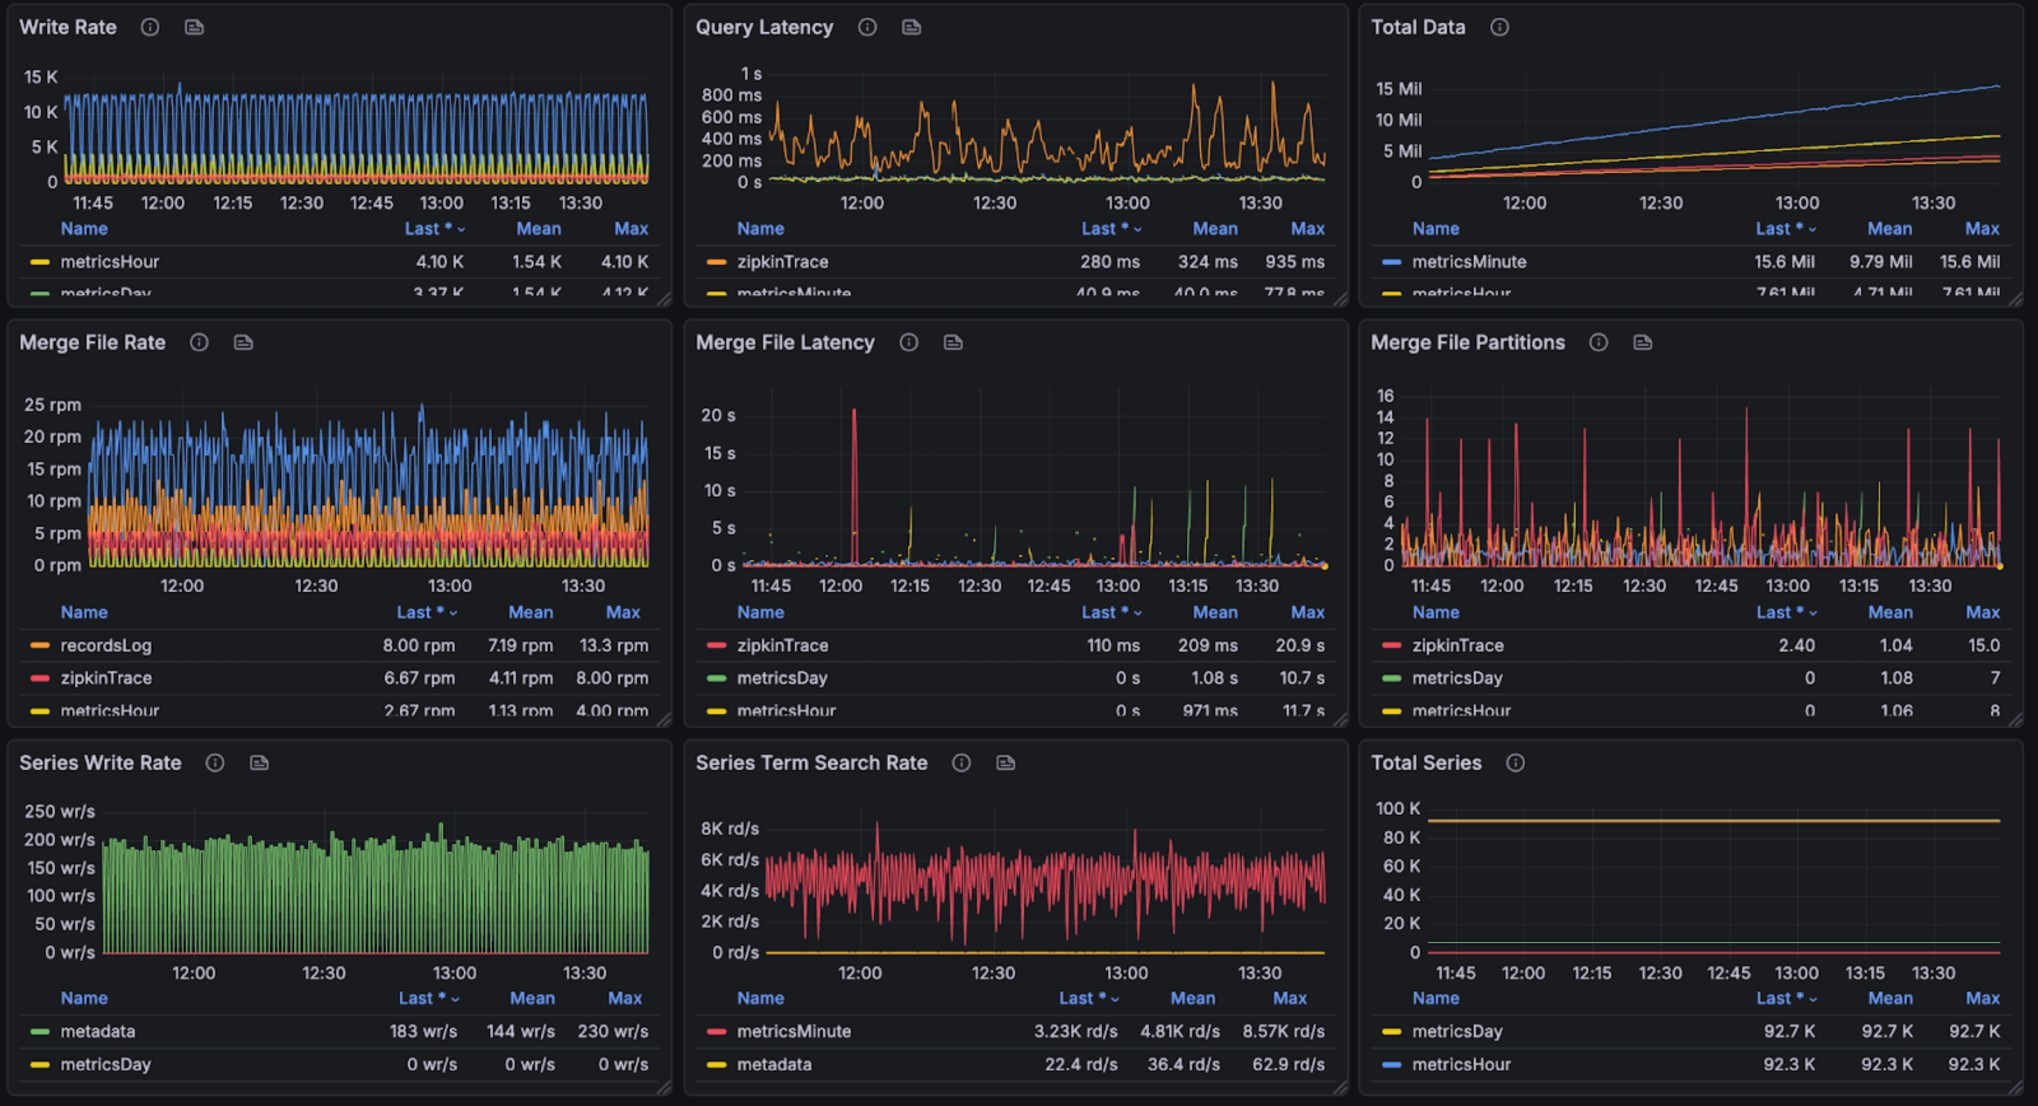
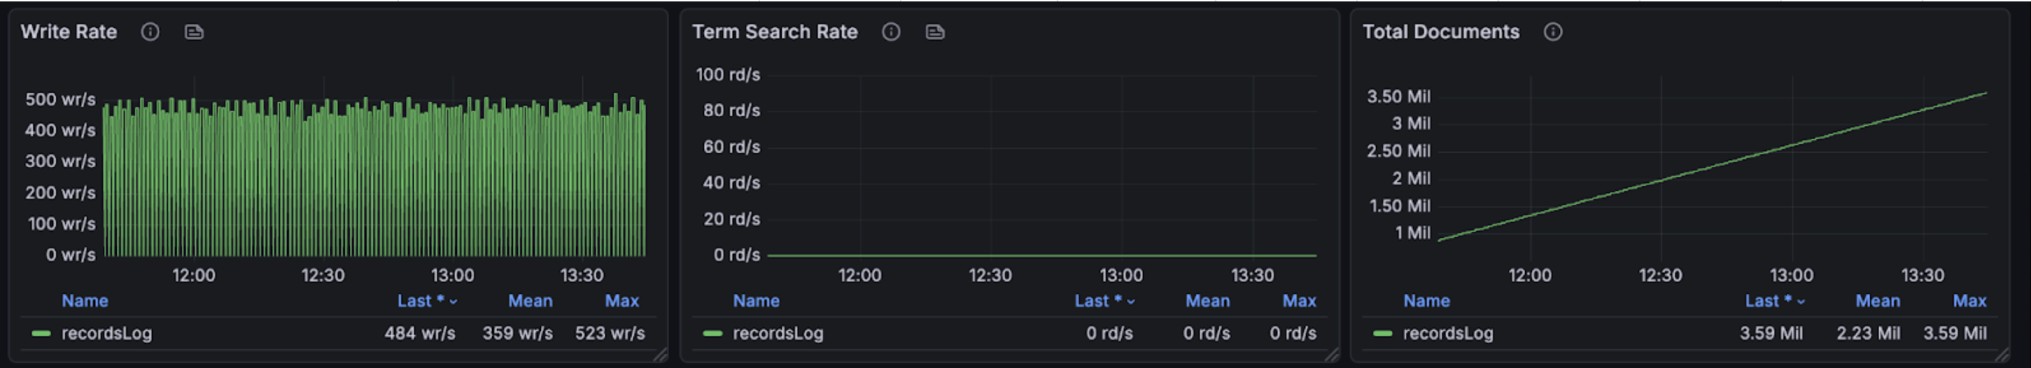
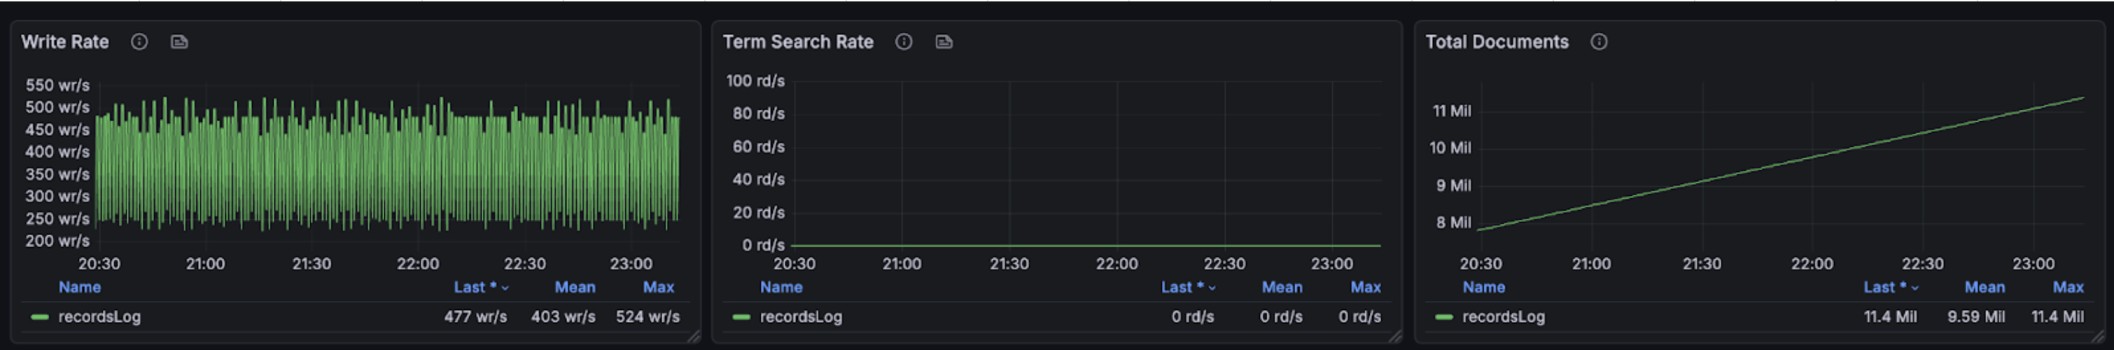
+### Write
+
+The test involves 426 services, 2,820 instances, and 4,500 endpoints. These
entities produce over 21,600 logs per minute,
+write 26640 spans per minute(max 4000 spans per second).
+1.178g disk volume in 2 hours for all telemetry data, 0.85g disk volume in 2
hours for trace.
+It should takes over ~100g dist volume in 7 days for all telemetry, and ~75g
in 7 days for trace.
+
+The following graphs illustrate the resource usage during write operations,
showing CPU and memory consumption across the BanyanDB cluster:
+
+
+
+
+
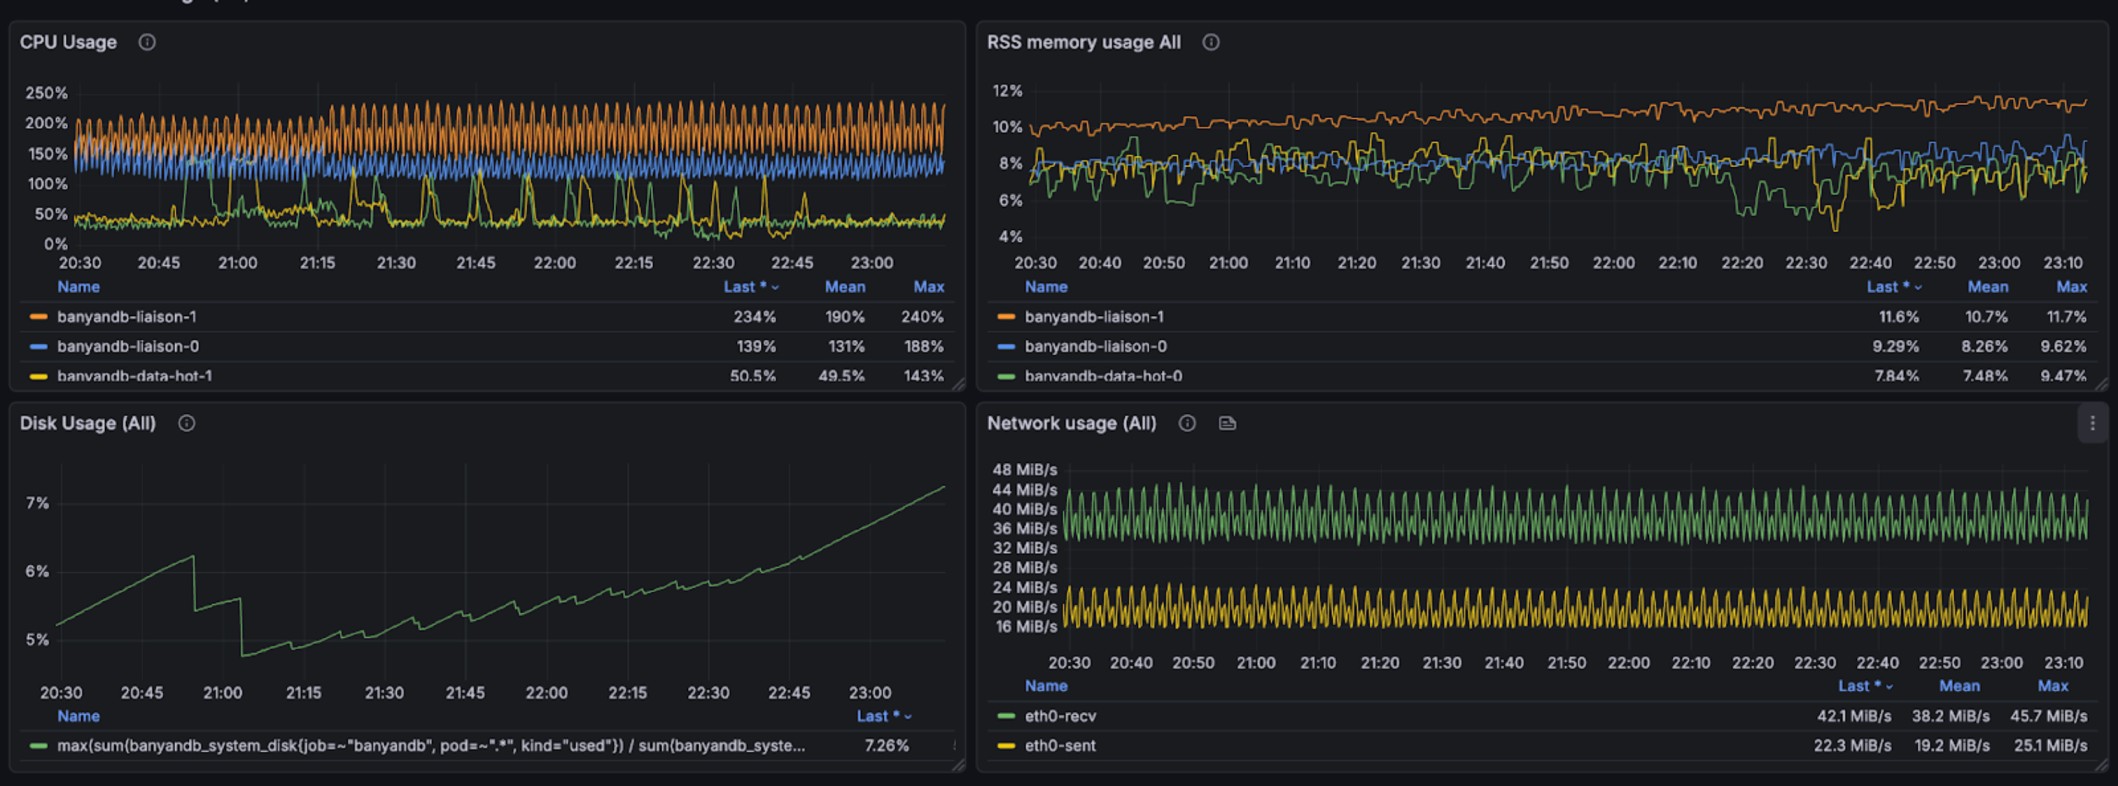
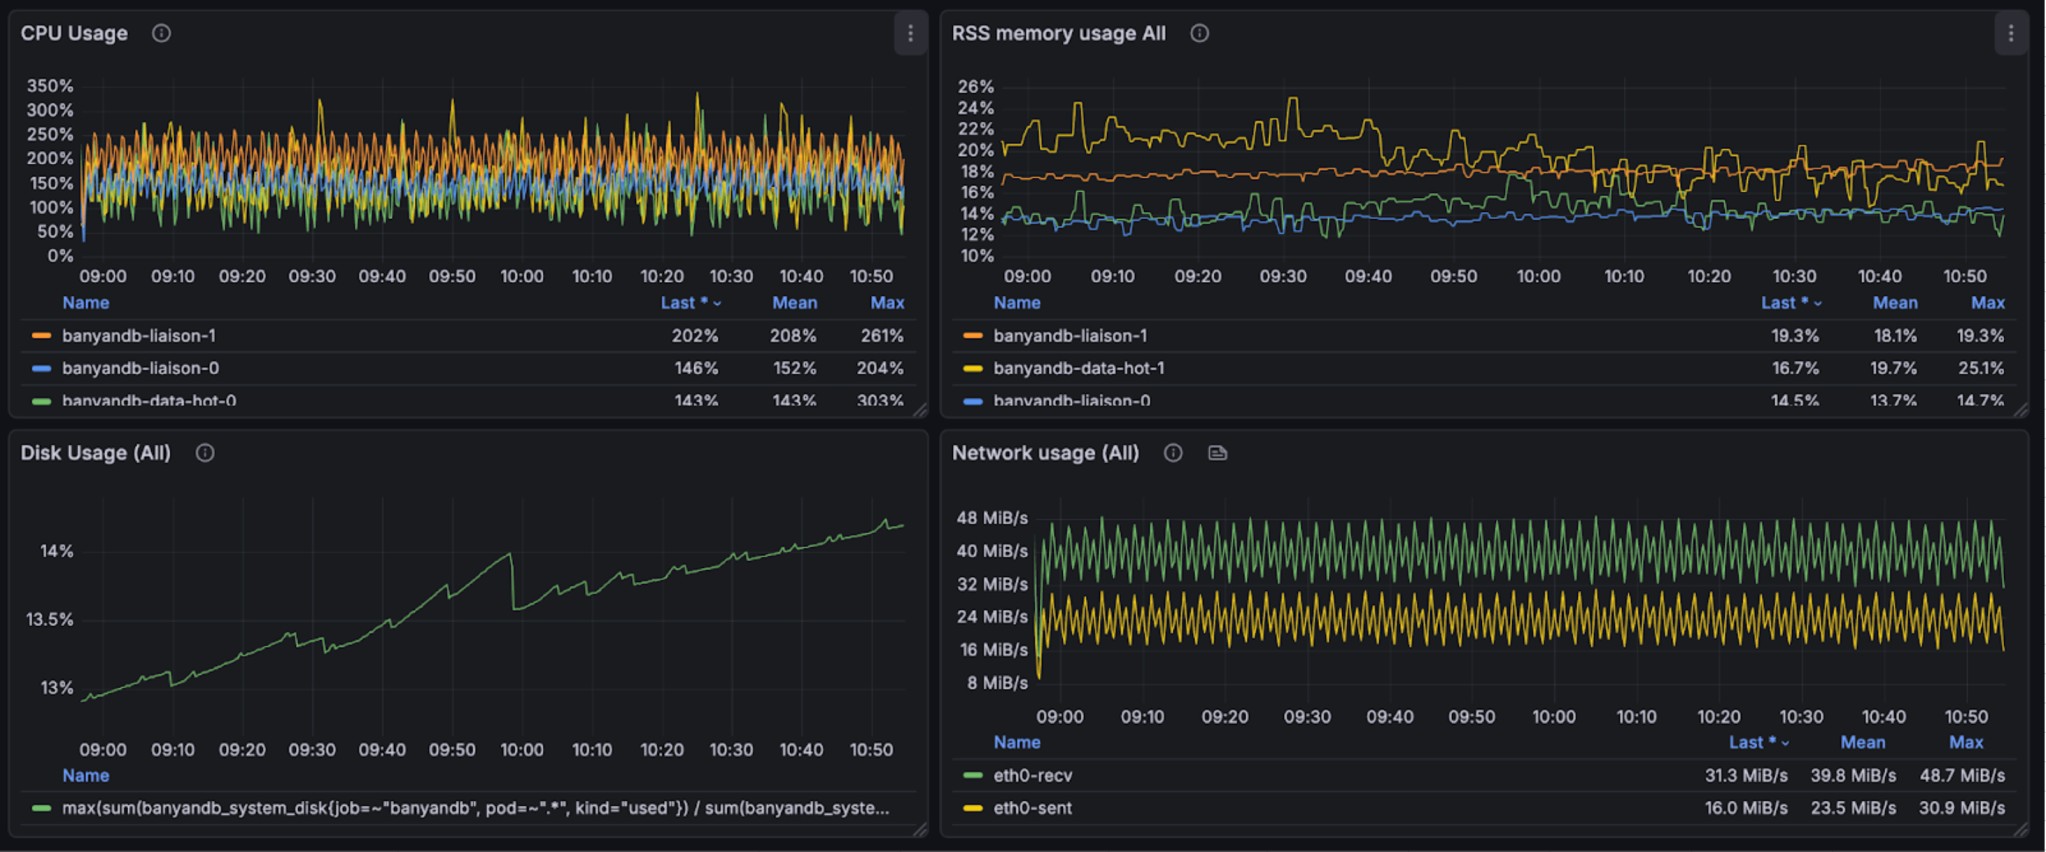
+### Read
+
+During query and writing, it takes 200% CPU, 26% avg, 35% peak memory
cost(total 4g).
+Note, other parts are used by OS Page Cache. We don't have measurement to
check the efficiency of that.
+
+The query performance metrics per request are as follows:
+
+- Log Query Performance: min,max,mean,median,p90,p95,p98,p99
duration(millisecond): 3.977926, 368.129126, 58.283439, 46.903162, 114.155032,
152.219269, 190.683562, 271.887189
+- Trace Query Performance: min,max,mean,median,p90,p95,p98,p99
duration(millisecond): 40.465124, 1223.494809, 337.795821, 305.647714,
610.154281, 703.630915, 905.547645, 988.851445
+- Metrics query in major dashboards are good.
+
+The graphs below show resource utilization during combined read and write
operations, demonstrating BanyanDB's ability to handle concurrent workloads:
+
+
+
+
+
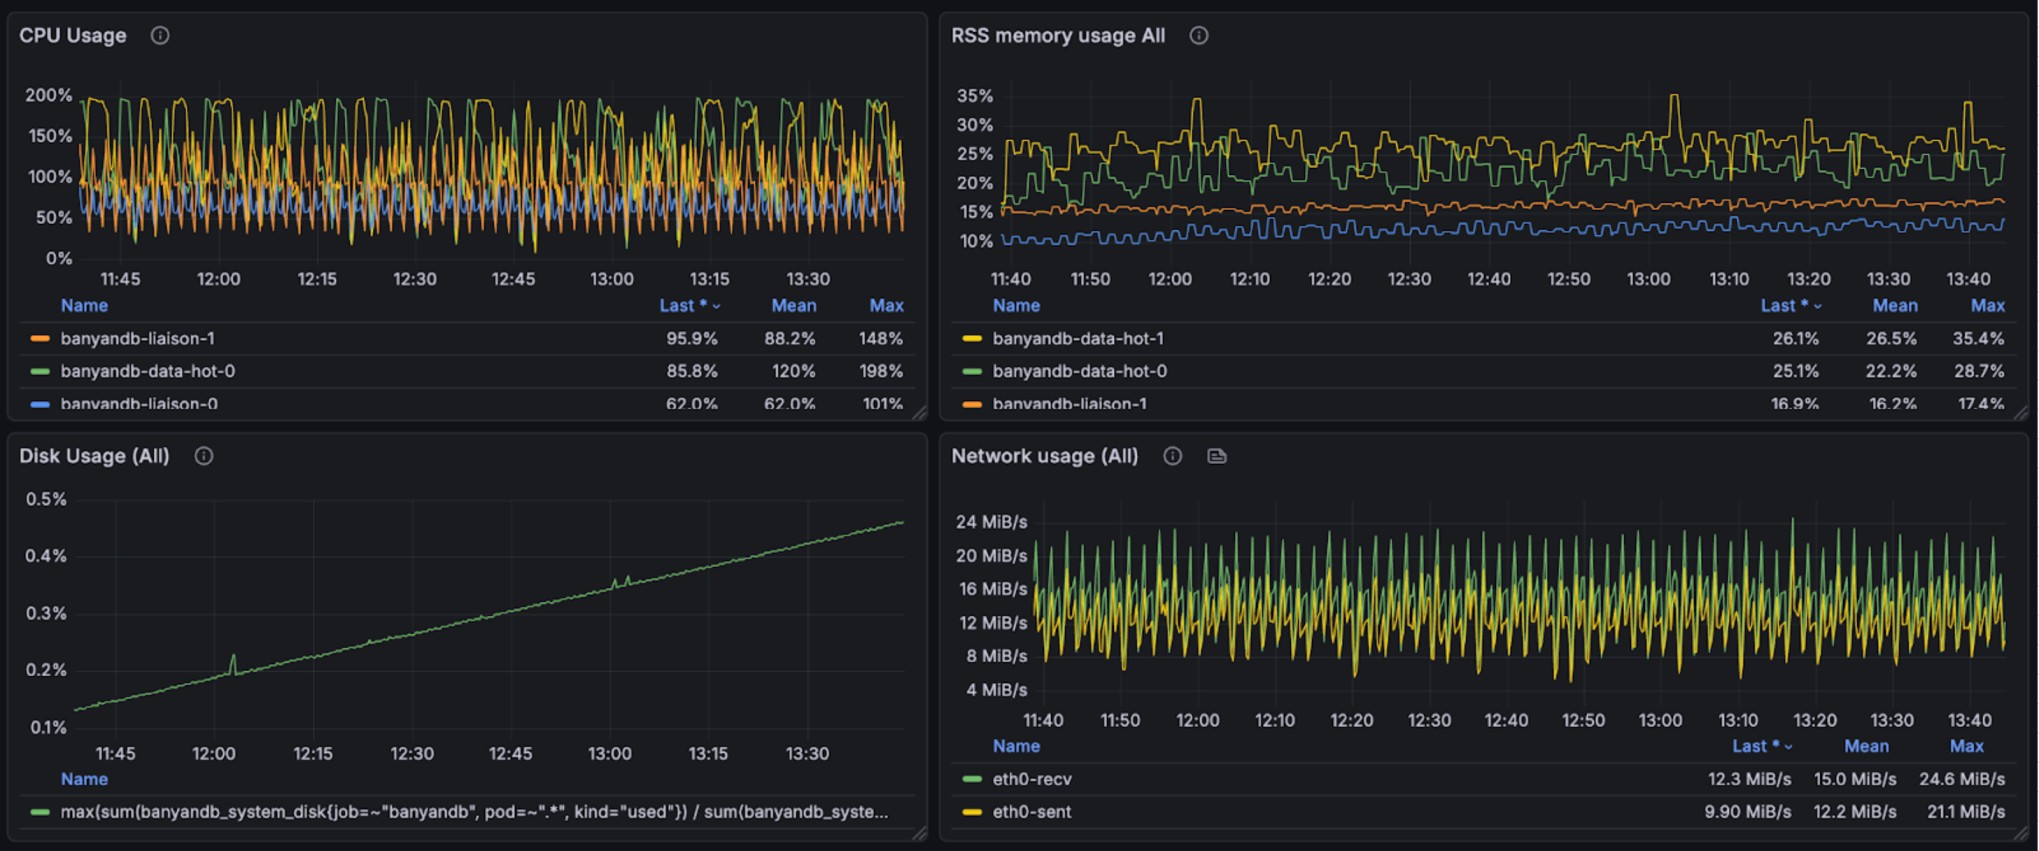
+## Standard specification Test Environment
+
+This Standard specification benchmark was conducted on a Kubernetes cluster
with a single node (32 cores, 128GB RAM), deploying a complete BanyanDB cluster
with lifecycle support using the [skywalking-banyandb-helm
chart](https://github.com/apache/skywalking-banyandb-helm).
+Similar to the small specification configuration, except that in the standard
specification setup, **both the liaison and data nodes have been upgraded from
2 cores and 4GB memory to 4 cores and 8GB memory**.
+
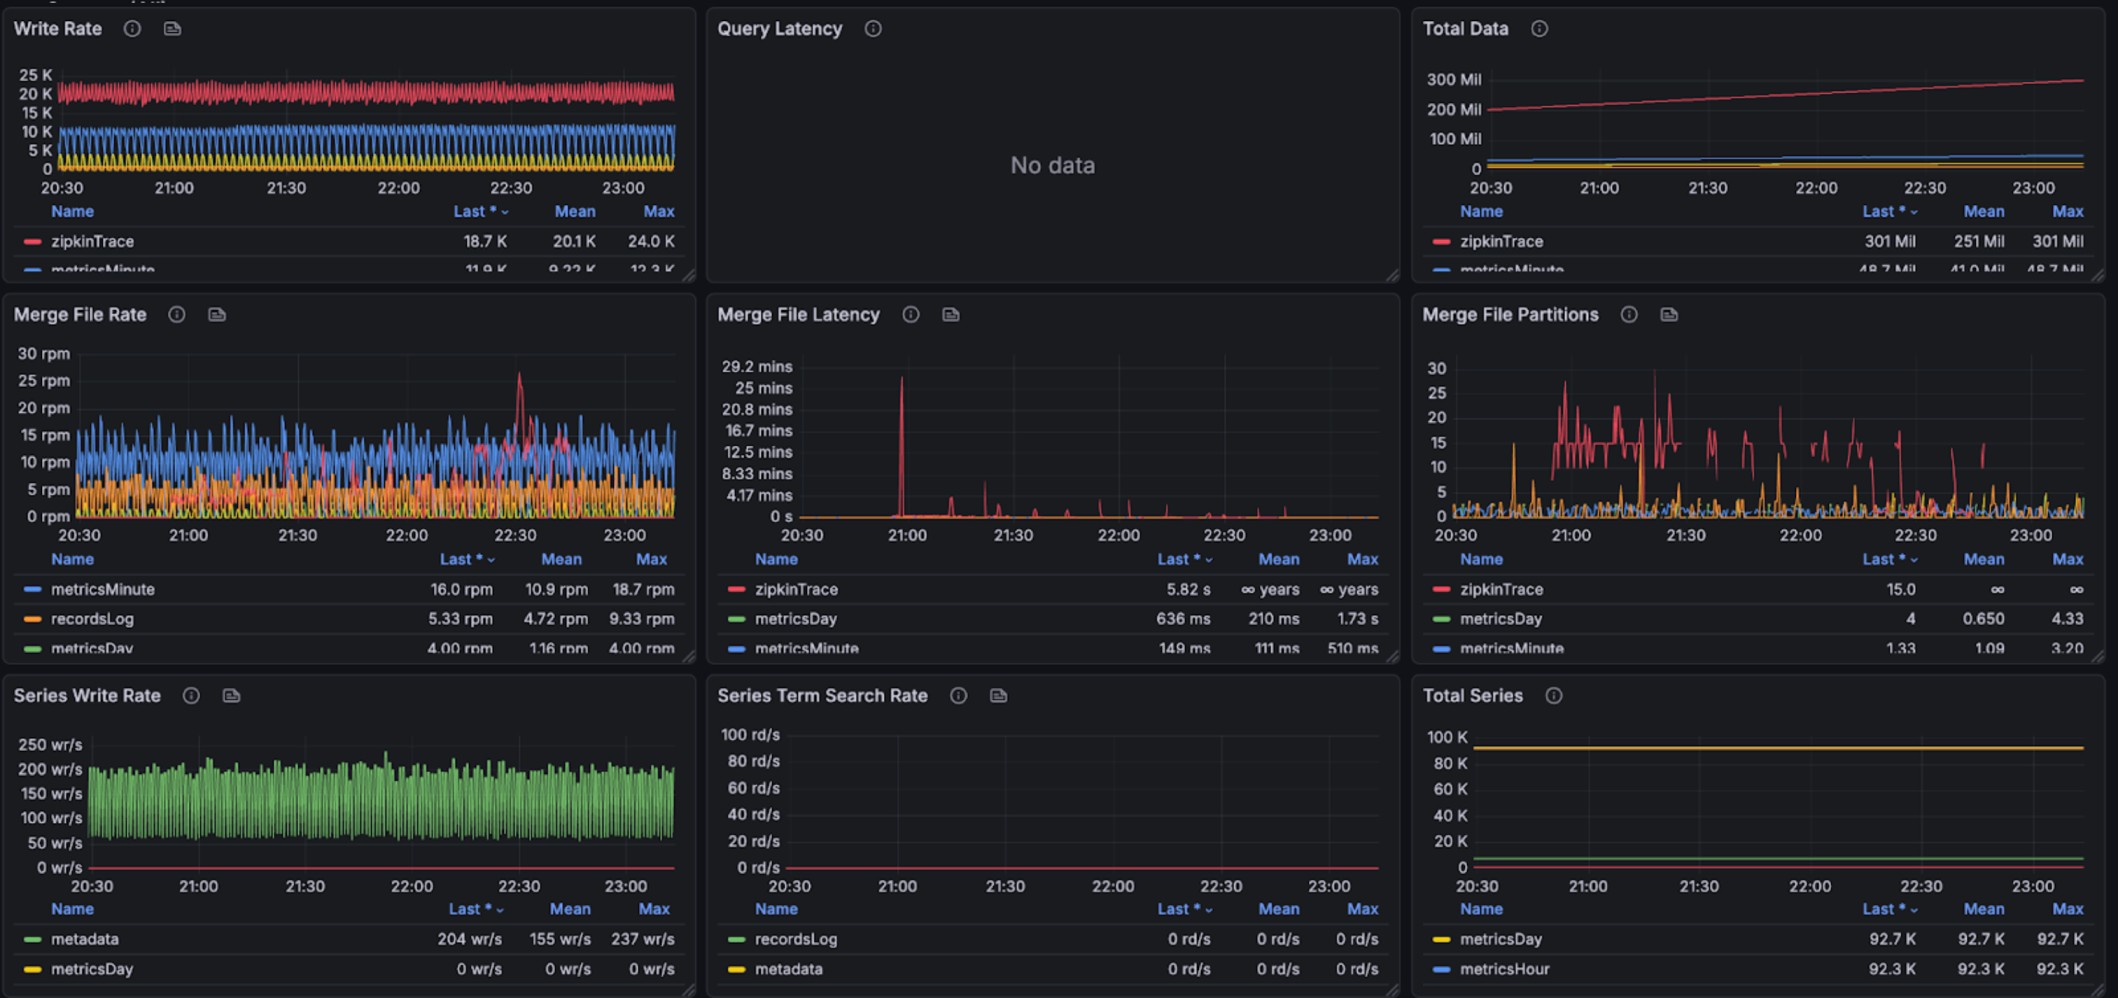
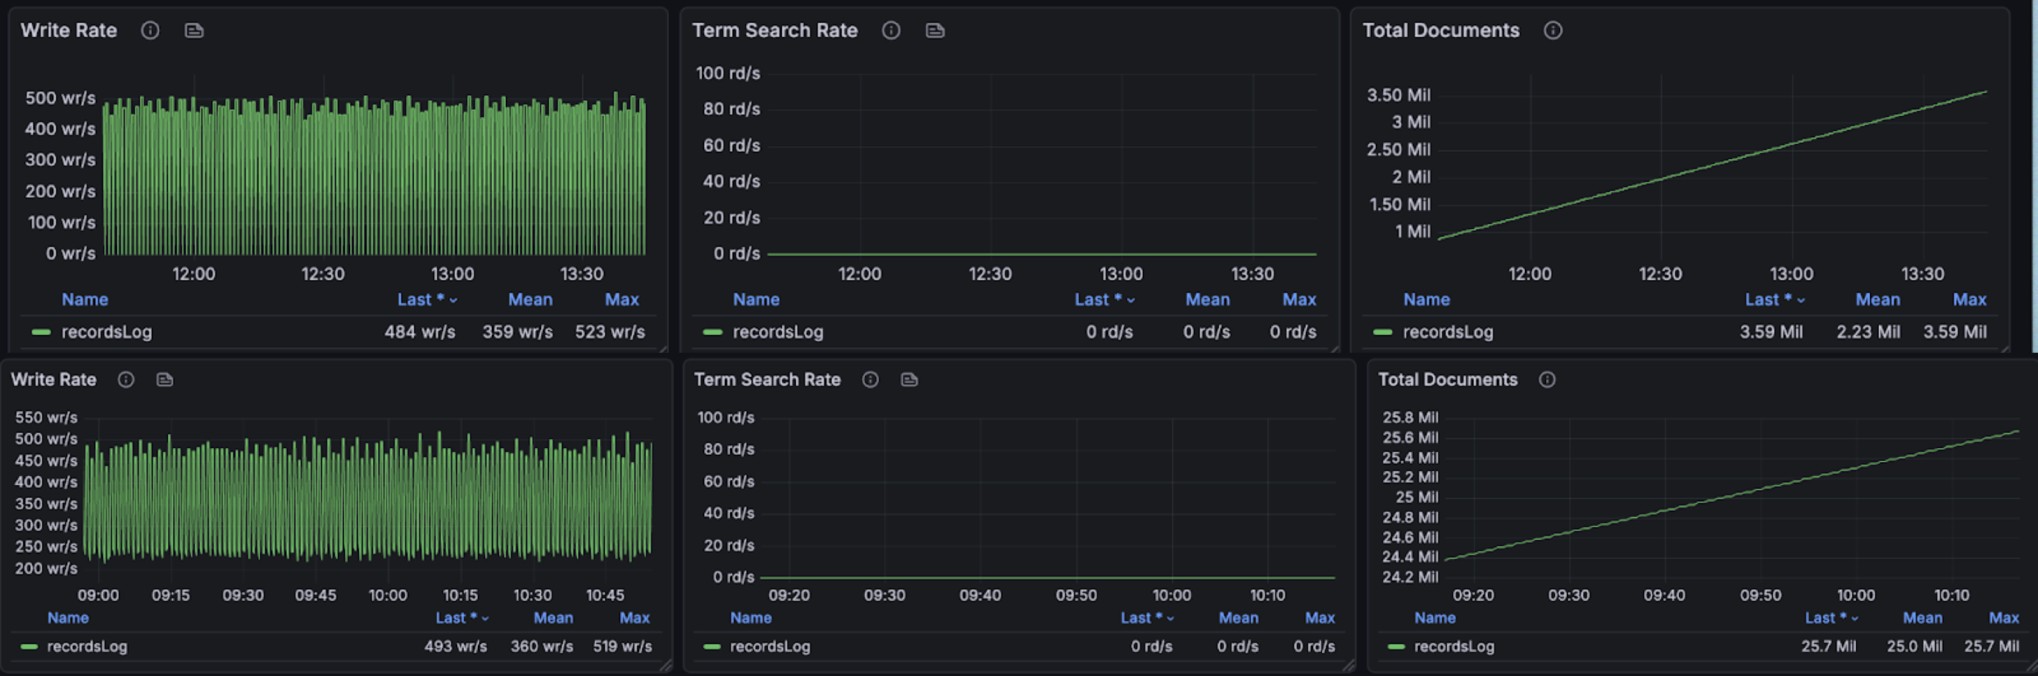
+### Write
+
+The test involves 426 services, 2,820 instances, and 4,500 endpoints. These
entities produce over 21,600 logs per minute,
+write 599,400 spans per minute(max 8,000 spans per second).
+Note, ~23x more spans compared with small specification test.
+31.44g disk volume in 2 hours for all telemetry data, 31.2g disk volume in 2
hours for trace.
+It should takes over ~3pb dist volume in 7 days for all telemtry, and 2.8pb
for trace,
+
+The following graphs illustrate the resource usage during write operations,
showing CPU and memory consumption across the BanyanDB cluster:
+
+
+
+
+
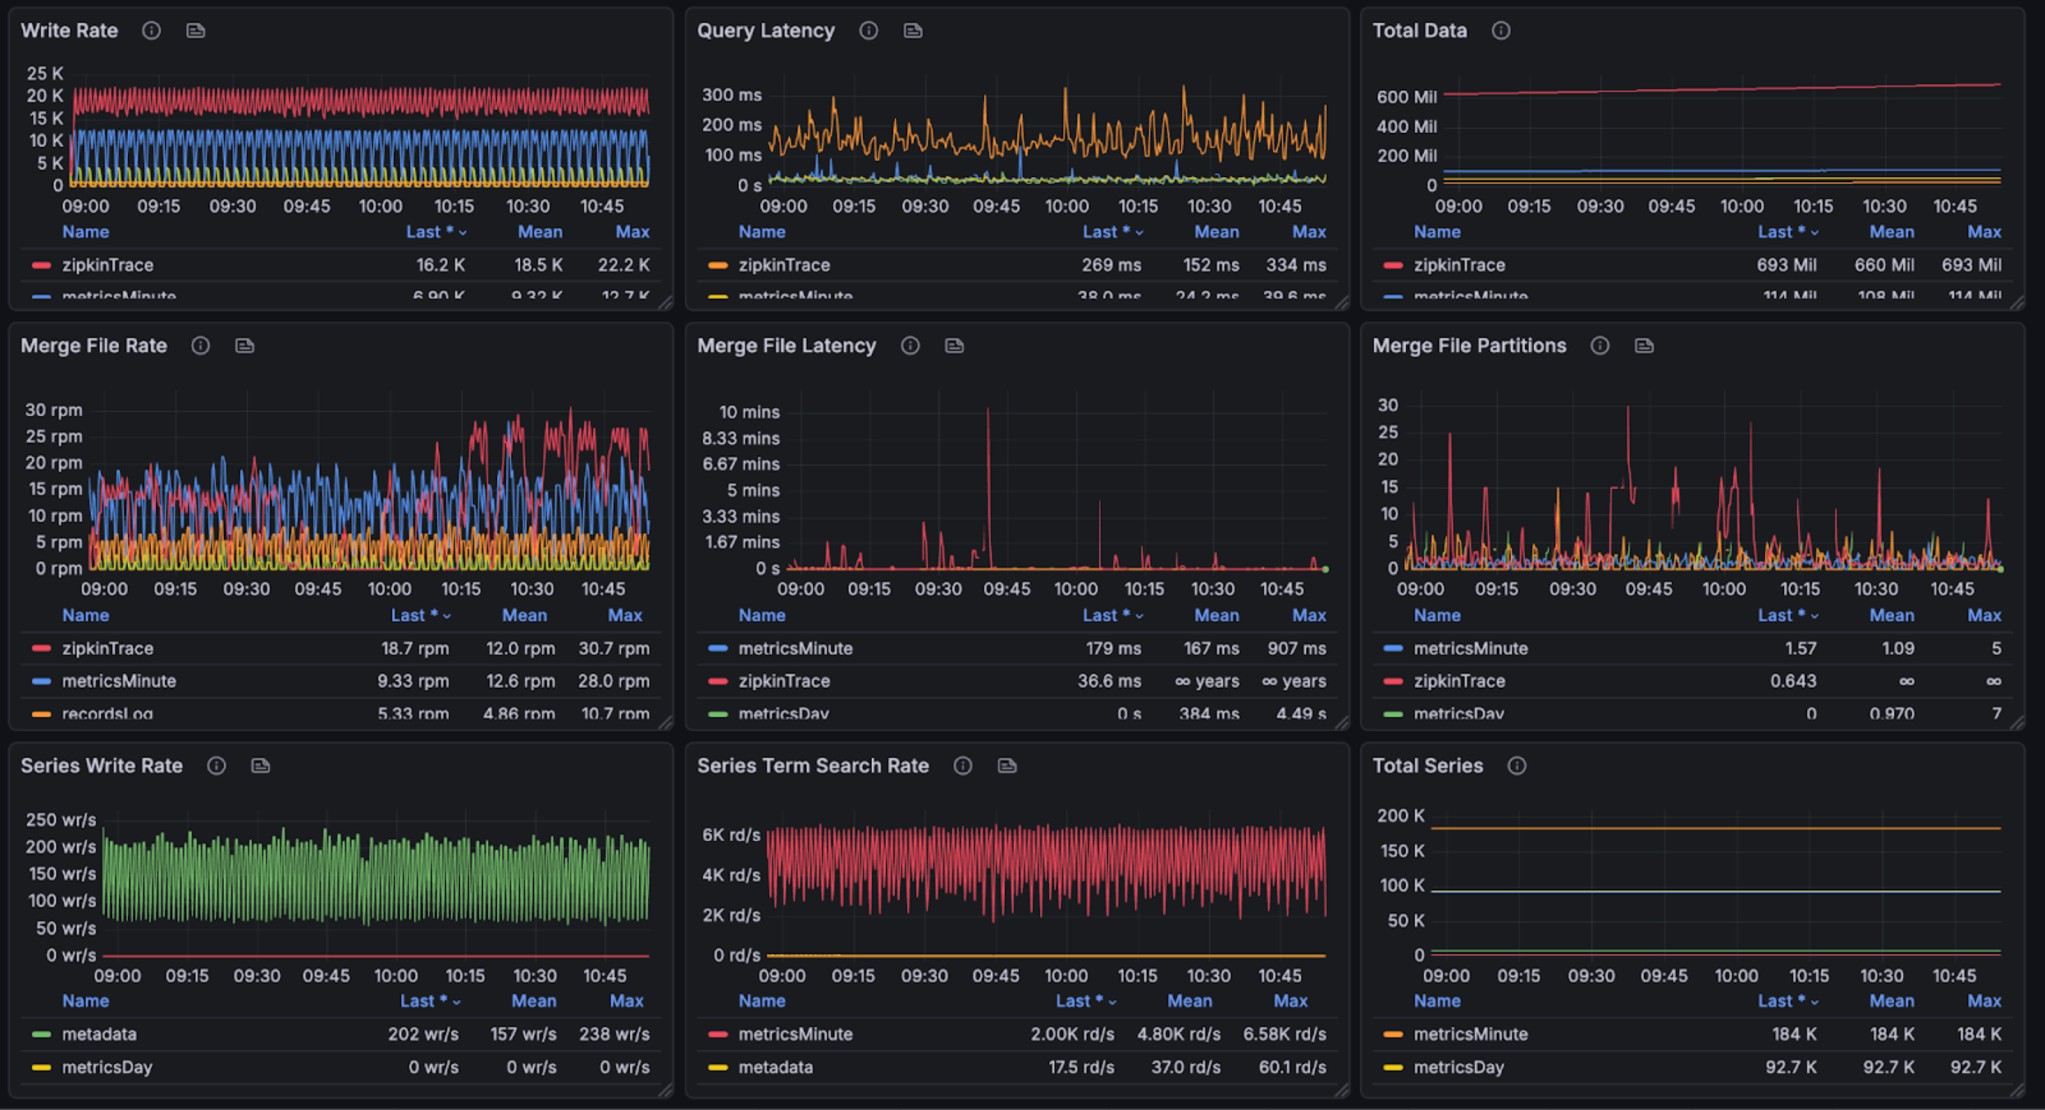
+### Read
+
+During query and writing, 250% CPU(few peak in 350%), 20% avg, 25% peak memory
cost(total 8g).
+Note, other parts are used by OS Page Cache. We don't have measurement to
check the efficiency of that.
+
+The query performance metrics per request are as follows:
+
+- Log Query Performance: min,max,mean,median,p90,p95,p98,p99
duration(millisecond): 2.302522, 208.608713, 33.616845, 22.217282, 74.080696,
105.510697, 128.287975, 167.144936
+- Trace Query Performance: min,max,mean,median,p90,p95,p98,p99
duration(millisecond): 51.433364, 356.743882, 142.805840, 129.244039,
234.051115, 245.536086, 271.894946, 301.822043
+- Metrics query in major dashboards are good.
+
+The graphs below show resource utilization during combined read and write
operations, demonstrating BanyanDB's ability to handle concurrent workloads:
+
+
+
+
+
+
+## Summary
+
+This benchmark demonstrates BanyanDB's capability to efficiently handle
high-throughput observability workloads in mixed write and read scenarios.
+
+On a low-spec 2U4G configuration, it supports 426 services, 2,820 instances,
and 4,500 endpoints, processing 21,600 logs per minute
+and writing 26,640 spans per minute (max 4,000 spans per second). It maintains
low disk utilization even under concurrent read/write loads, with query
performance remaining responsive.
+
+At the higher 4U8G specification, it can still support 426 services, 2,820
instances, and 4,500 endpoints, process 21,600 logs per minute,
+and write 599,400 spans per minute (max 8,000 spans per second). During
massive trace writes, it maintains low system utilization and minimal disk
usage.
+Query performance also outperforms lower-spec configurations.
+
+The above comparisons across low- and high-spec configurations demonstrate
that BanyanDB maintains low resource consumption during writes as
specifications increase,
+while delivering higher throughput when resources are scaled up.
\ No newline at end of file
diff --git a/docs/operation/benchmark/benchmark-0.9.0.md
b/docs/operation/benchmark/benchmark-single-model-0.9.0.md
similarity index 99%
rename from docs/operation/benchmark/benchmark-0.9.0.md
rename to docs/operation/benchmark/benchmark-single-model-0.9.0.md
index 8016da13..1acc9b80 100644
--- a/docs/operation/benchmark/benchmark-0.9.0.md
+++ b/docs/operation/benchmark/benchmark-single-model-0.9.0.md
@@ -1,4 +1,4 @@
-# Benchmark
+Single‑Model Benchmark (Trace / Log / Measure / Property)
## Version Information